Key Level Detector
- 지표
-
Ludovico Reale
 Trader and educator since 2012, with over 500 publications and years of teaching experience. I help beginner traders and active market participants develop a structured approach based on method, discipline, and realistic expectations—no promises of easy profits—through my services and trading
 - 버전: 1.0
- 활성화: 5
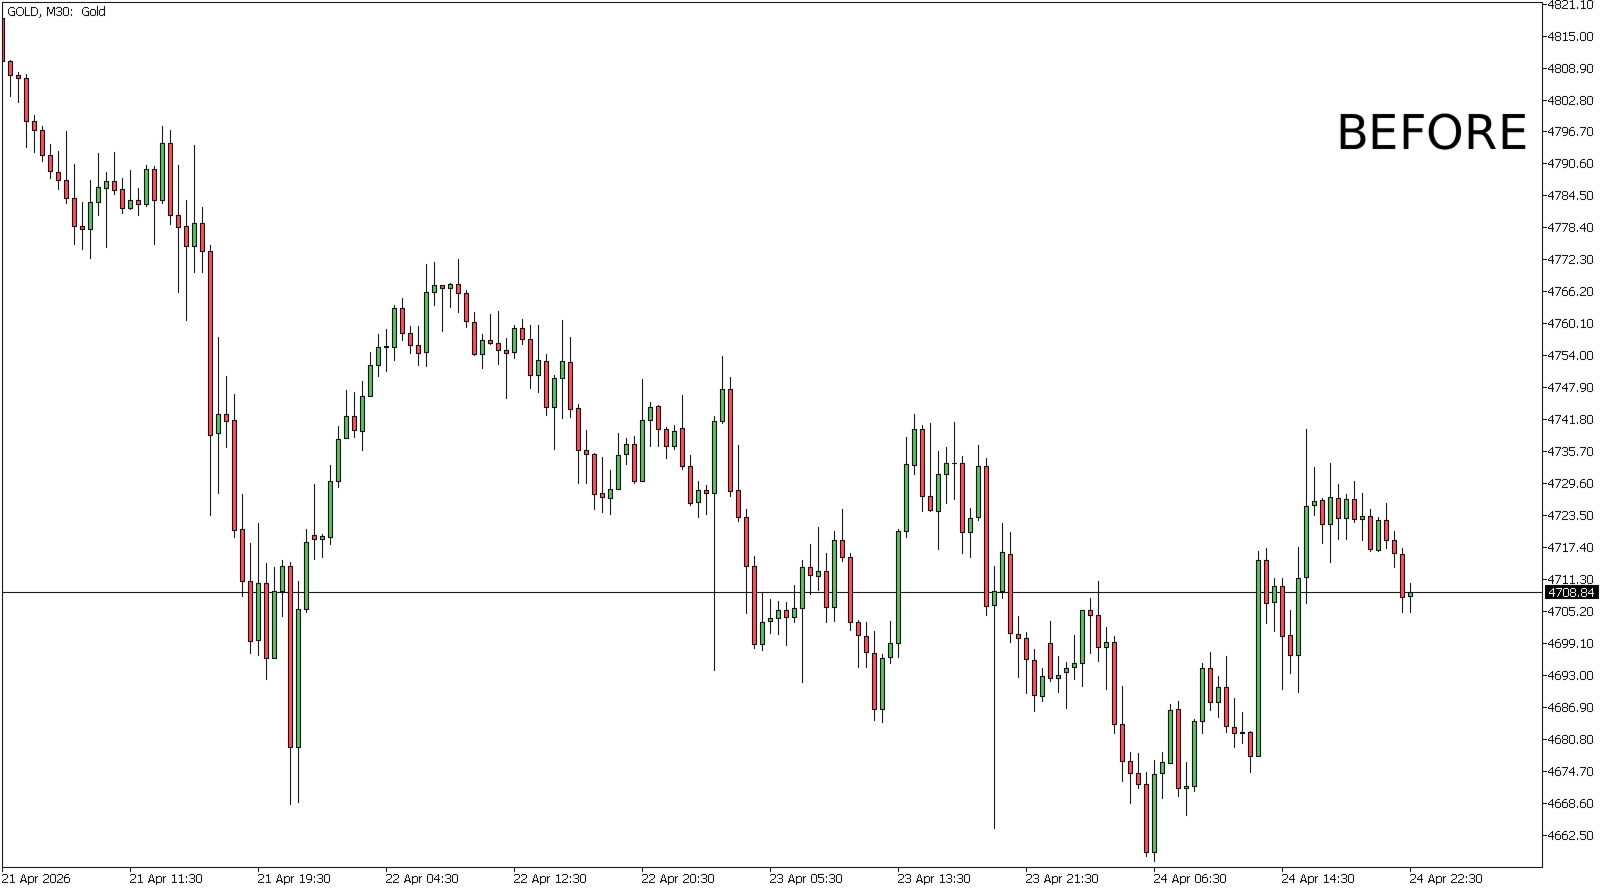
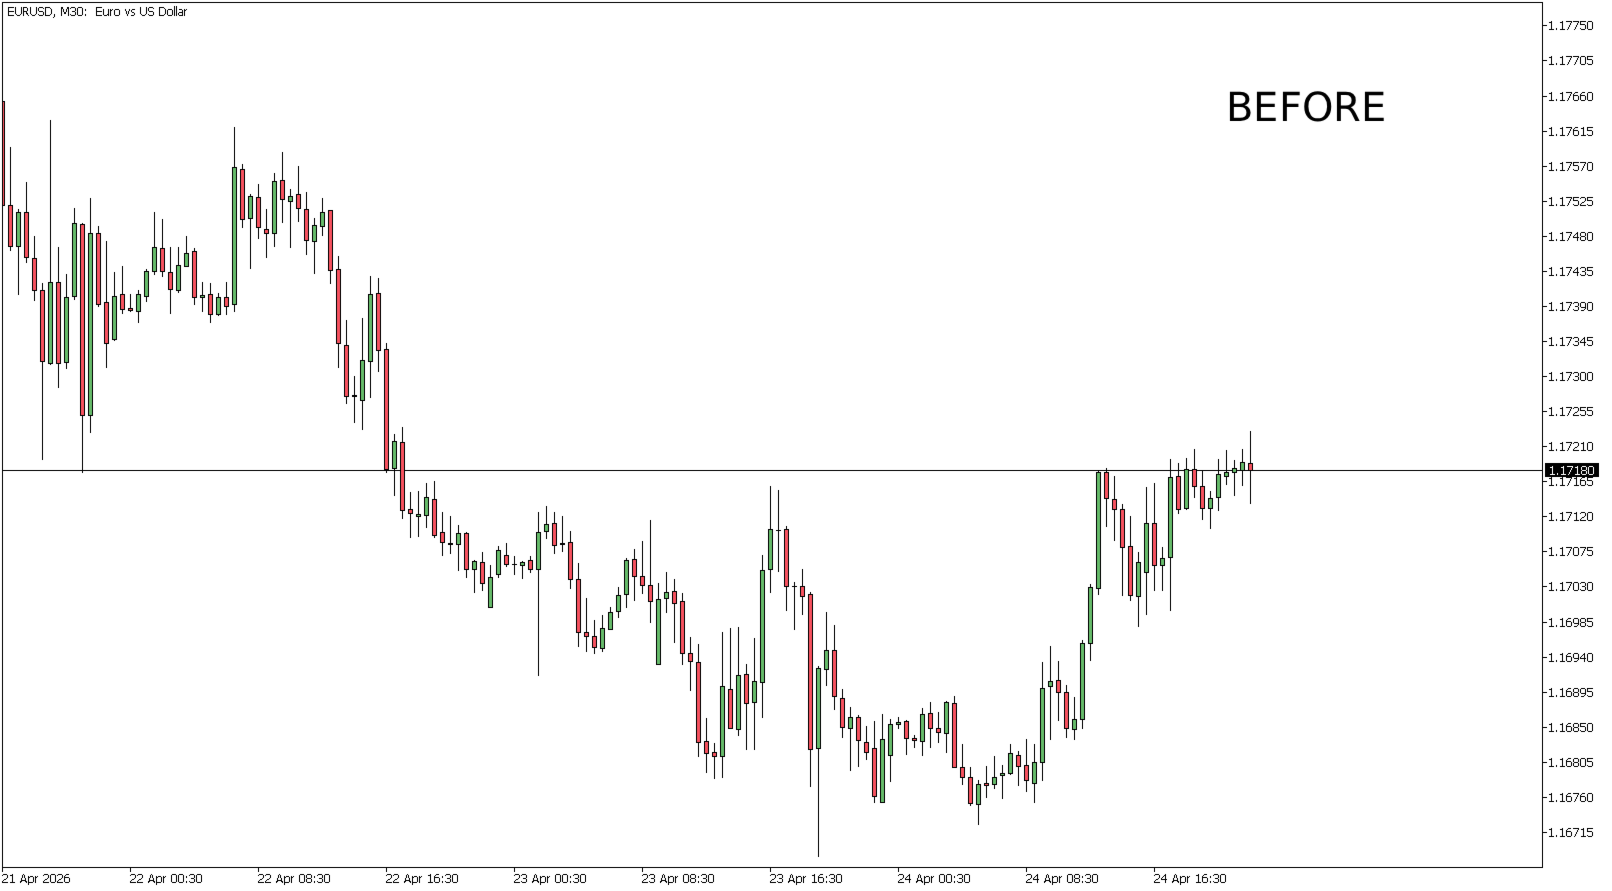
Key Level Detector
Advanced trading indicator for precise market level analysis
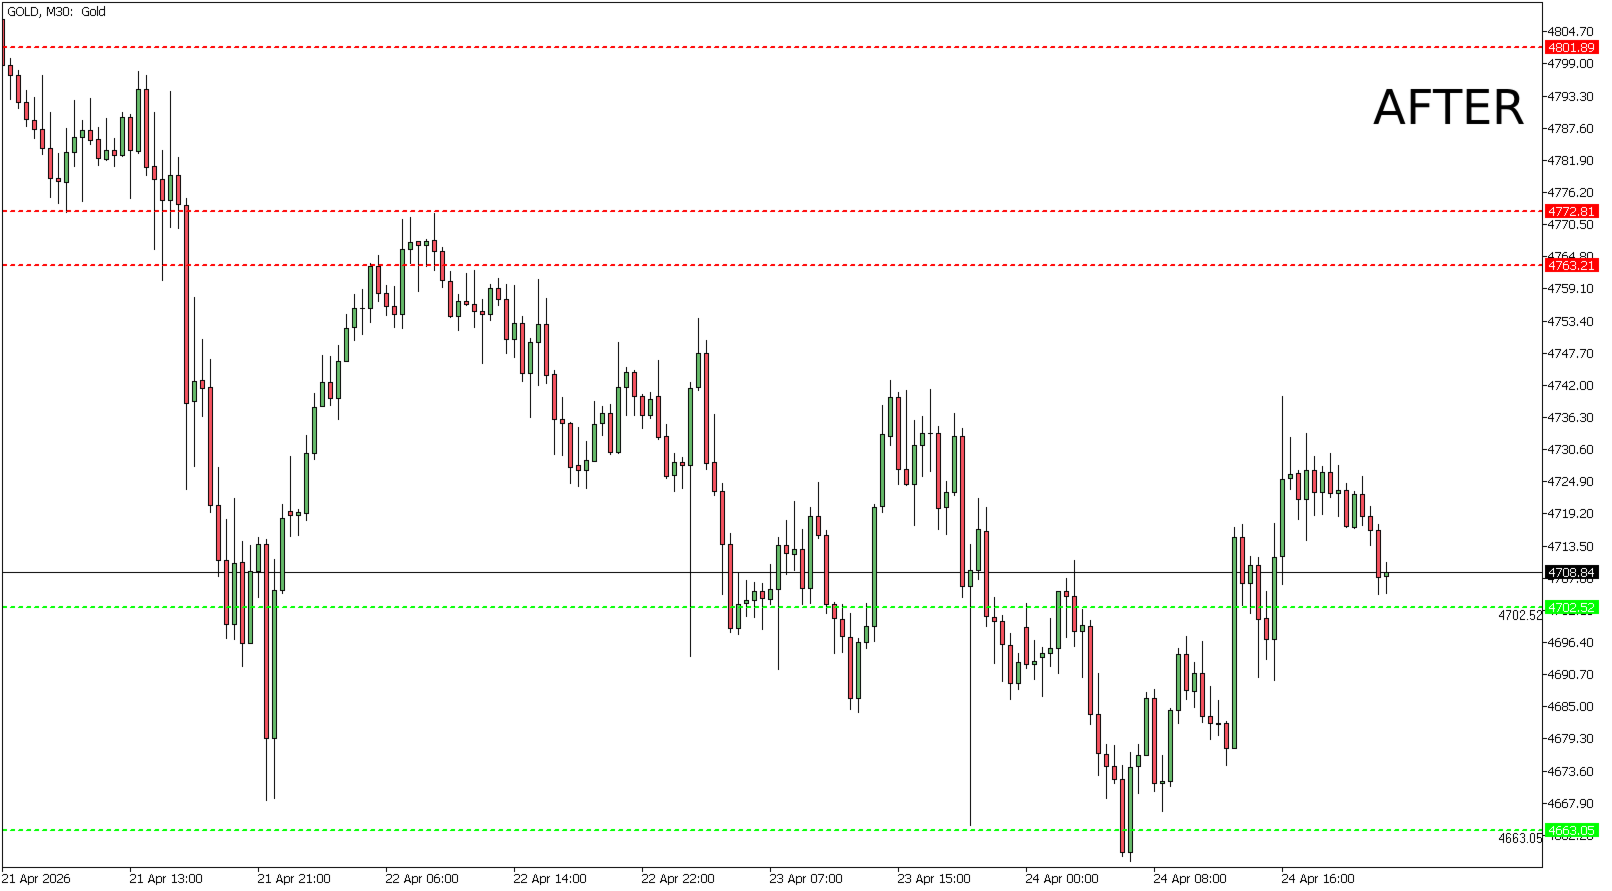
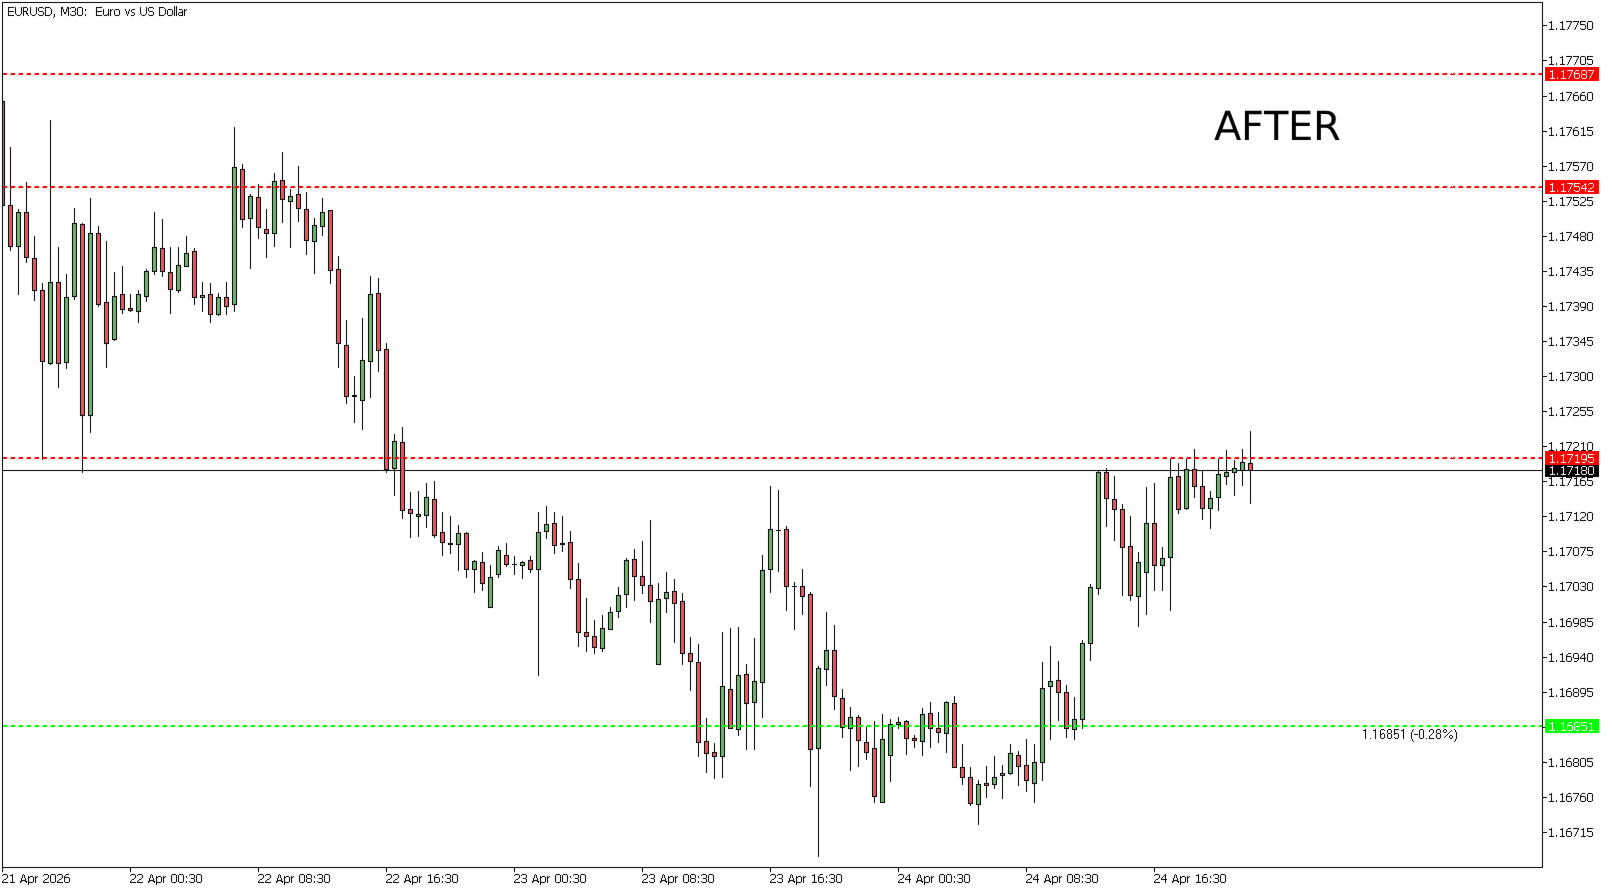
Key Level Detector is designed to automatically identify the most relevant support and resistance levels in real time, helping traders simplify their analysis and focus only on what truly matters.
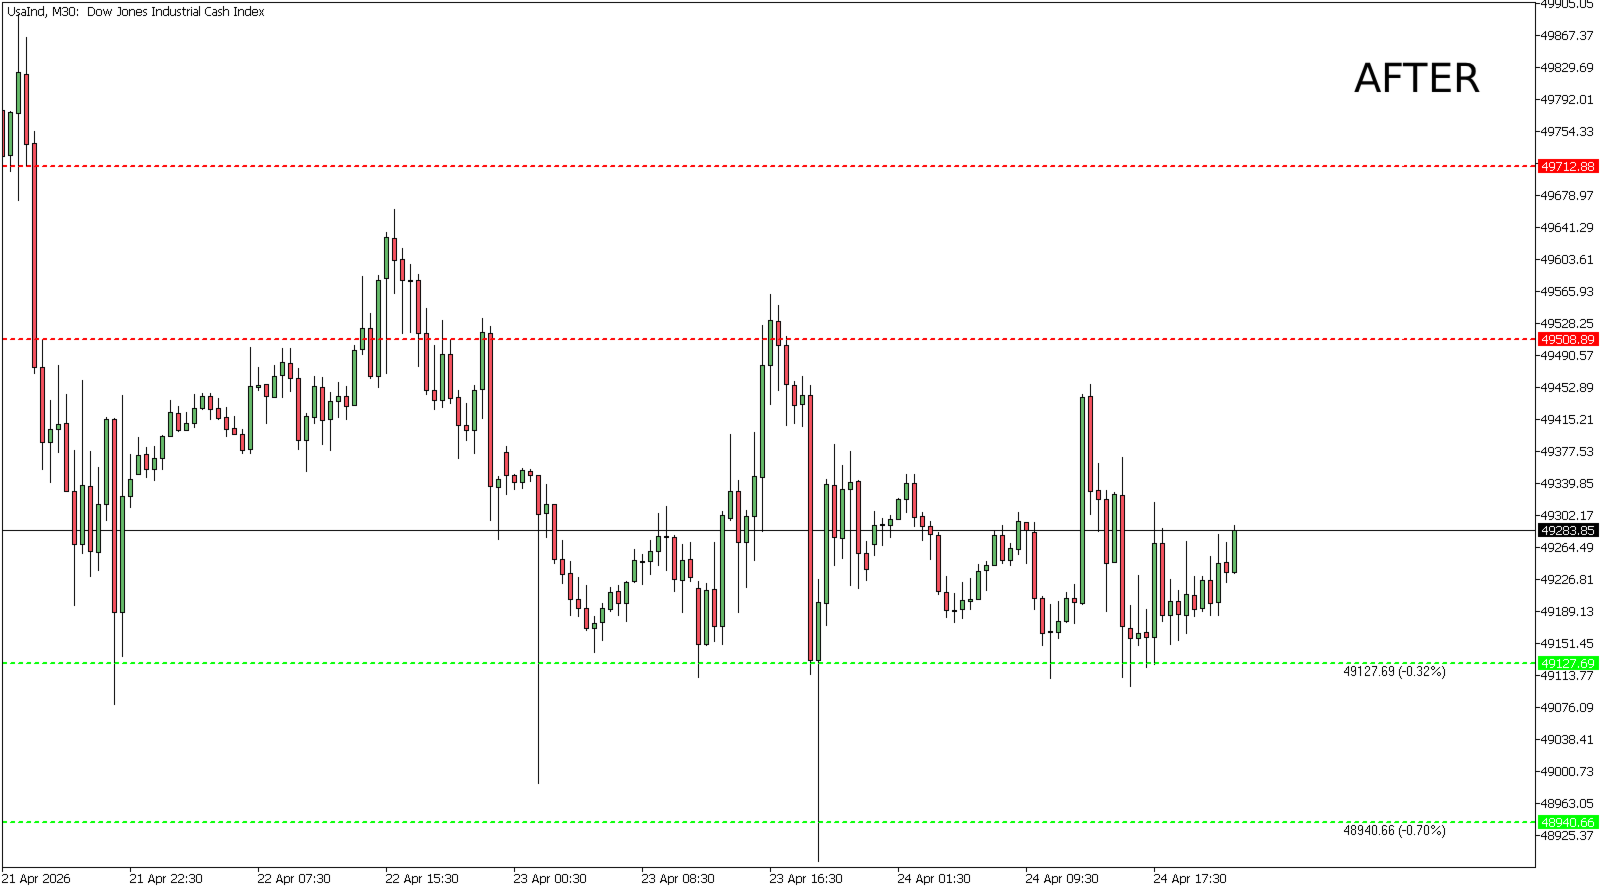
By combining market volatility and price movement analysis, the indicator highlights dynamic levels where the market has previously reacted, offering a clearer and more structured view of price action.
What it does
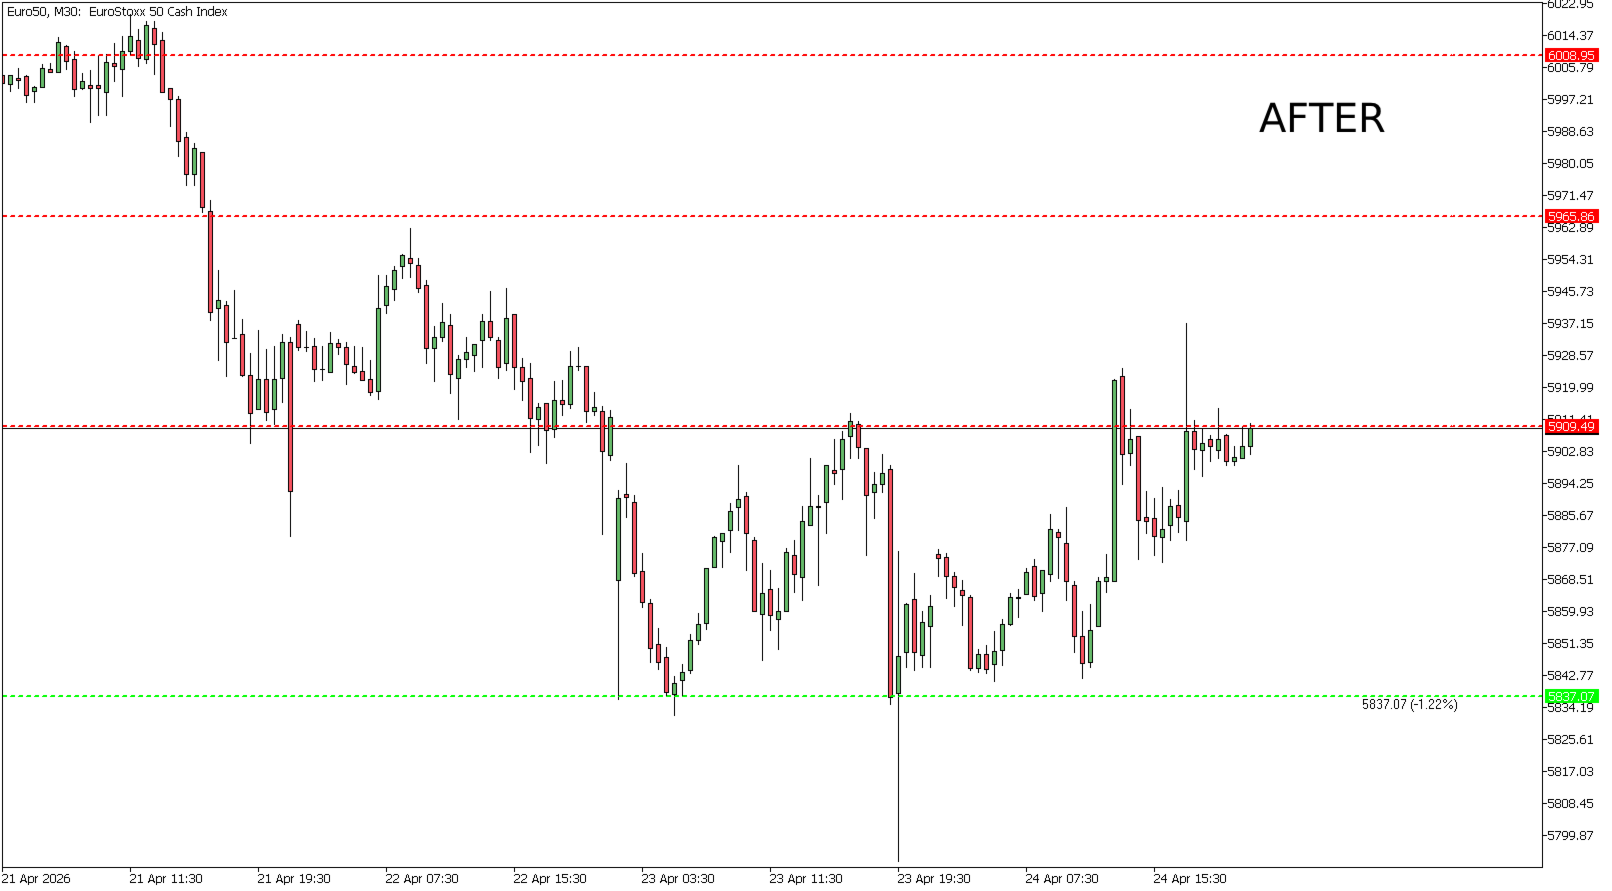
- Automatically detects key support and resistance levels
- Adapts to changing market conditions
- Filters out noise and highlights only meaningful areas
- Provides a clean and easy-to-read chart
How it works
Market Volatility Analysis
The indicator continuously evaluates market volatility to adjust levels dynamically, keeping them relevant in all conditions.
Price Movement Analysis
It identifies areas where price has reacted significantly, focusing on real market behavior.
Dynamic Calculation Engine
Levels are constantly updated based on evolving price action, keeping your analysis aligned with the current market.
Key Benefits
- Cleaner charts with less noise
- Faster and more confident decision-making
- No need for manual drawing
- Always up-to-date levels
- Clearer market structure
- Full customization: levels can be styled with different colors and visual styles to match your setup
Easy to Use
- Load the indicator
- Apply it to your chart
- Key levels appear instantly
No complex setup. No technical skills required.
Perfect for
- Intraday traders
- Scalpers
- Discretionary traders
- Anyone looking to improve market structure analysis
Important Note
This indicator does not replace your analysis.
It is designed to enhance it, speed it up, and help validate your trading ideas.
Custom Settings
Sensitivity (10 | 4–30)
Controls how many levels are detected.
Low = more signals • High = only strong levels
Price Source (High/Low)
- High/Low = standard
- Close/Open = smoother in volatile markets
History Analyzed (20 | 5–100)
How much past data is used.
Higher = more accurate
Zone Width (%) (10)
How wide the zones are.
Low = precise • High = wider areas
Levels Displayed (5 | 1–10)
Number of zones on the chart.
Less = cleaner chart
Minimum Confirmations (2 | 1–10)
How many times price must react to a level.
Higher = stronger zones only
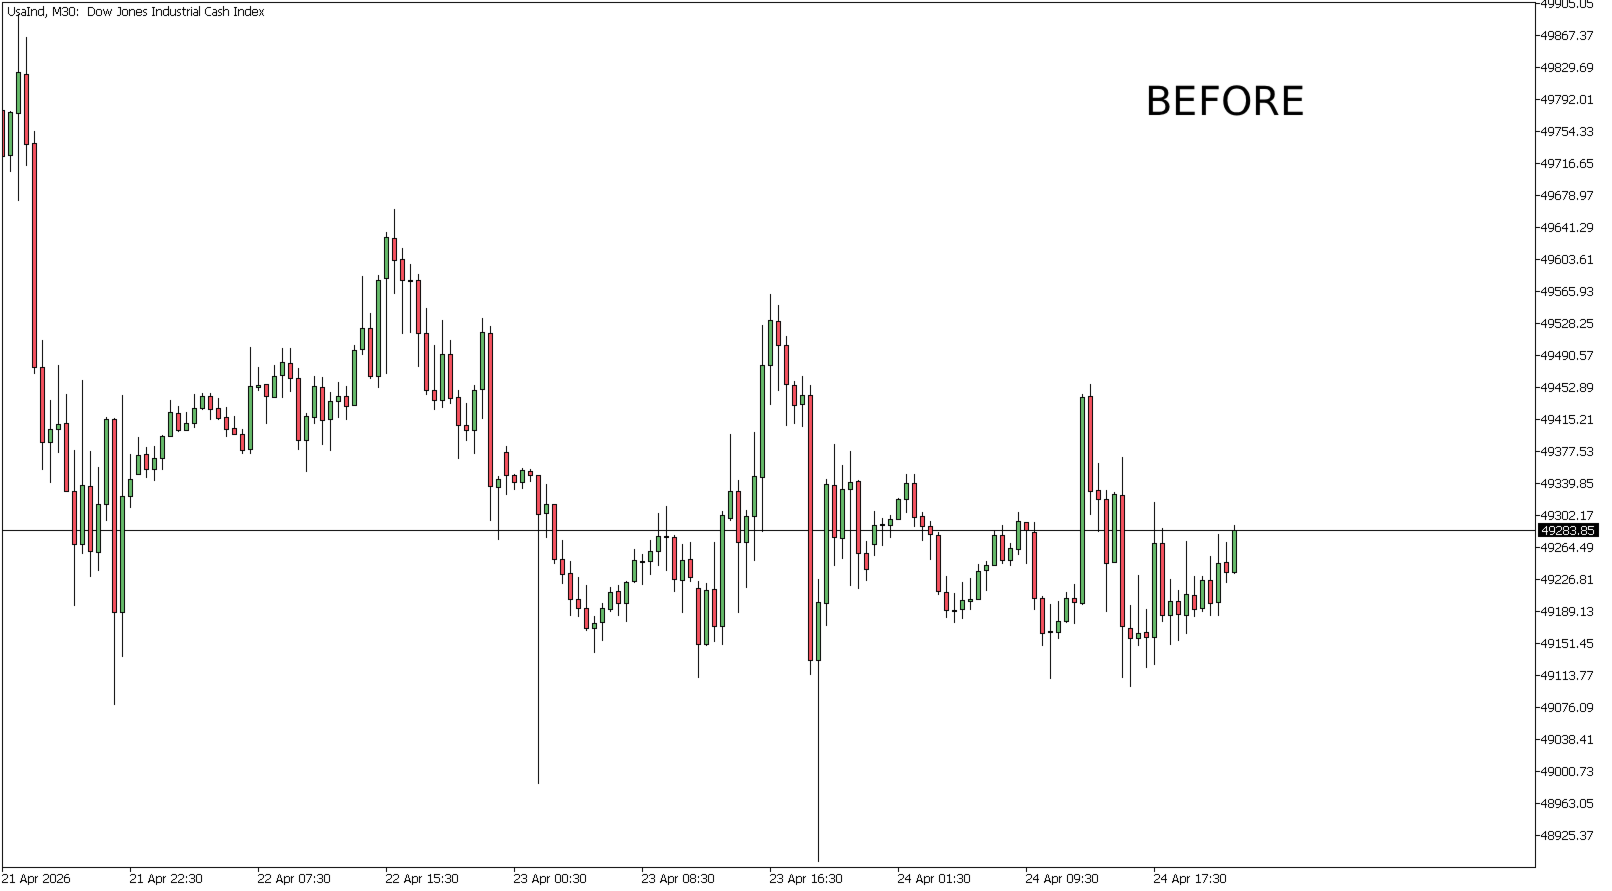
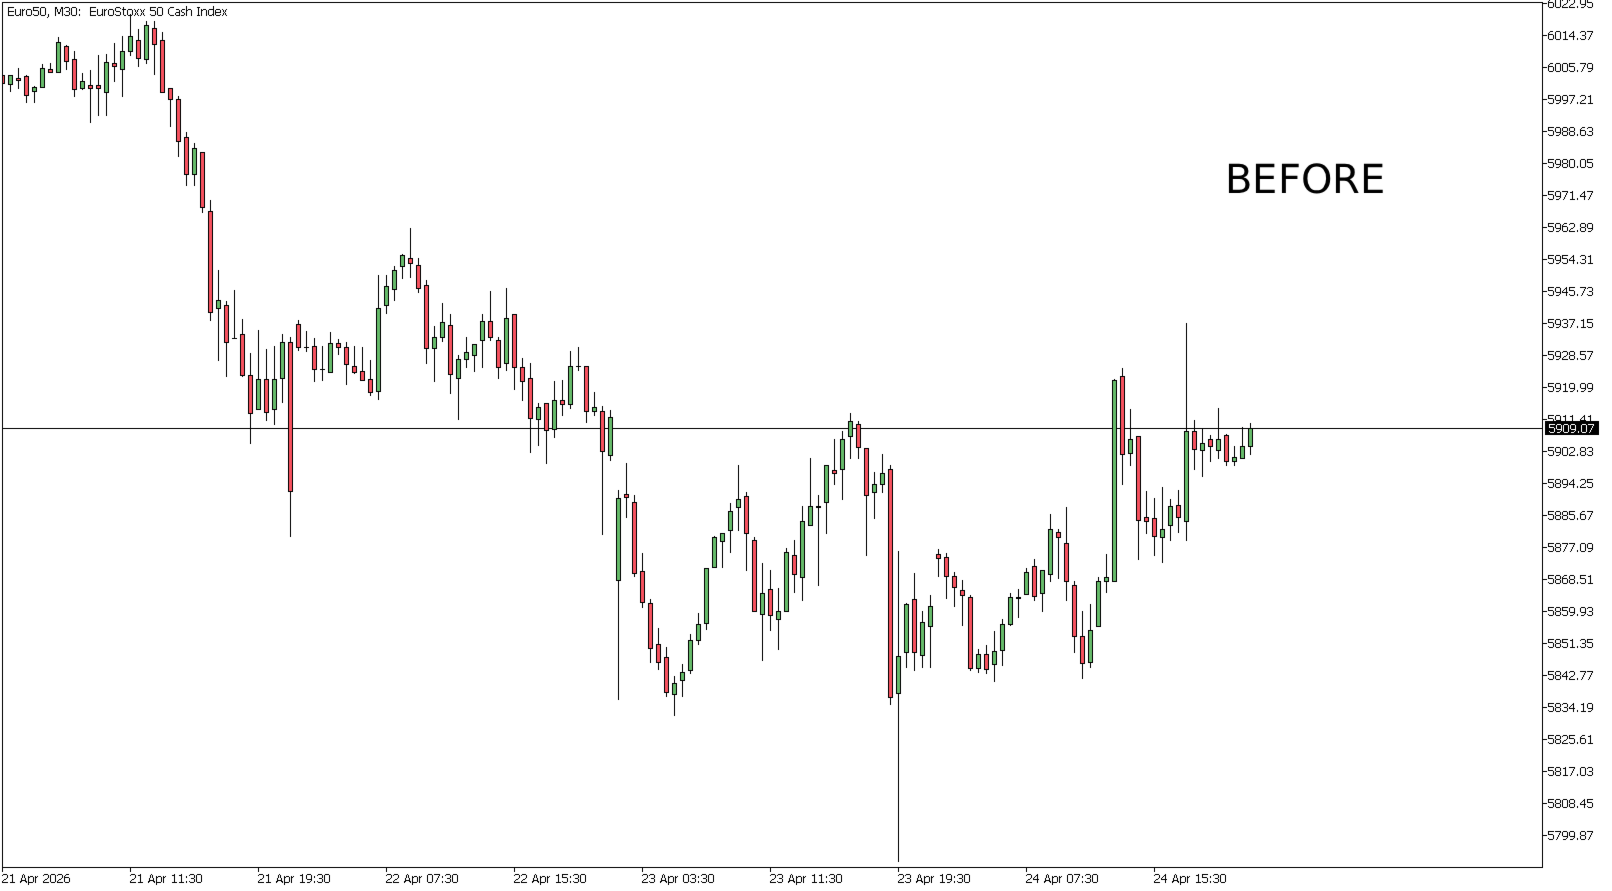
Supported Markets
Works seamlessly on:
- Forex
- Indices
- Commodities
- Cryptocurrencies
- Stocks
Support
Support is included for both indicator usage and installation issues, so you can get started and always have assistance when needed.