Key Level Detector
- Indicatori
-
Ludovico Reale
 Trader and educator since 2012, with over 500 publications and years of teaching experience. I help beginner traders and active market participants develop a structured approach based on method, discipline, and realistic expectations—no promises of easy profits—through my services and trading
 - Versione: 1.0
- Attivazioni: 5
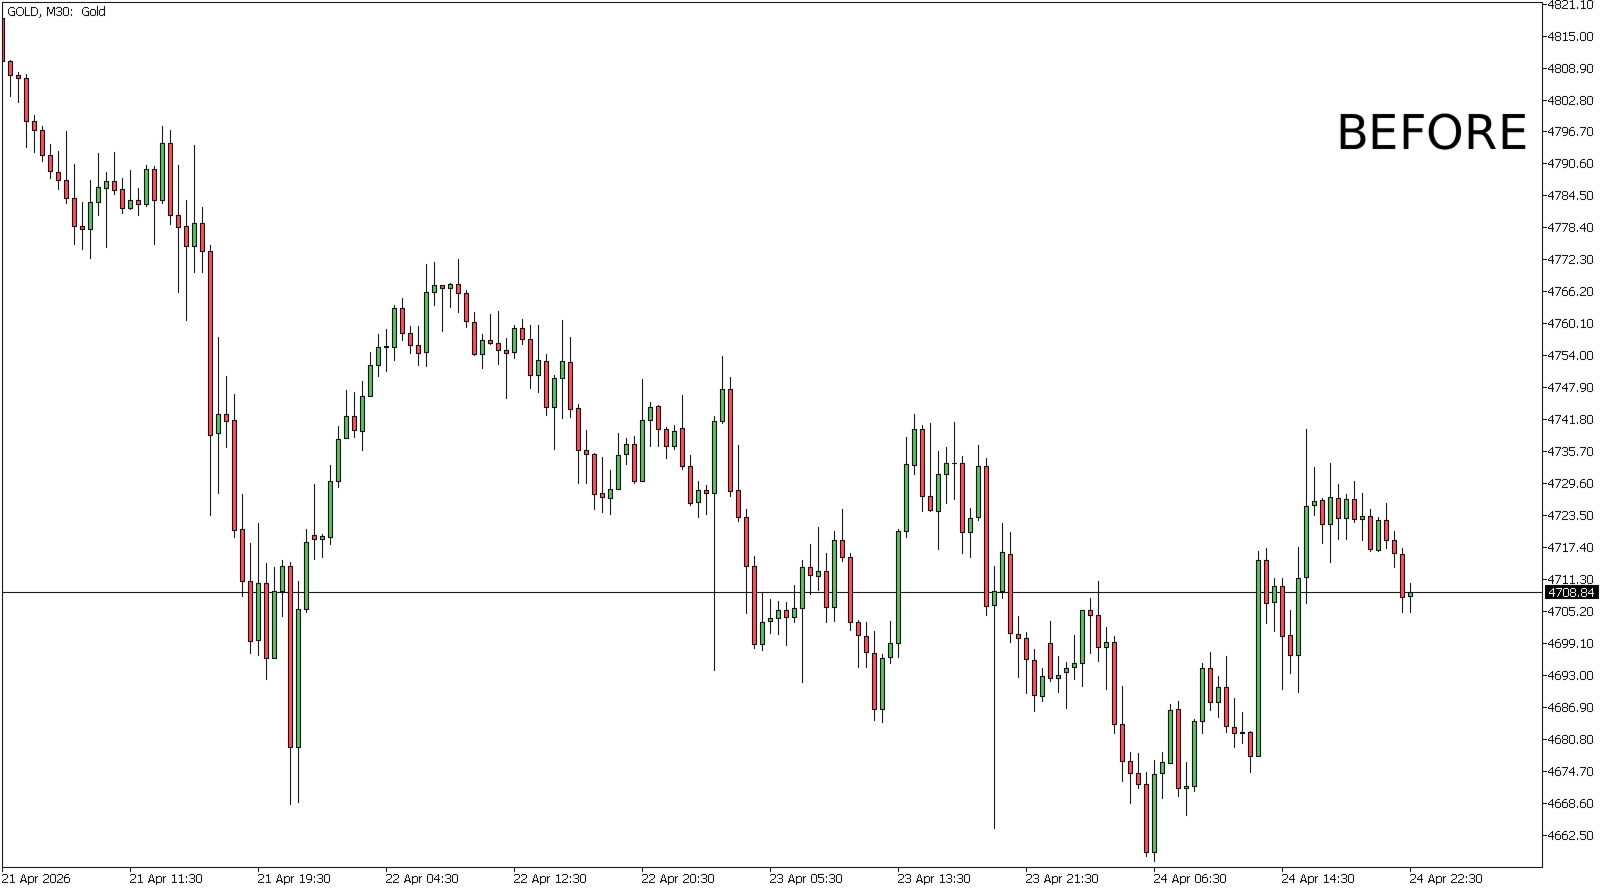
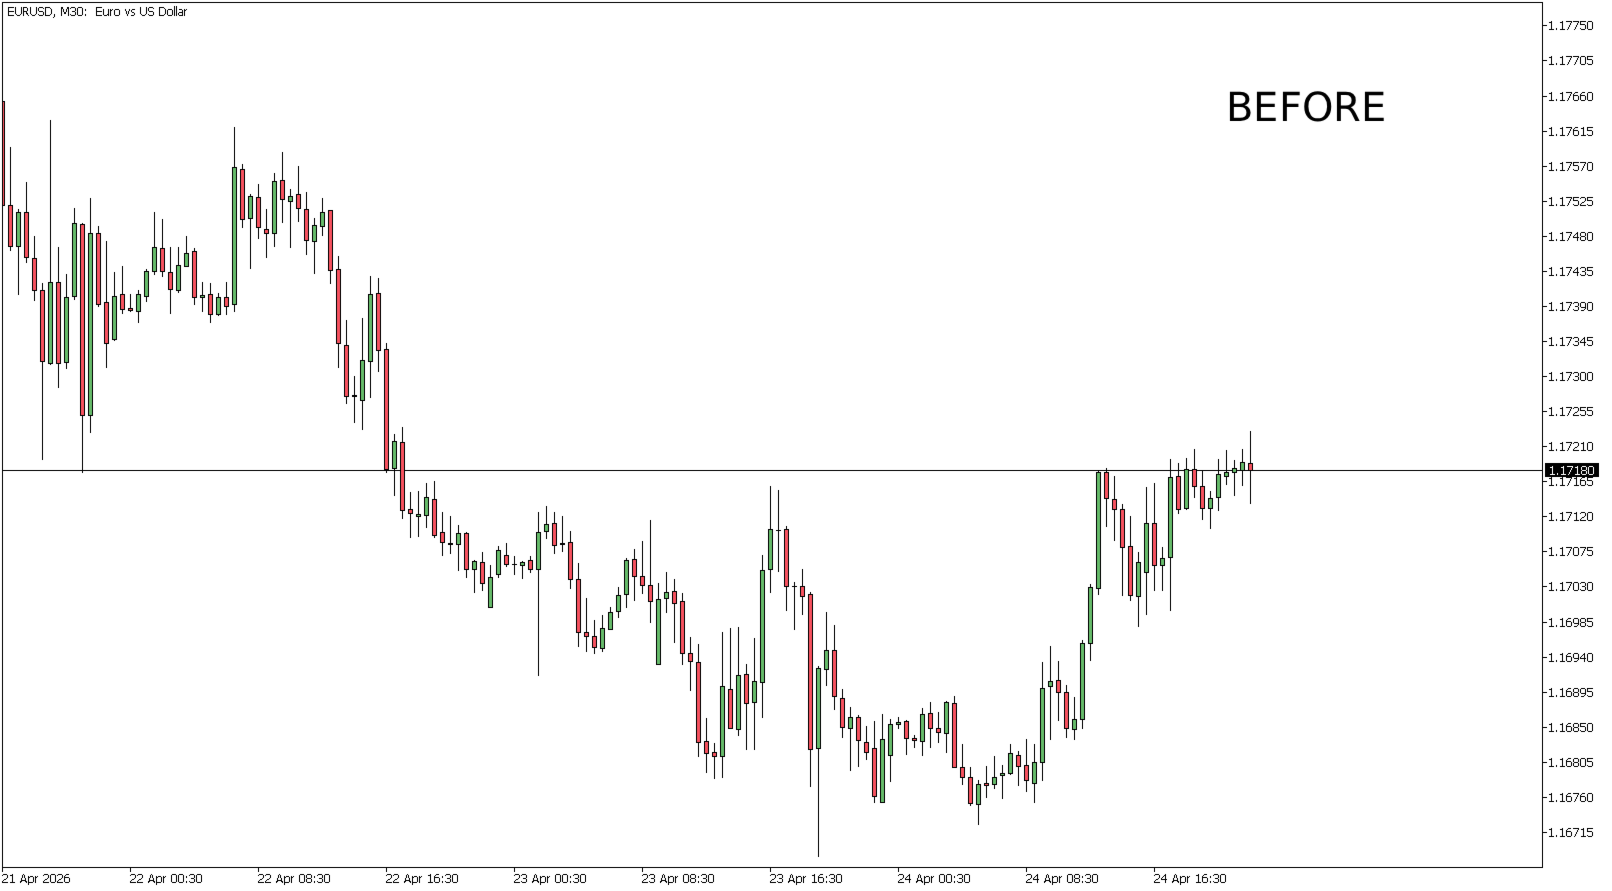
Key Level Detector
Indicatore avanzato per l’analisi precisa dei livelli di mercato
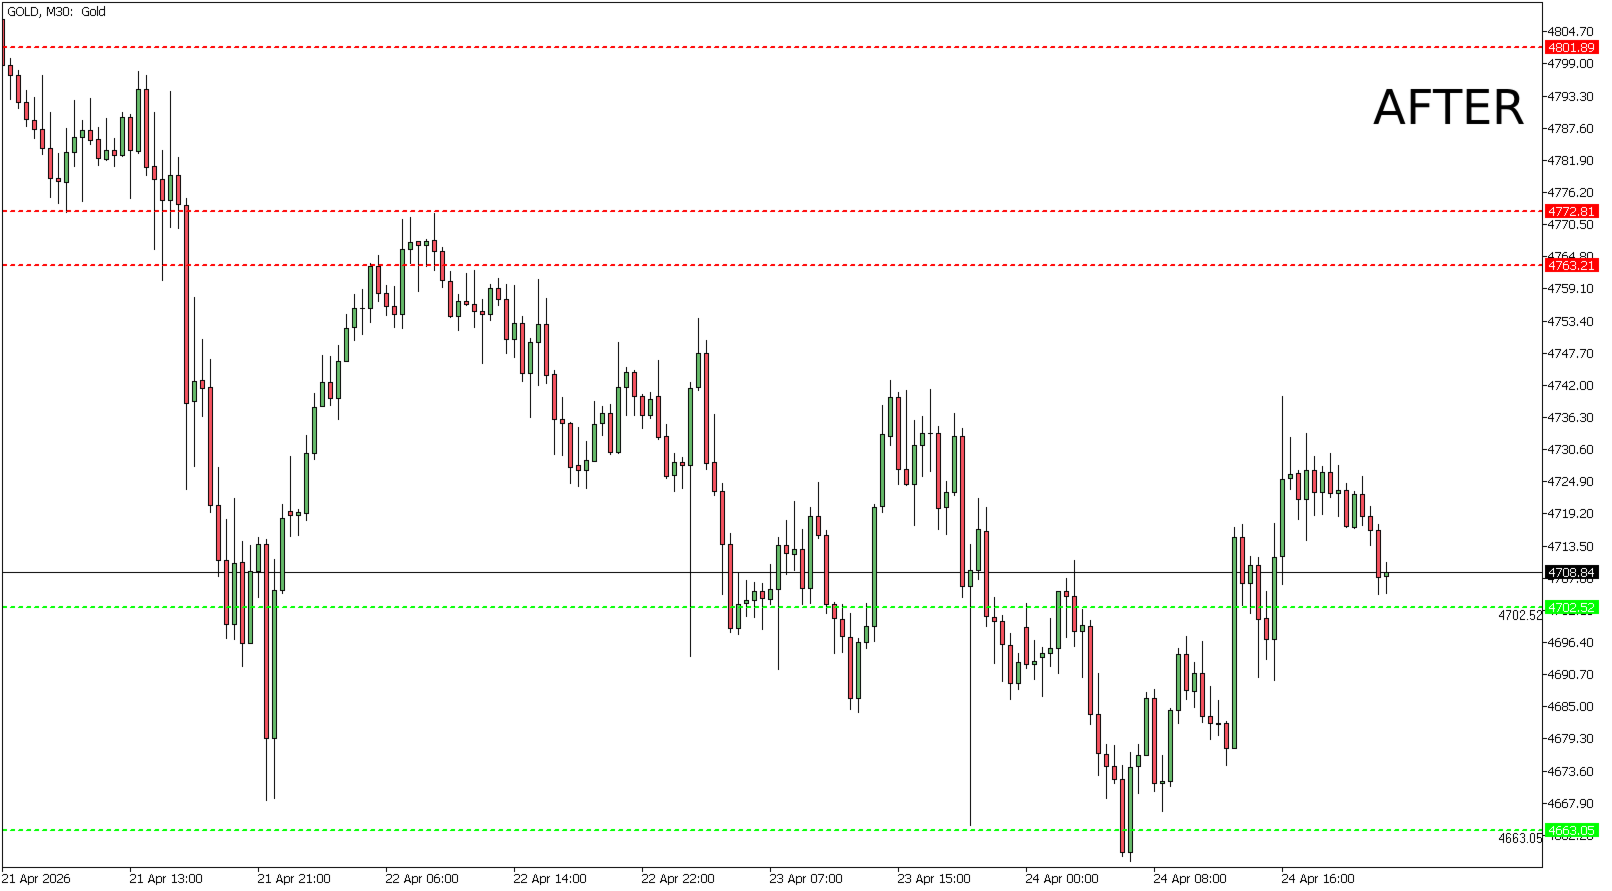
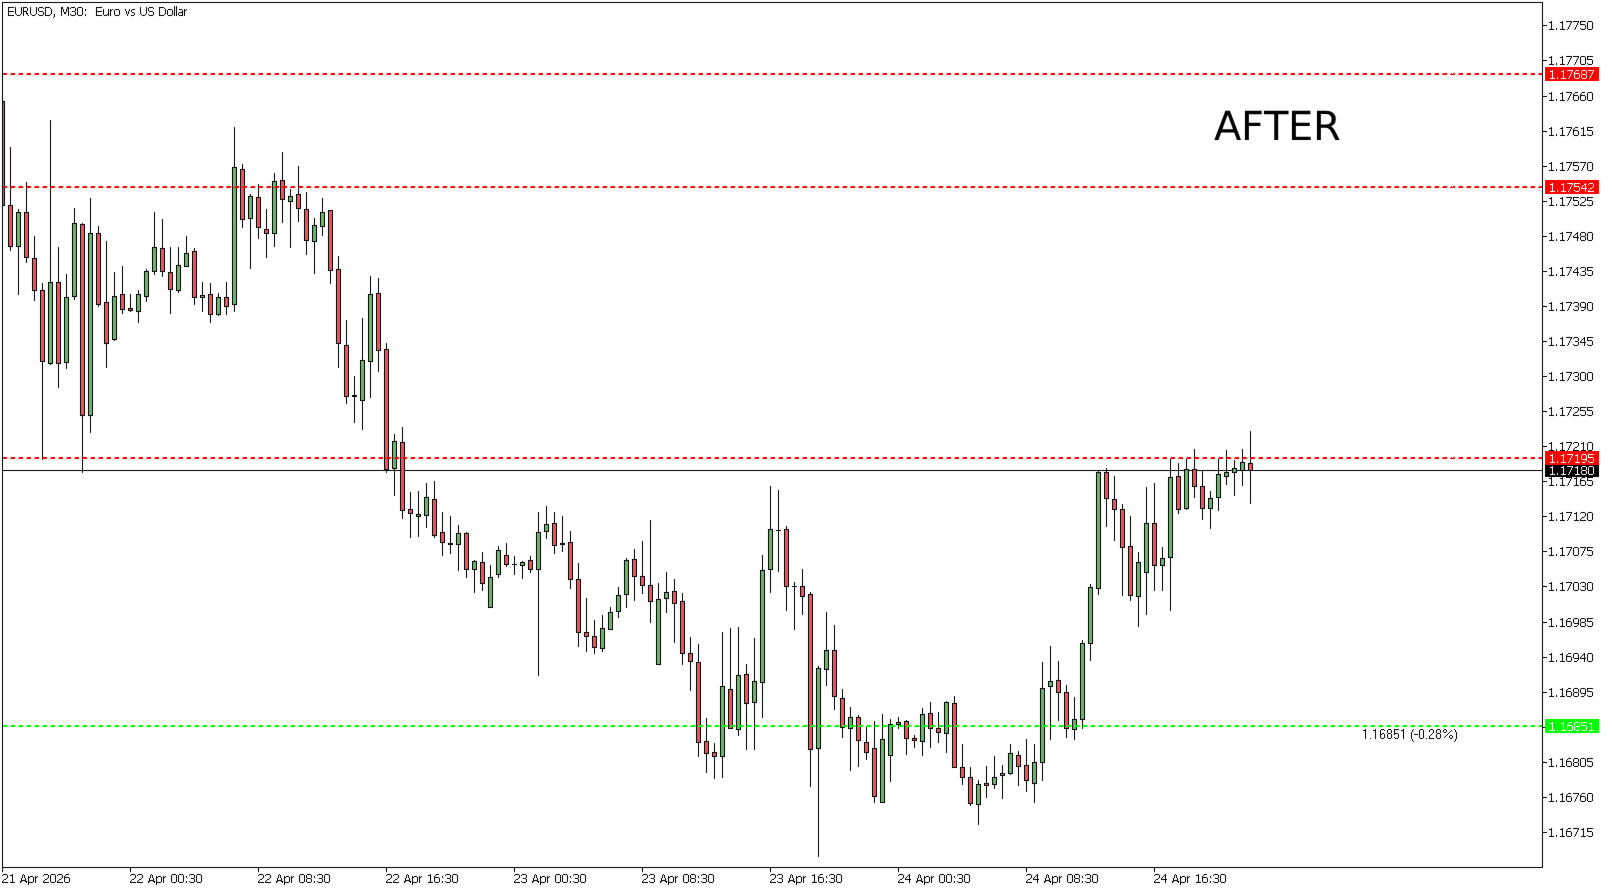
Key Level Detector è progettato per identificare automaticamente i livelli di supporto e resistenza più rilevanti in tempo reale, aiutando i trader a semplificare l’analisi e concentrarsi solo su ciò che conta davvero.
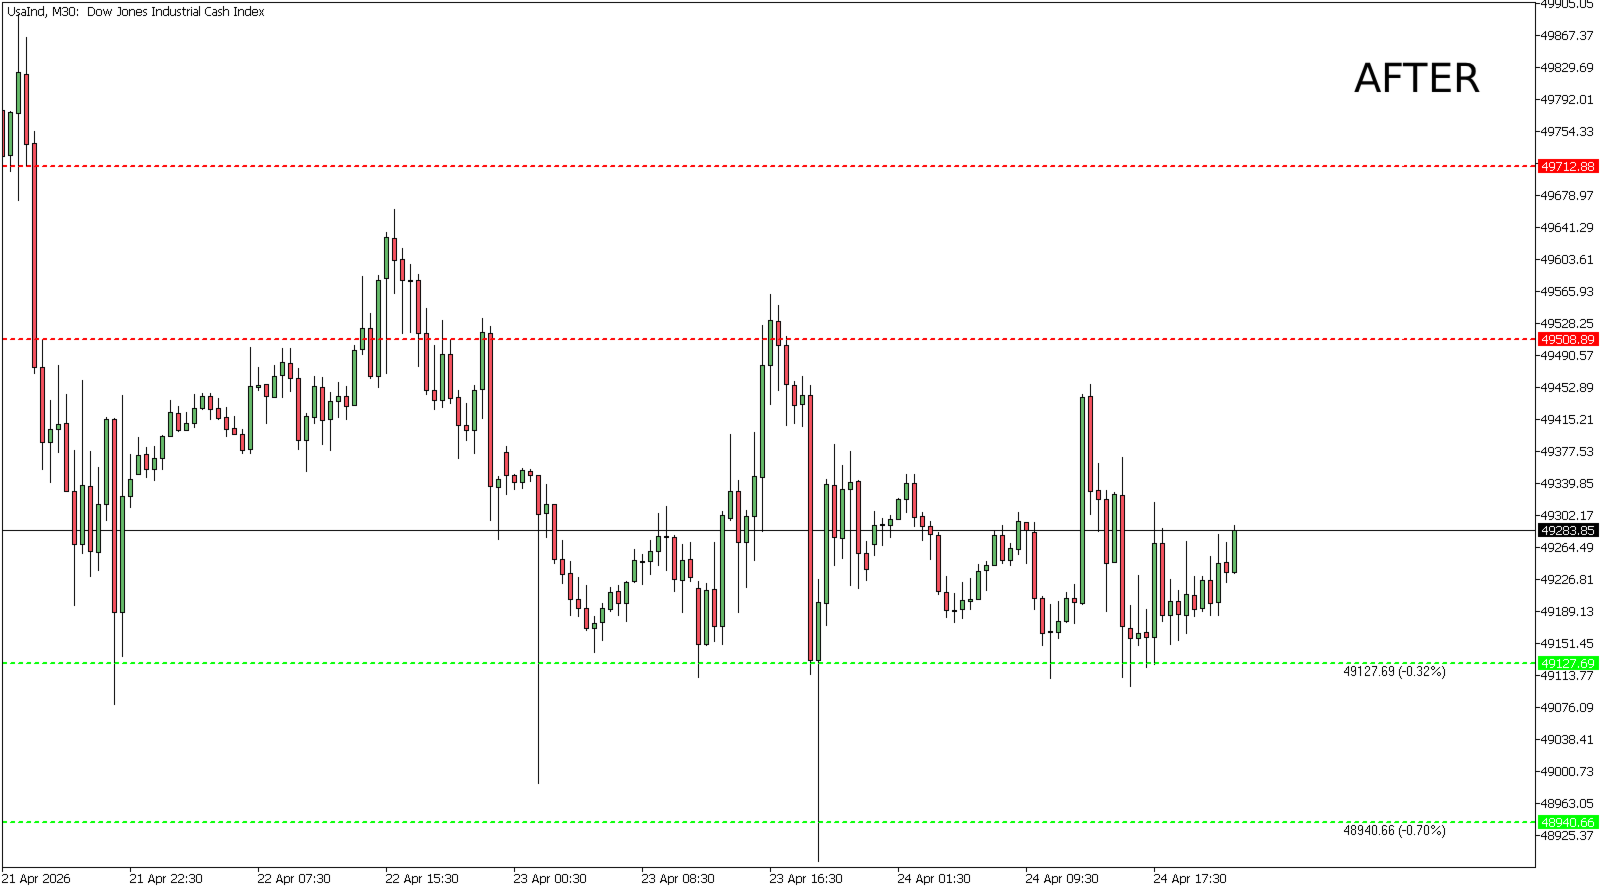
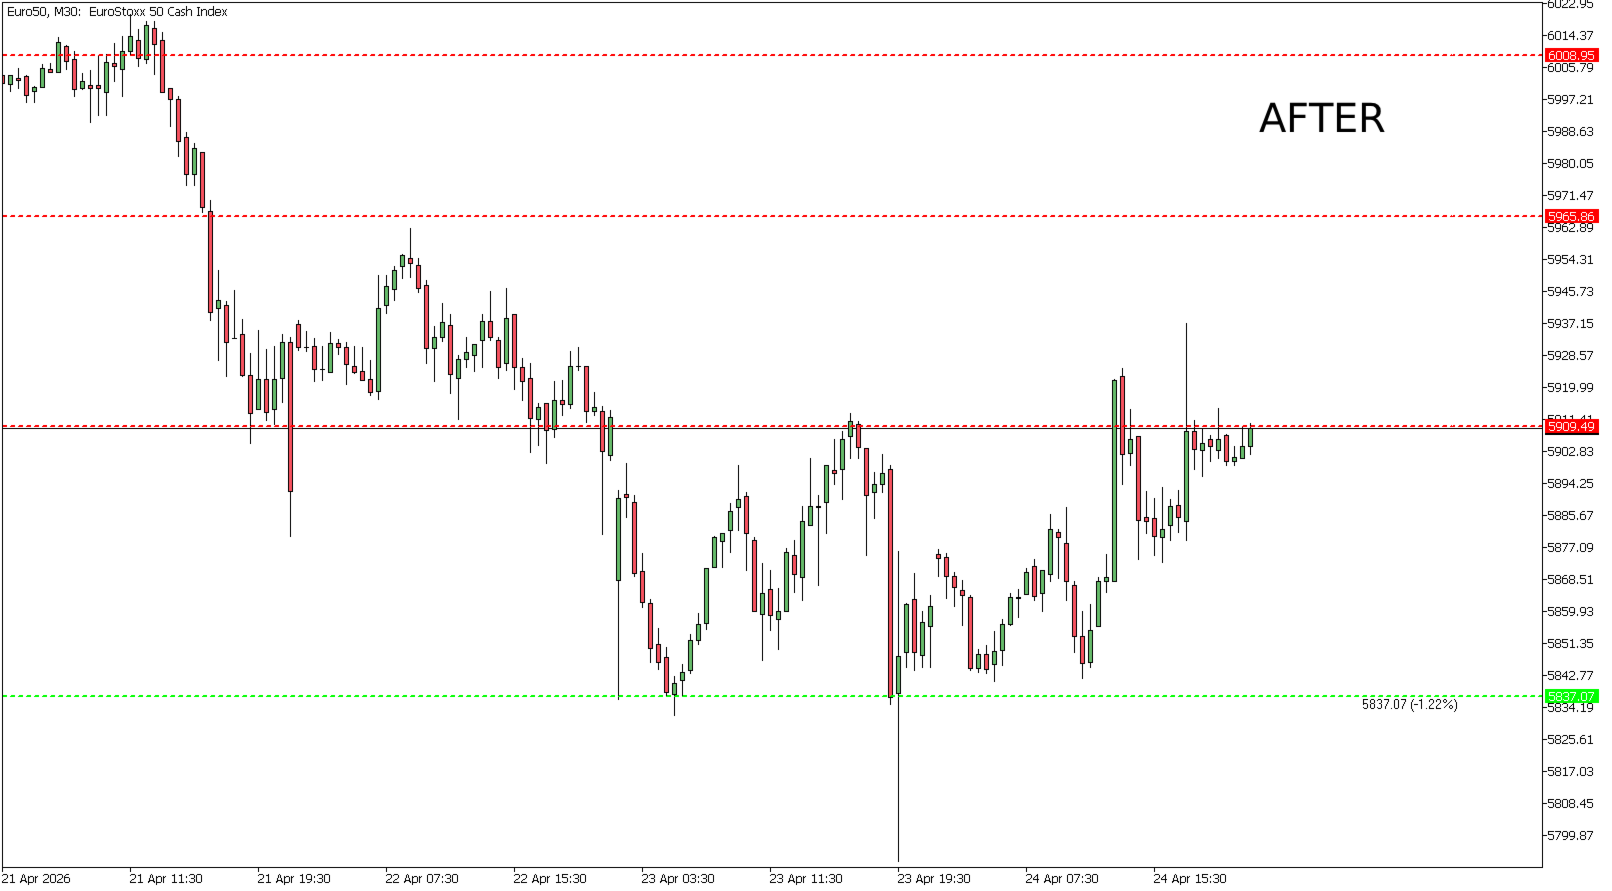
Combinando l’analisi della volatilità e del movimento dei prezzi, l’indicatore evidenzia livelli dinamici in cui il mercato ha già reagito, offrendo una visione più chiara e strutturata del prezzo.
Cosa fa
- Identifica automaticamente i principali livelli di supporto e resistenza
- Si adatta alle condizioni di mercato in continuo cambiamento
- Filtra il rumore evidenziando solo le aree più importanti
- Mantiene il grafico pulito e facilmente leggibile
Come funziona
Analisi della Volatilità
L’indicatore valuta costantemente la volatilità per adattare i livelli in modo dinamico, mantenendoli sempre rilevanti.
Analisi del Movimento del Prezzo
Individua le zone in cui il prezzo ha reagito in modo significativo, basandosi su comportamenti reali di mercato.
Motore di Calcolo Dinamico
I livelli vengono aggiornati continuamente seguendo l’evoluzione del prezzo, mantenendo l’analisi sempre allineata al contesto attuale.
Vantaggi principali
- Grafici più puliti e meno confusione
- Decisioni più rapide e sicure
- Nessun bisogno di disegnare manualmente i livelli
- Livelli sempre aggiornati
- Maggiore chiarezza nella struttura del mercato
- Personalizzazione completa: livelli modificabili in diversi stili e colori per adattarsi al tuo setup
Facile da usare
- Carica l’indicatore
- Applicalo al grafico
- I livelli compaiono automaticamente
Nessuna configurazione complessa. Nessuna competenza tecnica richiesta.
Ideale per
- Trader intraday
- Scalper
- Trader discrezionali
- Chiunque voglia migliorare l’analisi della struttura di mercato
Nota importante
Questo indicatore non sostituisce la tua analisi.
È progettato per migliorarla, velocizzarla e aiutarti a confermare le tue idee operative.
Impostazioni personalizzabili
Sensibilità (10 | 4–30)
Controlla quanti livelli vengono individuati.
Basso = più segnali • Alto = solo livelli forti
Fonte Prezzo (High/Low)
- High/Low = standard
- Close/Open = più stabile nei mercati volatili
Storico Analizzato (20 | 5–100)
Quanti dati passati vengono utilizzati.
Più alto = maggiore precisione
Ampiezza Zona (%) (10)
Quanto sono larghe le zone.
Basso = più precise • Alto = più ampie
Livelli Mostrati (5 | 1–10)
Numero di zone sul grafico.
Meno livelli = grafico più pulito
Conferme Minime (2 | 1–10)
Quante volte il prezzo deve toccare un livello.
Più alto = solo livelli più forti
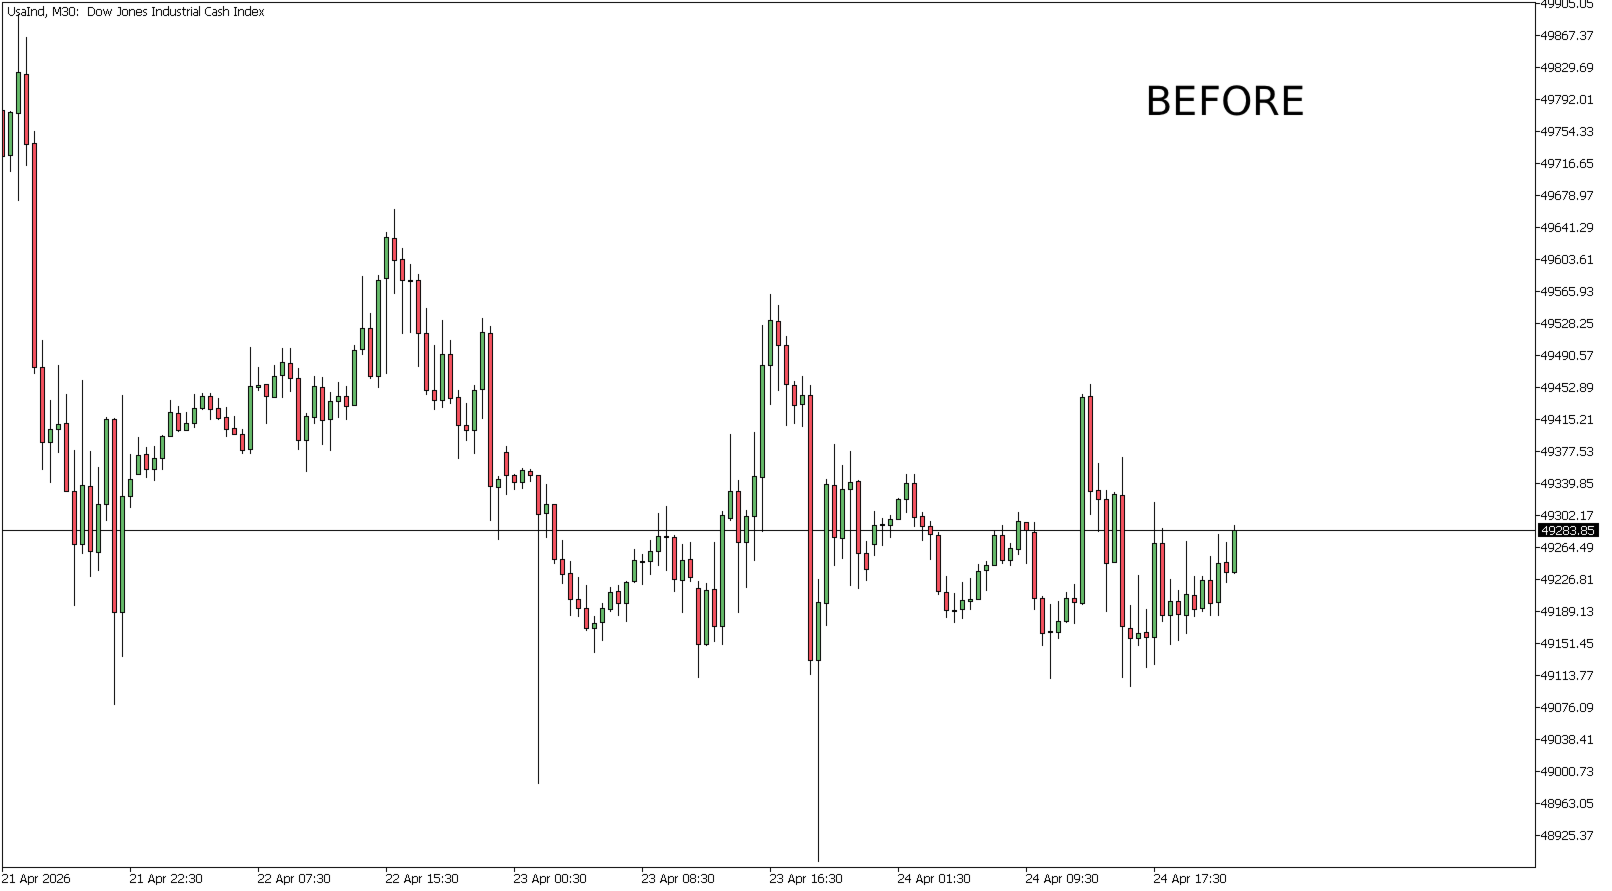
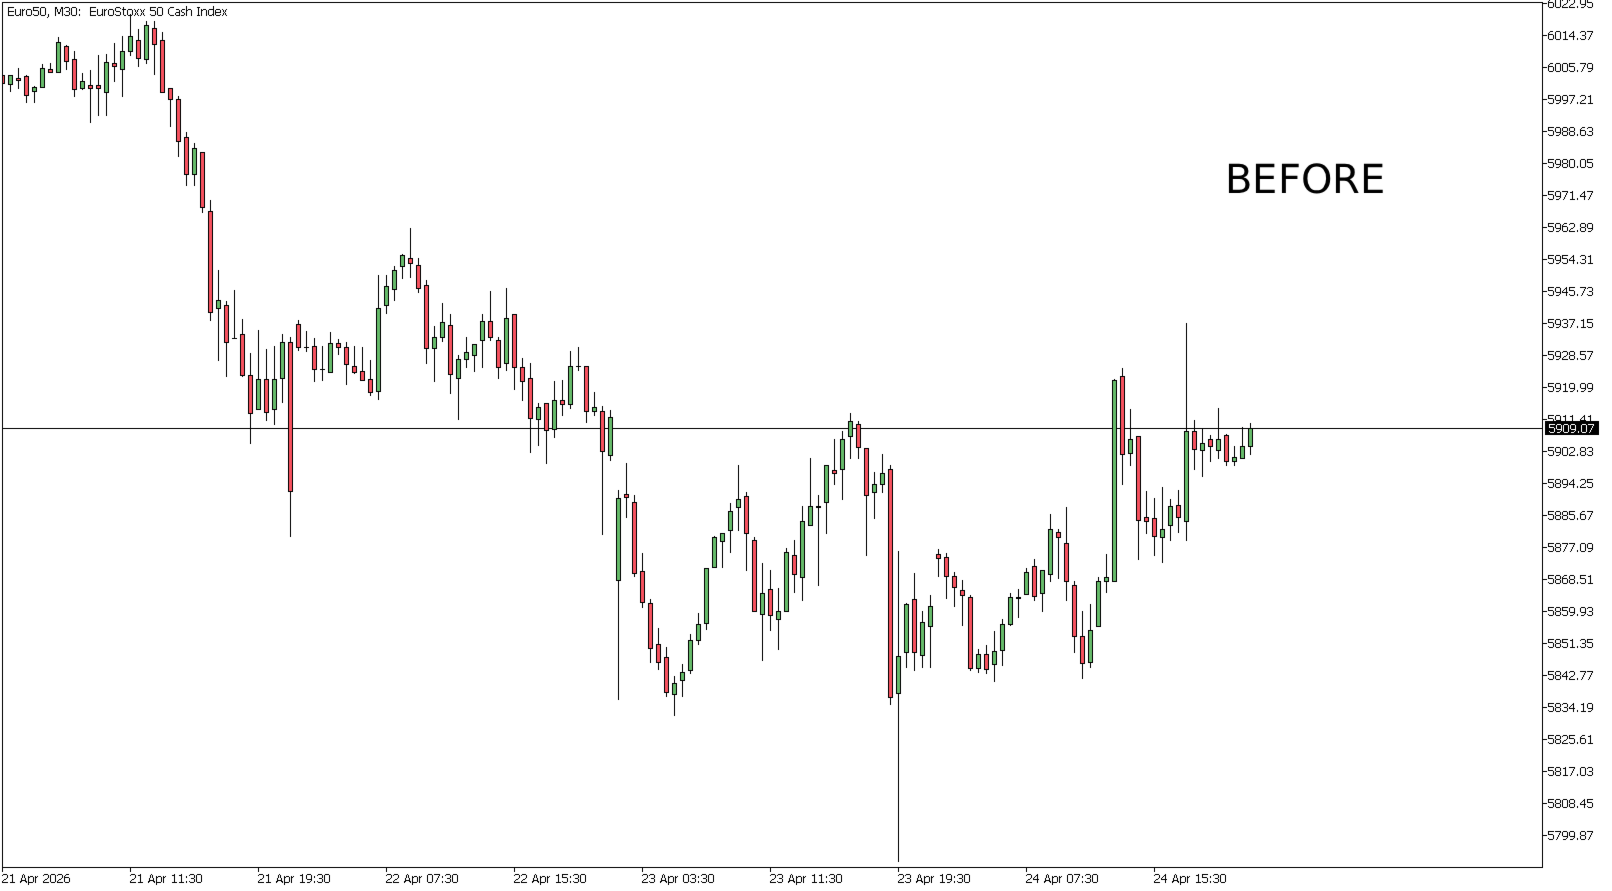
Mercati supportati
Funziona perfettamente su:
- Forex
- Indici
- Materie prime
- Criptovalute
- Azioni
Supporto
È incluso il supporto per l’utilizzo dell’indicatore e per eventuali problemi di installazione, così potrai iniziare senza difficoltà e avere sempre assistenza quando necessario.