Pyjama Chart
- 지표
- 버전: 1.16
- 업데이트됨: 17 3월 2026

Pyjama Chart (beta) is a comprehensive technical analysis toolkit for MetaTrader 5, designed to automatically map key historical price structures and key zones on your chart.
This professional utility automates the manual charting process for several advanced price-action concepts. It dynamically detects and renders structure points, trend continuation markers, supply/demand imbalances, volatility-based zones, and areas of potential liquidity, providing a complete structural blueprint of the market at a glance.
The core visual engine is designed with memory efficiency, strict garbage collection, and optimized object management. You have full control over the number of active objects rendered on the chart (Max counts) and complete visual customization for every label, zone color, and line style included.
What's Included:
The Pyjama Chart engine includes the following features, which can be individually toggled on or off in the inputs:
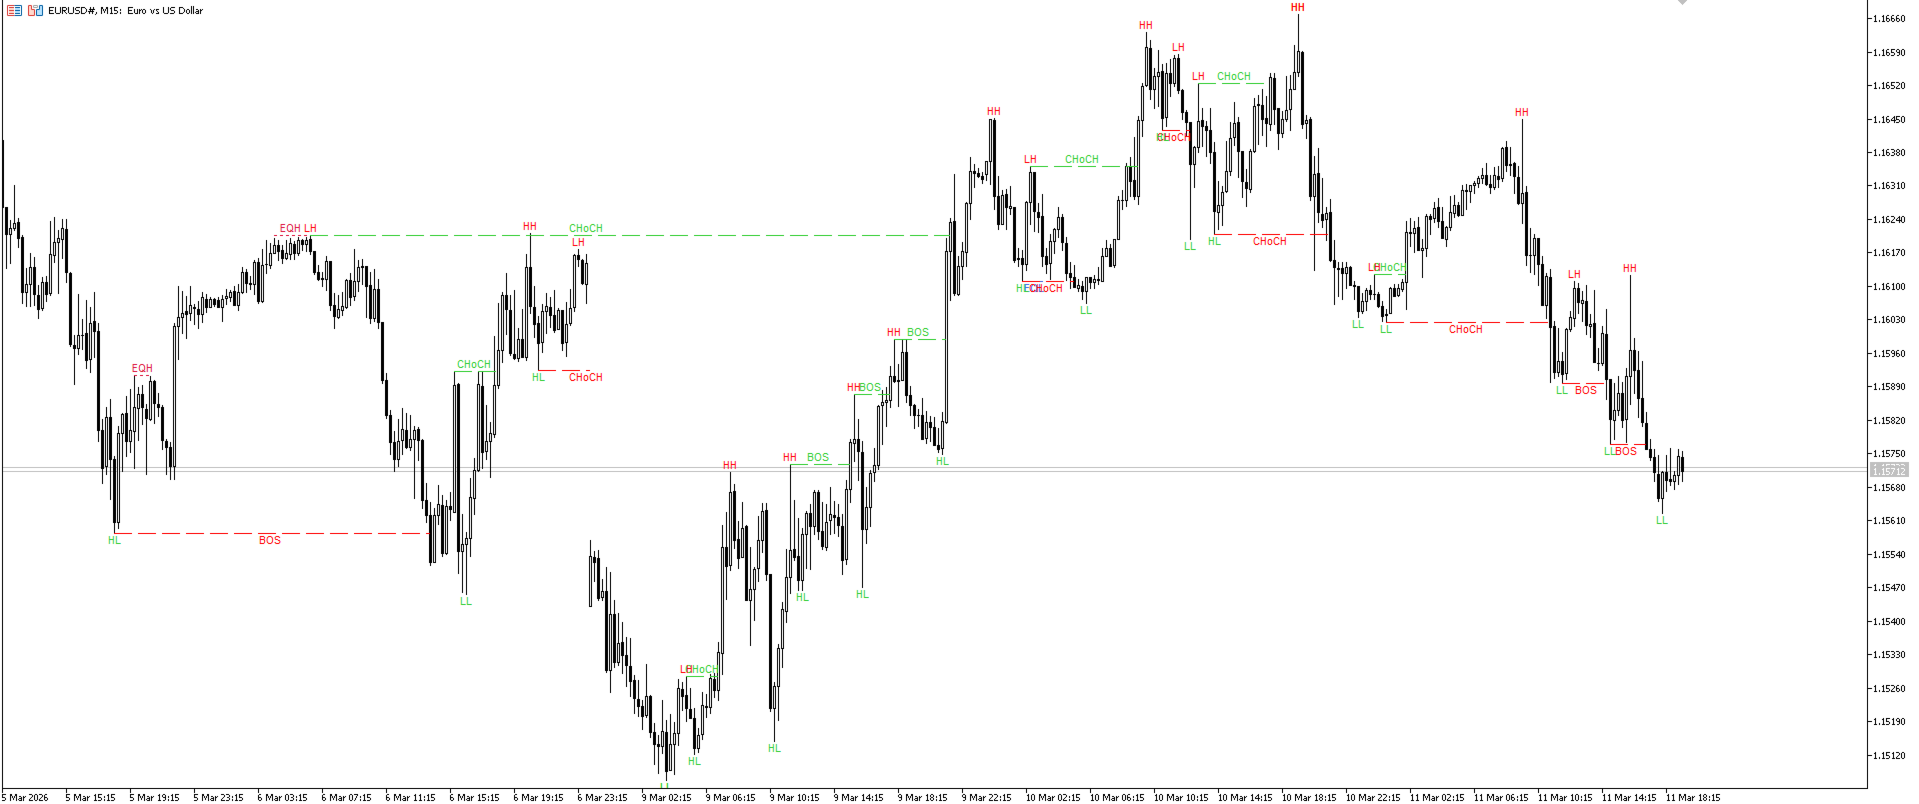
1. Dynamic Market Structure Mapping (Labels & Origin Lines)
-
Included Visuals: Automatic detection and labeling of macro (Swing) and micro (Internal) market structure points, including:
-
HH (Higher Highs)
-
LL (Lower Lows)
-
LH (Lower Highs)
-
HL (Higher Lows)
-
-
Included Trend Markers: Renders Break of Structure (BOS) and Change of Character (CHoCH) tags, which indicate market trend continuations and reversals.
-
Included Dashed Lines: Draws horizontal dashed lines connecting the original structure high/low pivot point to the exact candle that caused the break.
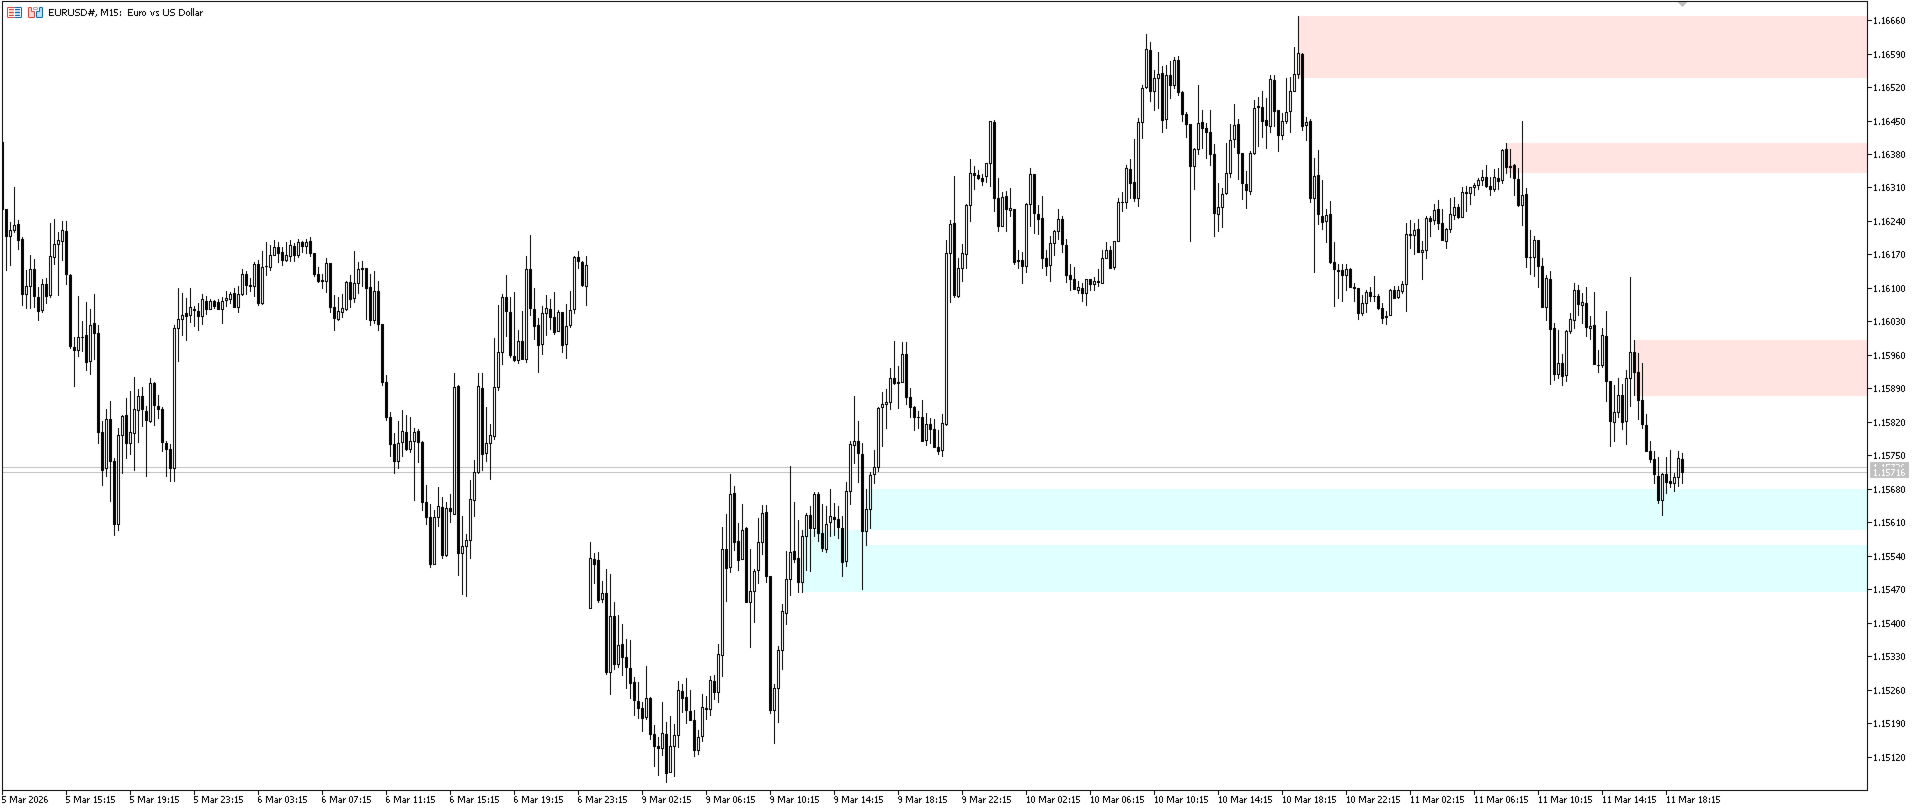
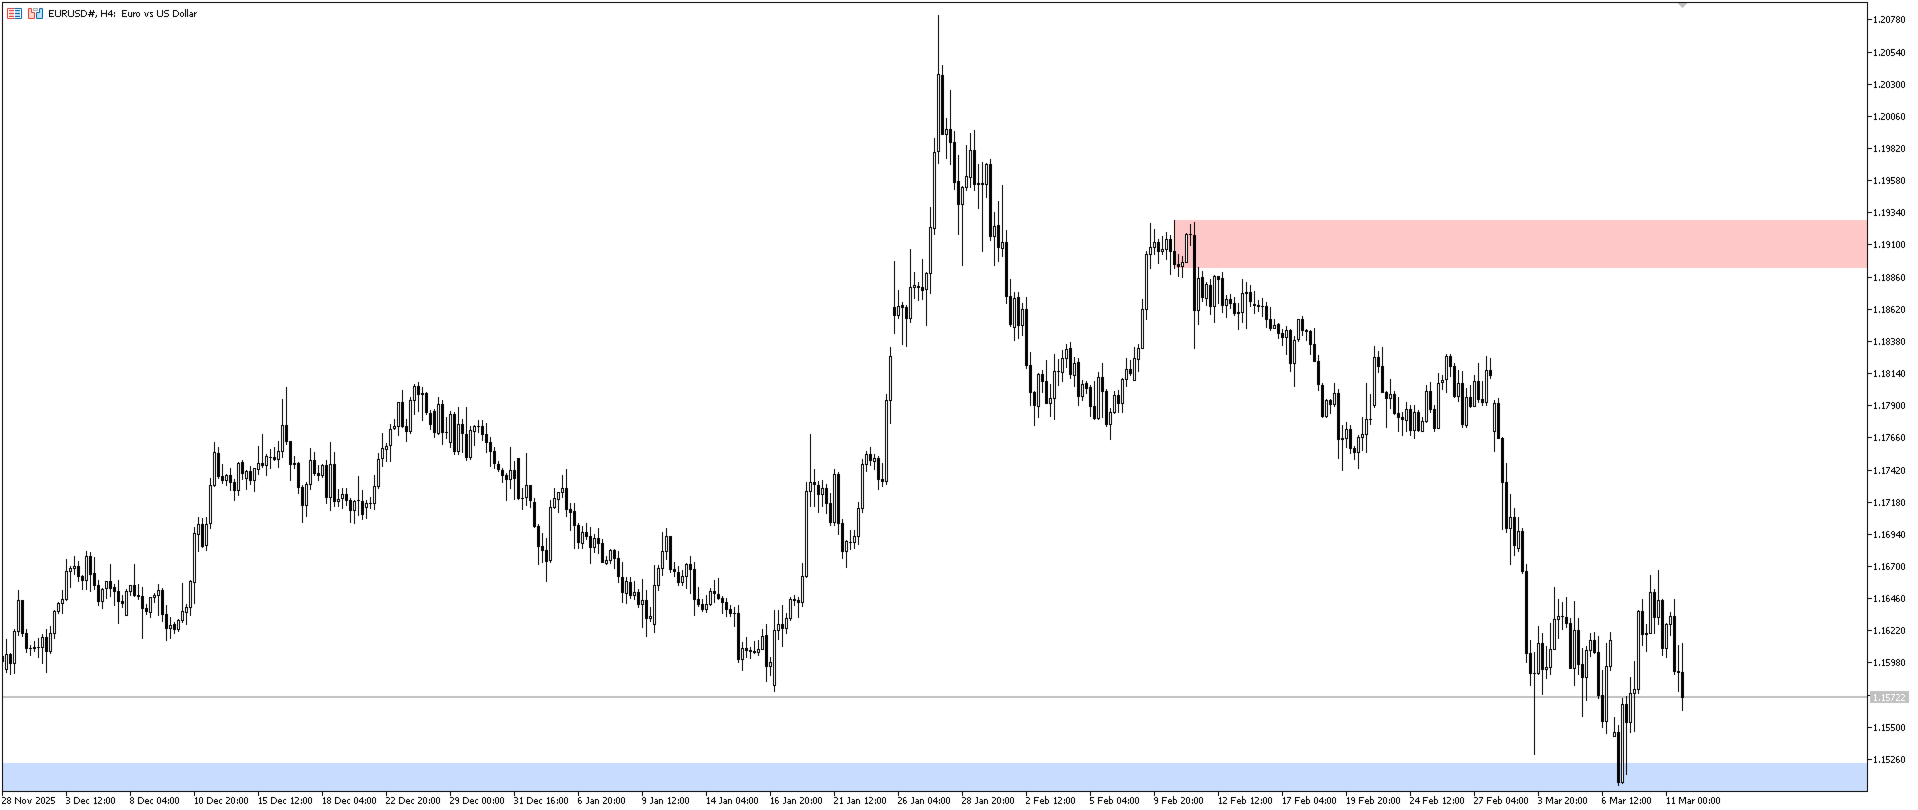
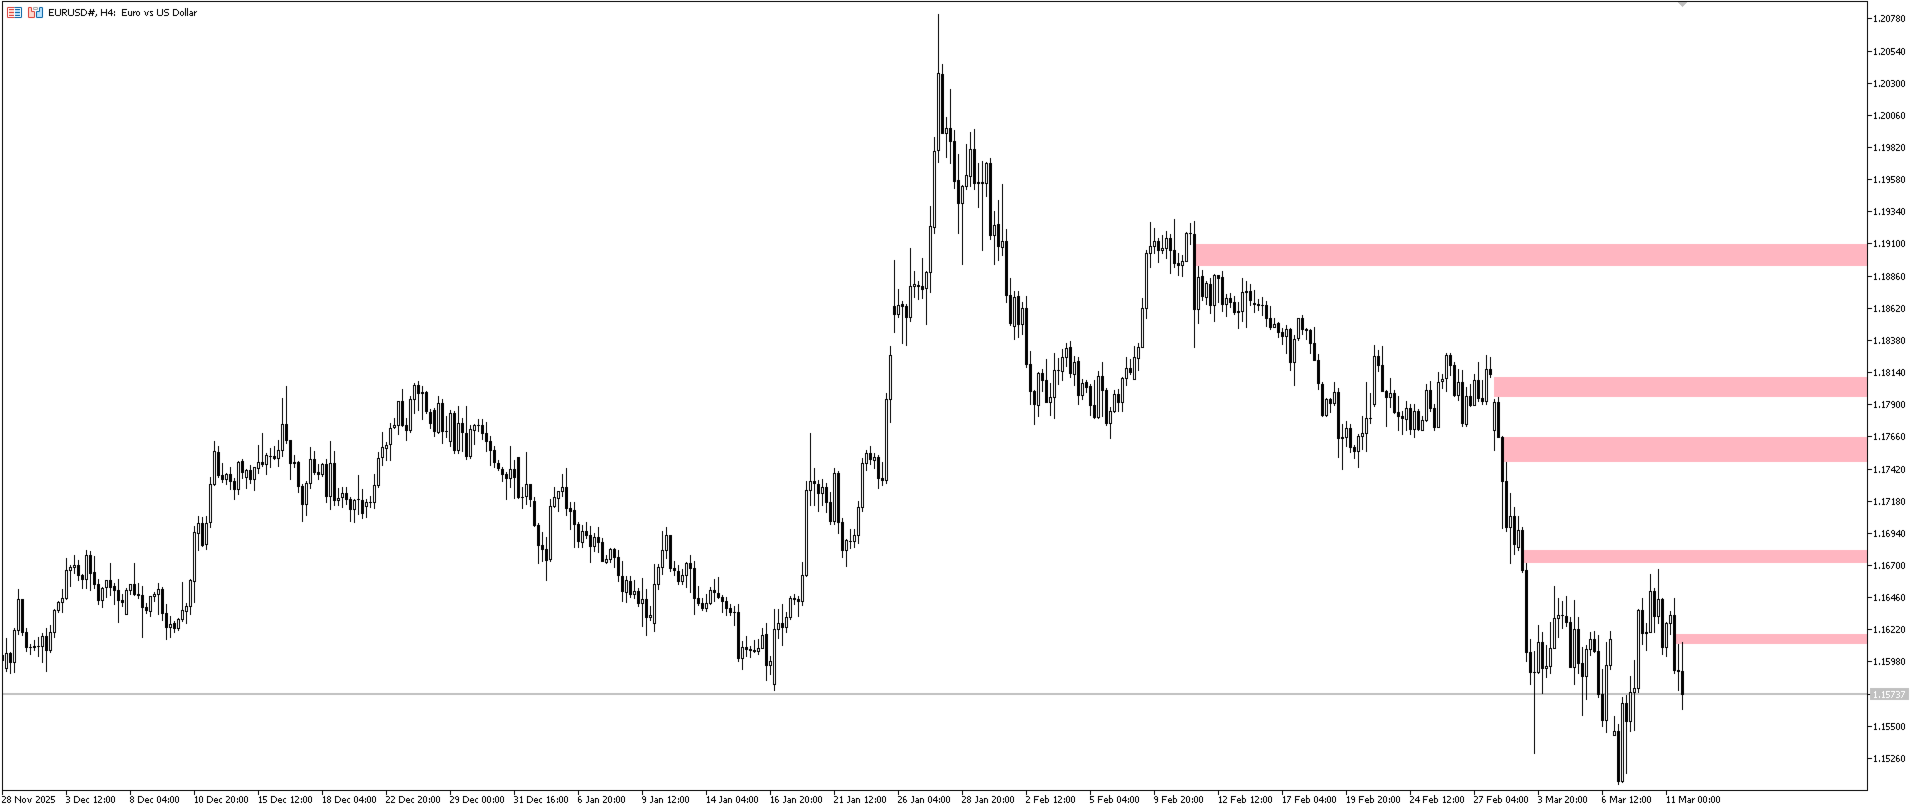
2. Supply & Demand Imbalance Boxes (Order Blocks)
-
Included Visuals: Automatic rendering of horizontal striped rectangle boxes for:
-
Internal Order Blocks
-
Swing Order Blocks
-
-
Included Mitigation Logic: These boxes persist until "mitigated" (filled or breached) by the price based on your chosen setting (body close or wick touch).
3. Price Gap Imbalances (Fair Value Gaps - FVG)
-
Included Visuals: Automatic detection of dynamic price imbalances using three-candle sequences, rendered as clean rectangle zones. Like Order Blocks, FVGs persist until they are completely filled or "mitigated" by price action.
4. Liquidity Pool Detection (EQH / EQL)
-
Included Visuals: Automatic detection of Equal Highs (EQH) or Equal Lows (EQL). These areas of potential liquidity are highlighted with dotted lines and "EQH"/"EQL" labels.
-
Included Parameters: Detection is based on a customizable lookback period and an ATR-based proximity threshold, ensuring the utility adapts to different volatilities across timeframes.
5. Volatility-Adjusted Filters
-
Included Calculation: The indicator features a built-in filter to qualify Order Blocks and other structures. You can choose between:
-
200-period ATR (Average True Range)
-
CMR (Cumulative Mean Range)
-
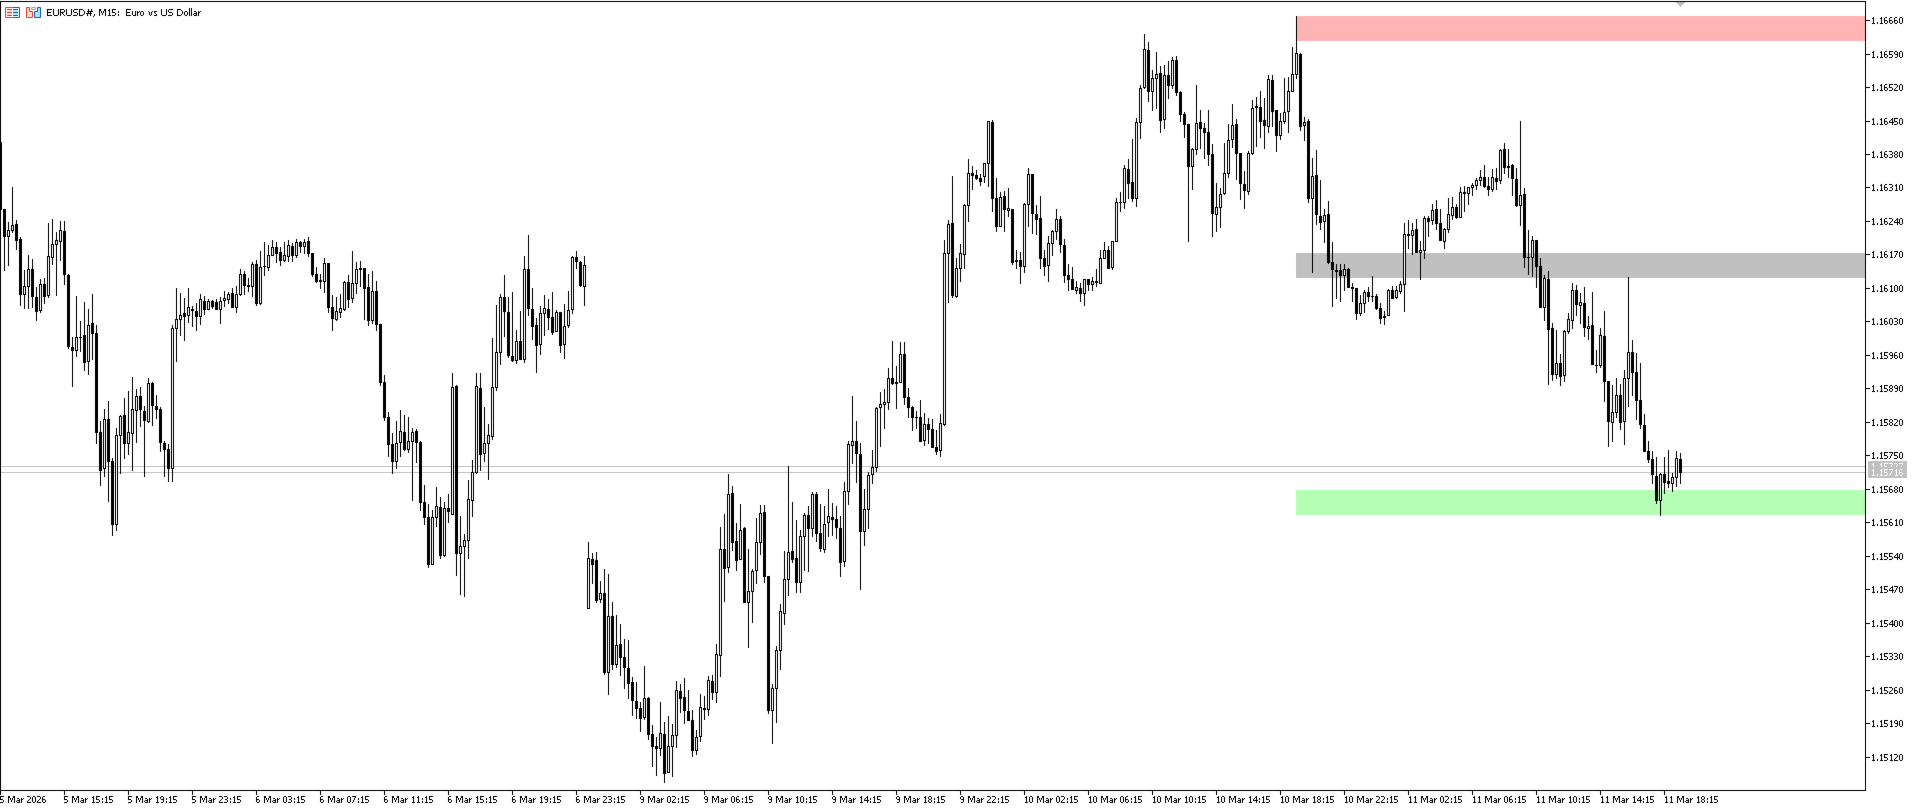
6. Range Analysis Zones (Premium & Discount)
-
Included Visuals: The indicator calculates the range of the current active market swing and partitions the chart into distinct shaded bands for:
-
Premium Zone (Top 50%)
-
Equilibrium (50% midpoint line)
-
Discount Zone (Bottom 50%)
-
Included Technical Disclaimer:
Pyjama Chart is exclusively a technical plotting utility that visualizes historical and mathematical price relationships on a chart. It does not provide trading signals, strategic advice, financial recommendations, or guarantees of profit. Financial trading involves a high degree of risk, and losses can exceed your deposits. Users must apply their own independent testing, analysis, and risk management strategies before committing any capital to the market.