Pyjama Chart
- Indicateurs
- Version: 1.20
- Mise à jour: 9 octobre 2026

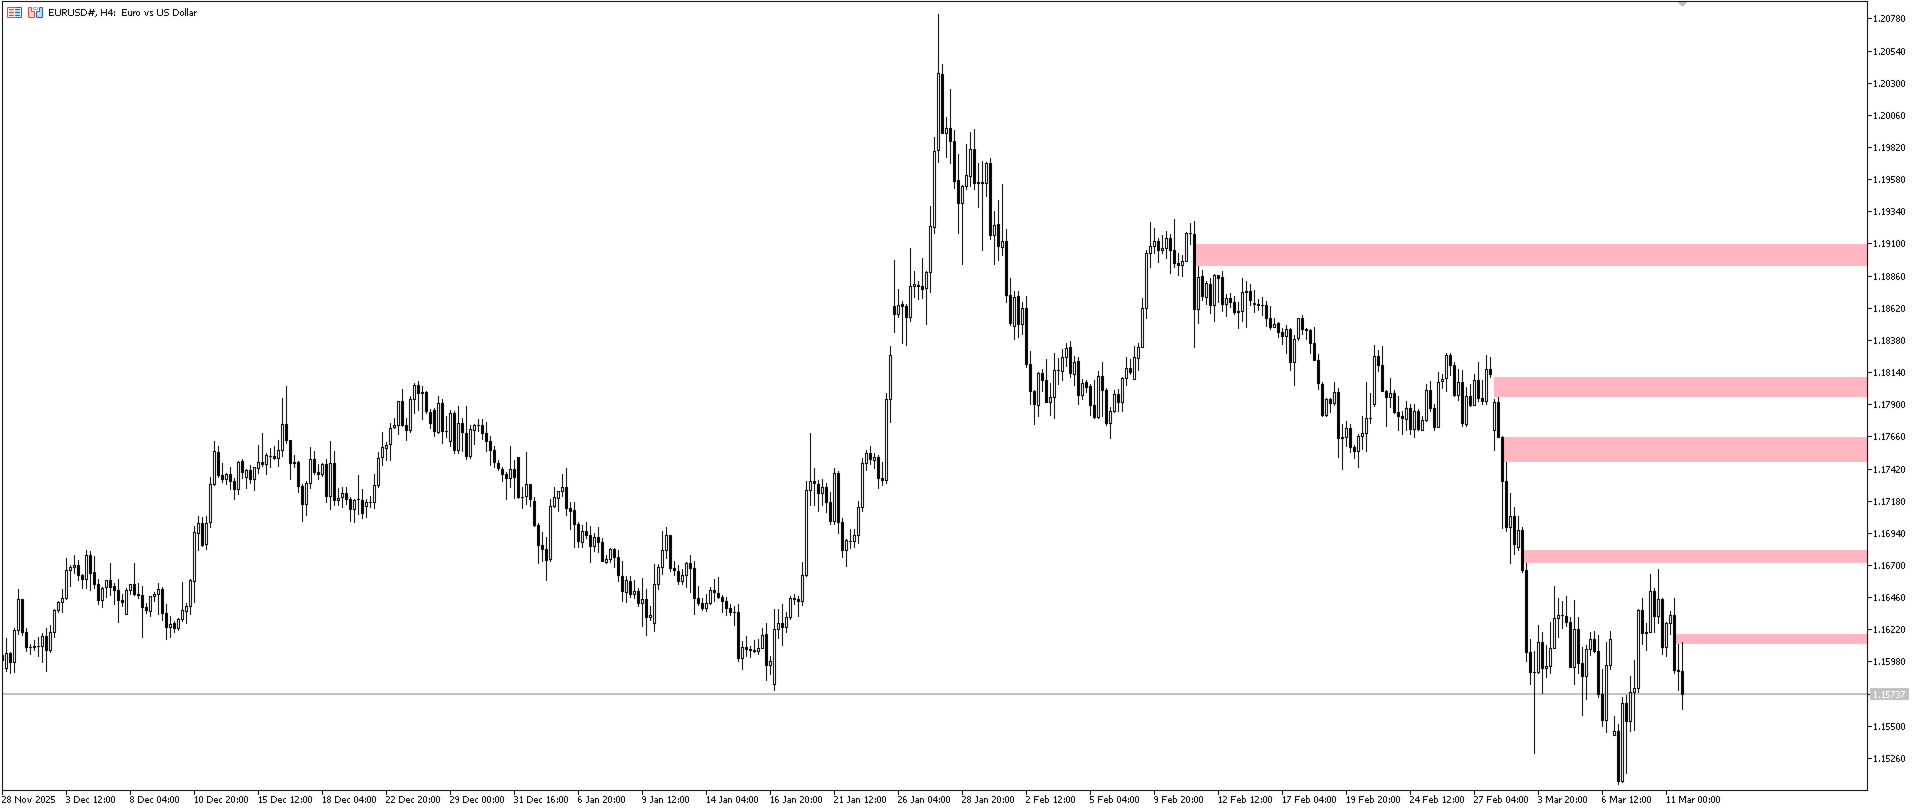
Pyjama Chart is a technical analysis indicator for MetaTrader 5 that plots price structure levels and imbalance zones directly on the chart.
The indicator identifies historical swings, breaks of structure, order blocks, fair value gaps, and liquidity levels according to customizable user parameters. Calculations and object management are optimized to minimize resource usage.
Features
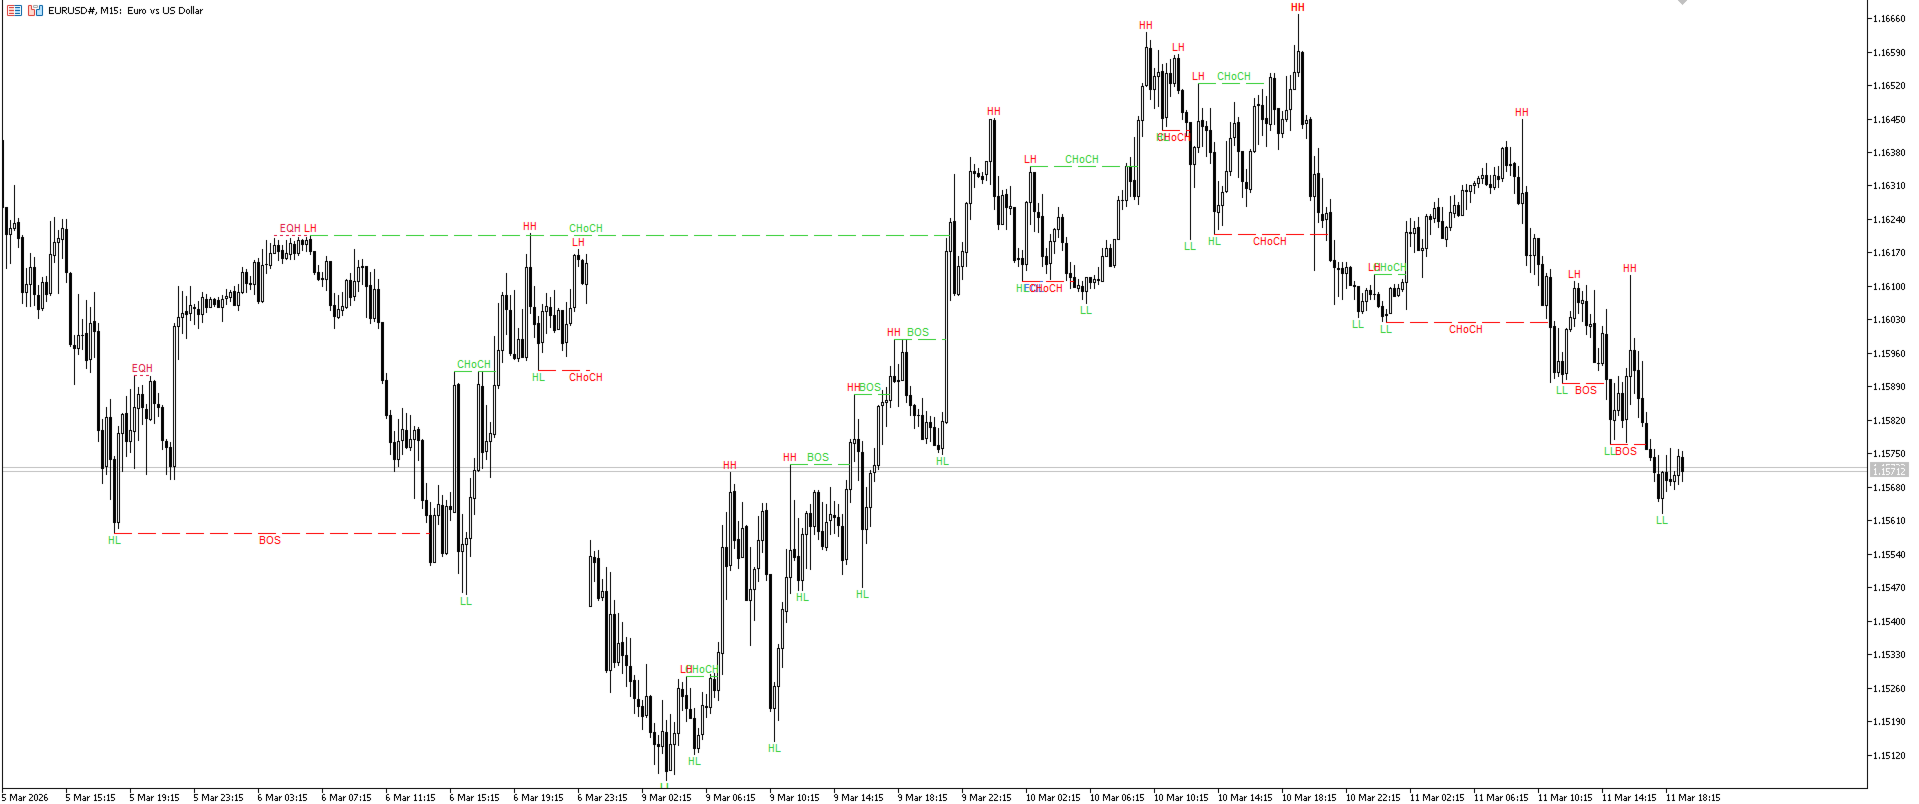
1. Market Structure
- Identifies macro (Swing) and micro (Internal) pivot points (HH, HL, LH, LL).
- Displays Break of Structure (BOS) and Change of Character (CHoCH) labels.
- Connects structural pivots to the break candle via origin lines.
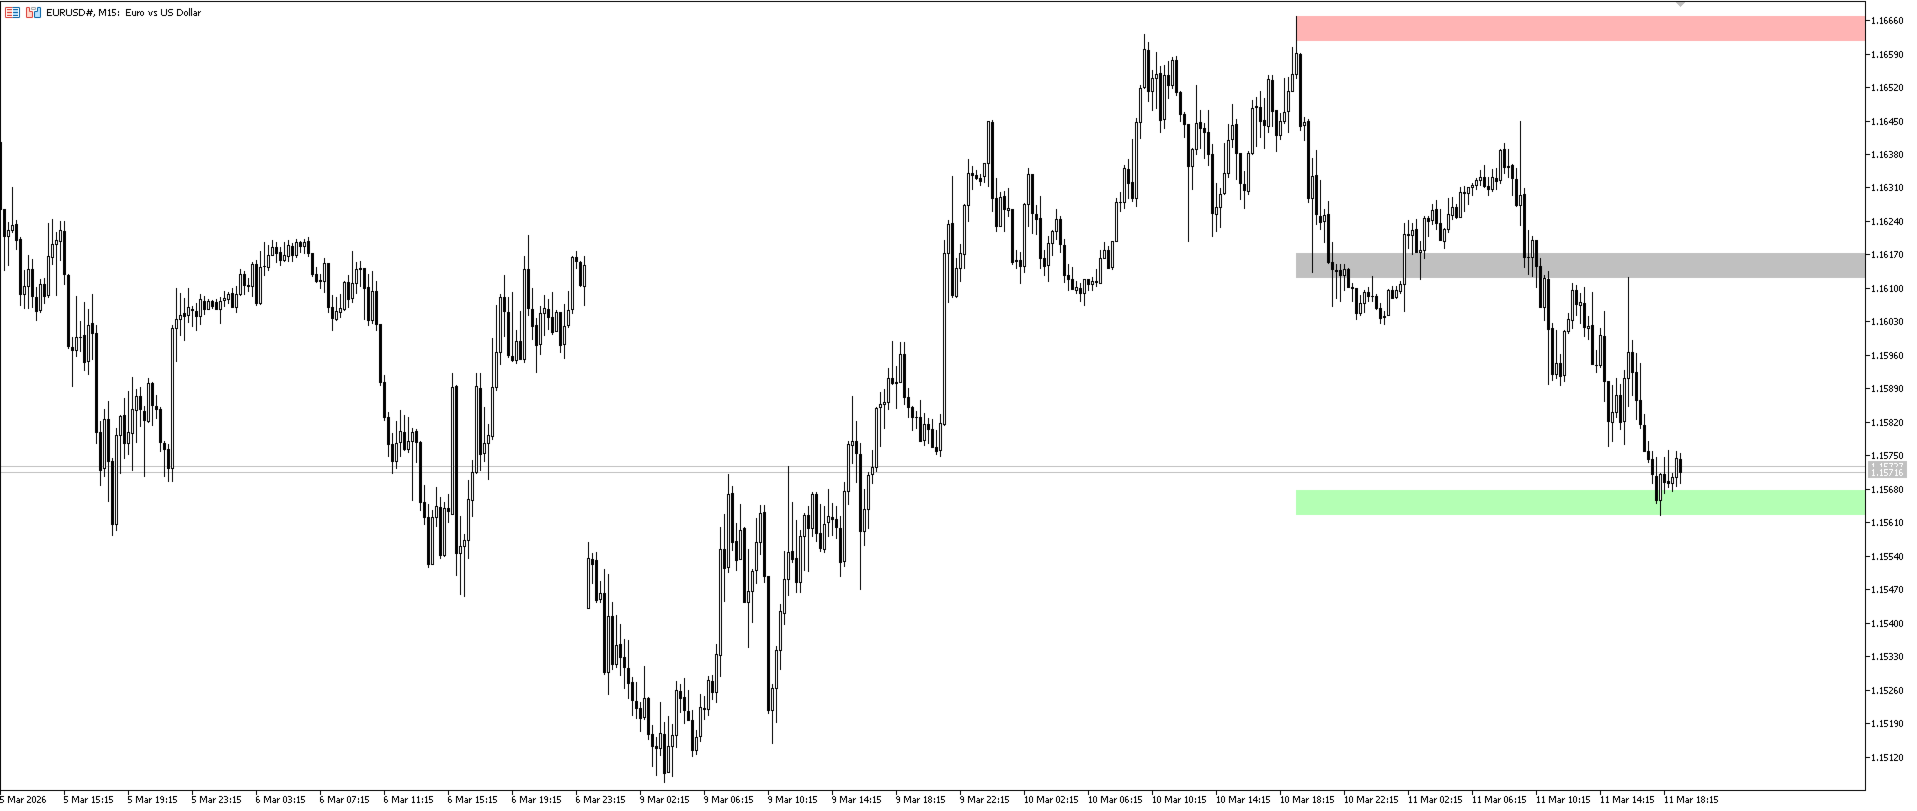
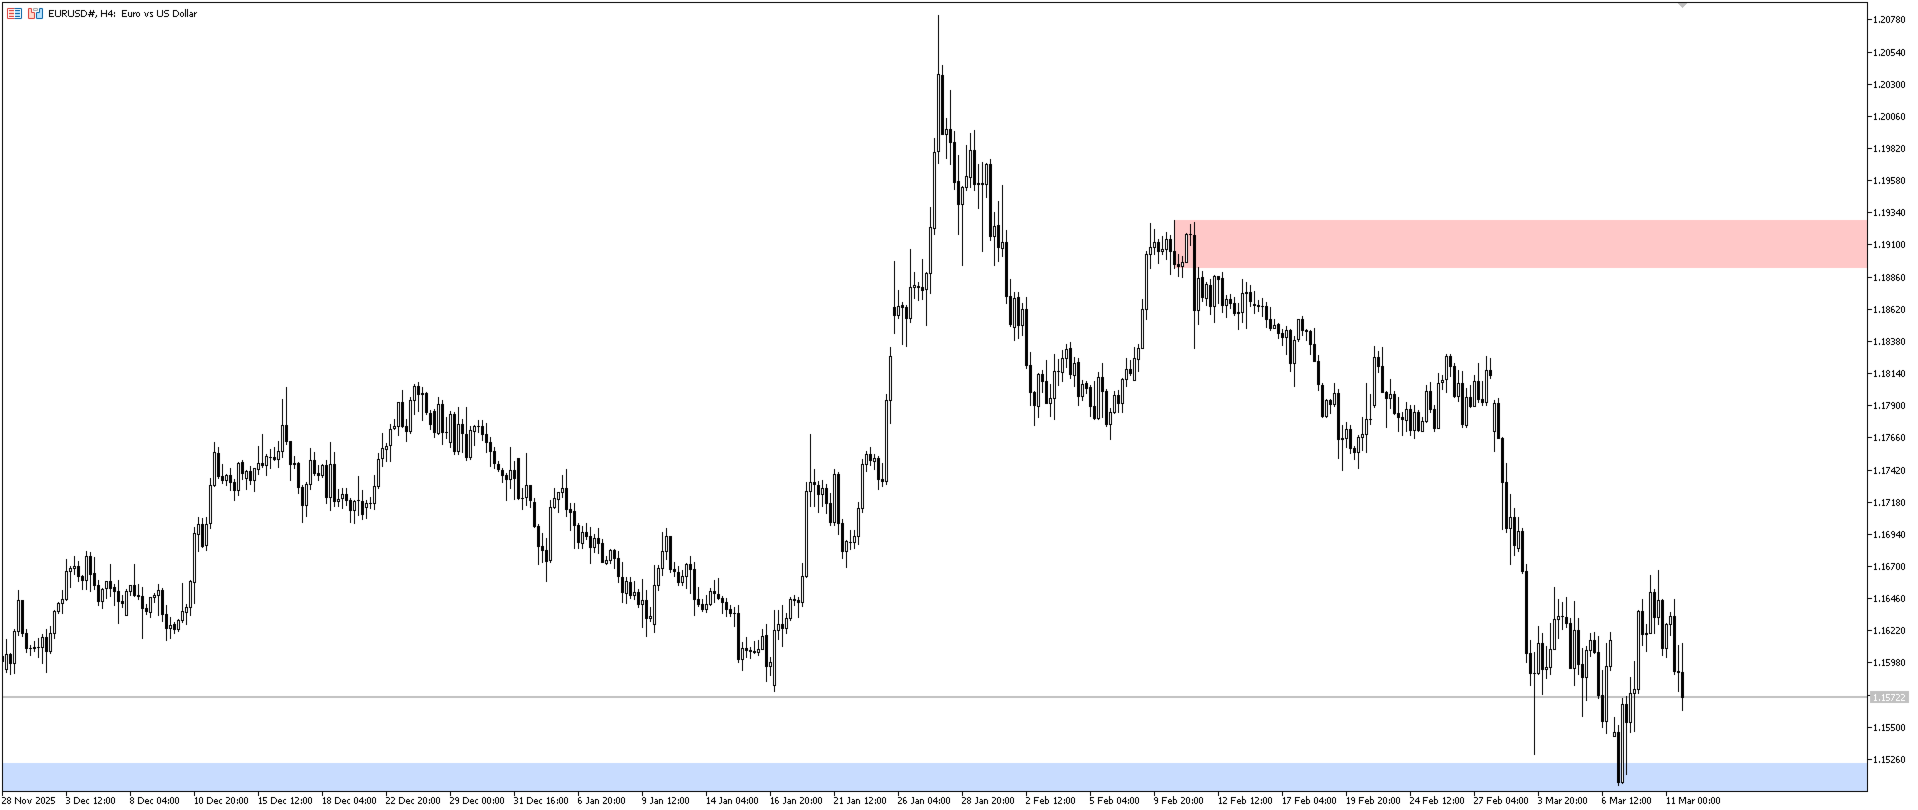
2. Order Blocks (Supply & Demand)
- Draws rectangle zones for internal and swing order blocks.
- Supports mitigation tracking: zones are removed or updated upon wick touch or candle close breach.
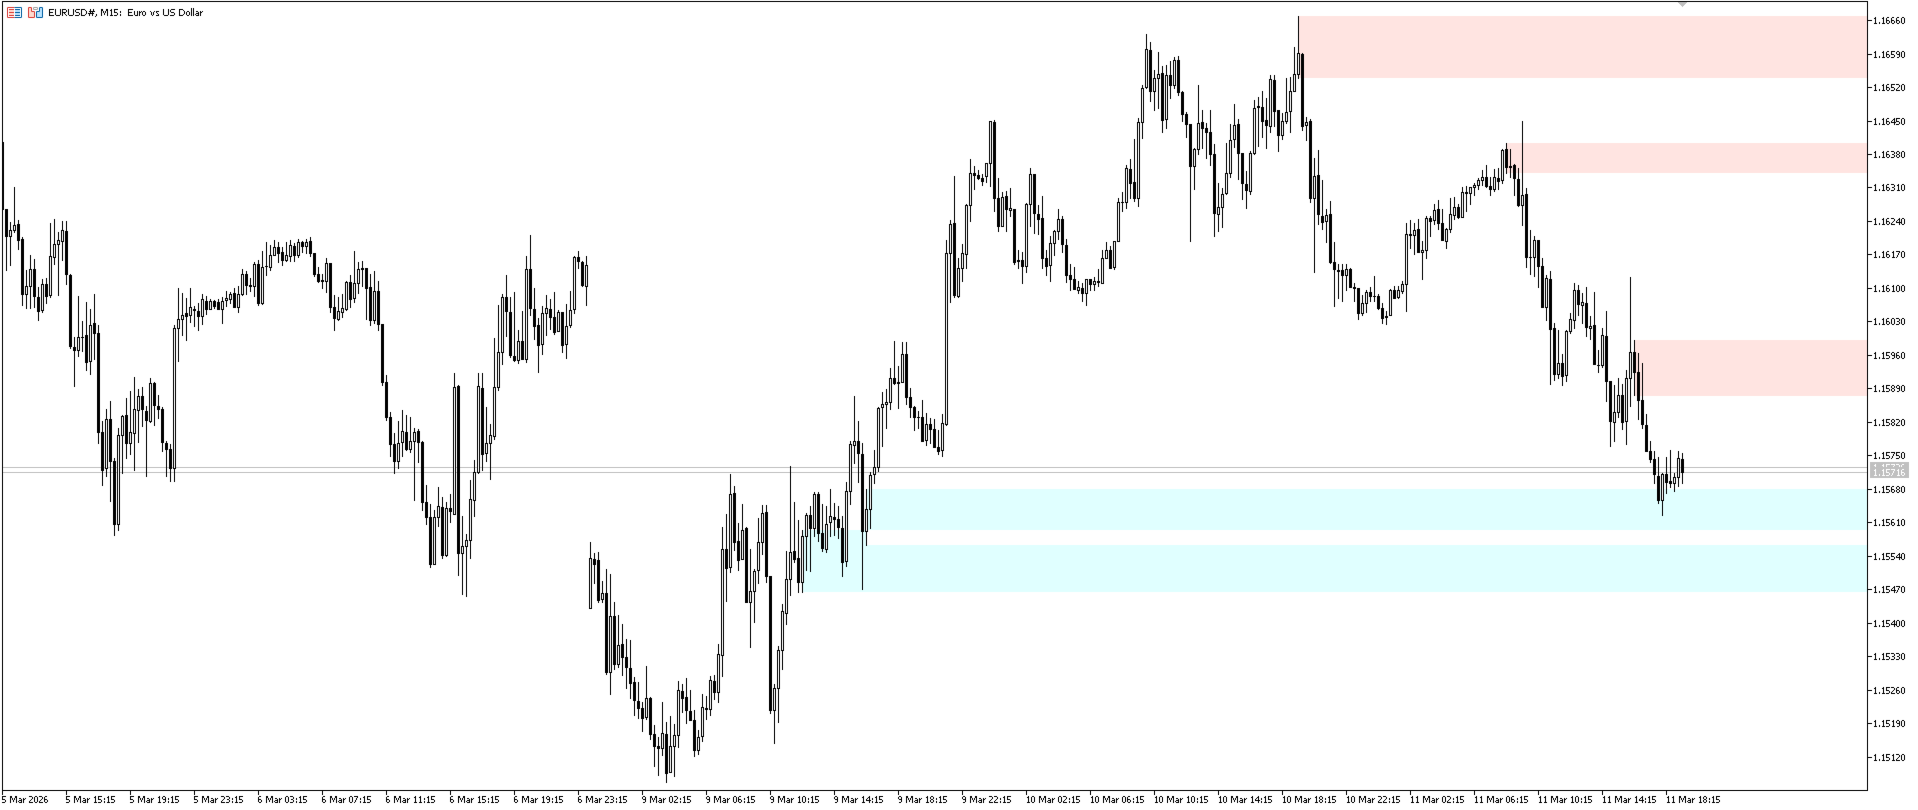
3. Fair Value Gaps (FVG)
- Detects three-candle imbalance gaps and renders them as rectangular zones.
- Monitors gap mitigation by price action.
4. Liquidity Levels (EQH / EQL)
- Detects Equal Highs and Equal Lows using a customizable lookback period.
- Uses volatility-based threshold calculation (ATR) for level grouping.
5. Volatility Measurement
- Filters structural points and order blocks using Average True Range (ATR) or Cumulative Mean Range (CMR).
6. Premium & Discount Range
- Divides the current active swing range into Premium, Equilibrium (50%), and Discount zones.
Main Input Parameters
- Structure Settings: Configure swing lookback period and pivot sensitivity.
- Visual Customization: Color, line style, and width settings for all lines and labels.
- Max Objects: Limit the maximum number of active graphical objects displayed on the chart.
- Mitigation Method: Choose between Wick touch or Body close for invalidating zones.
- Range Filter: Select between ATR or CMR calculation mode and set filter periods.