Axis Trend

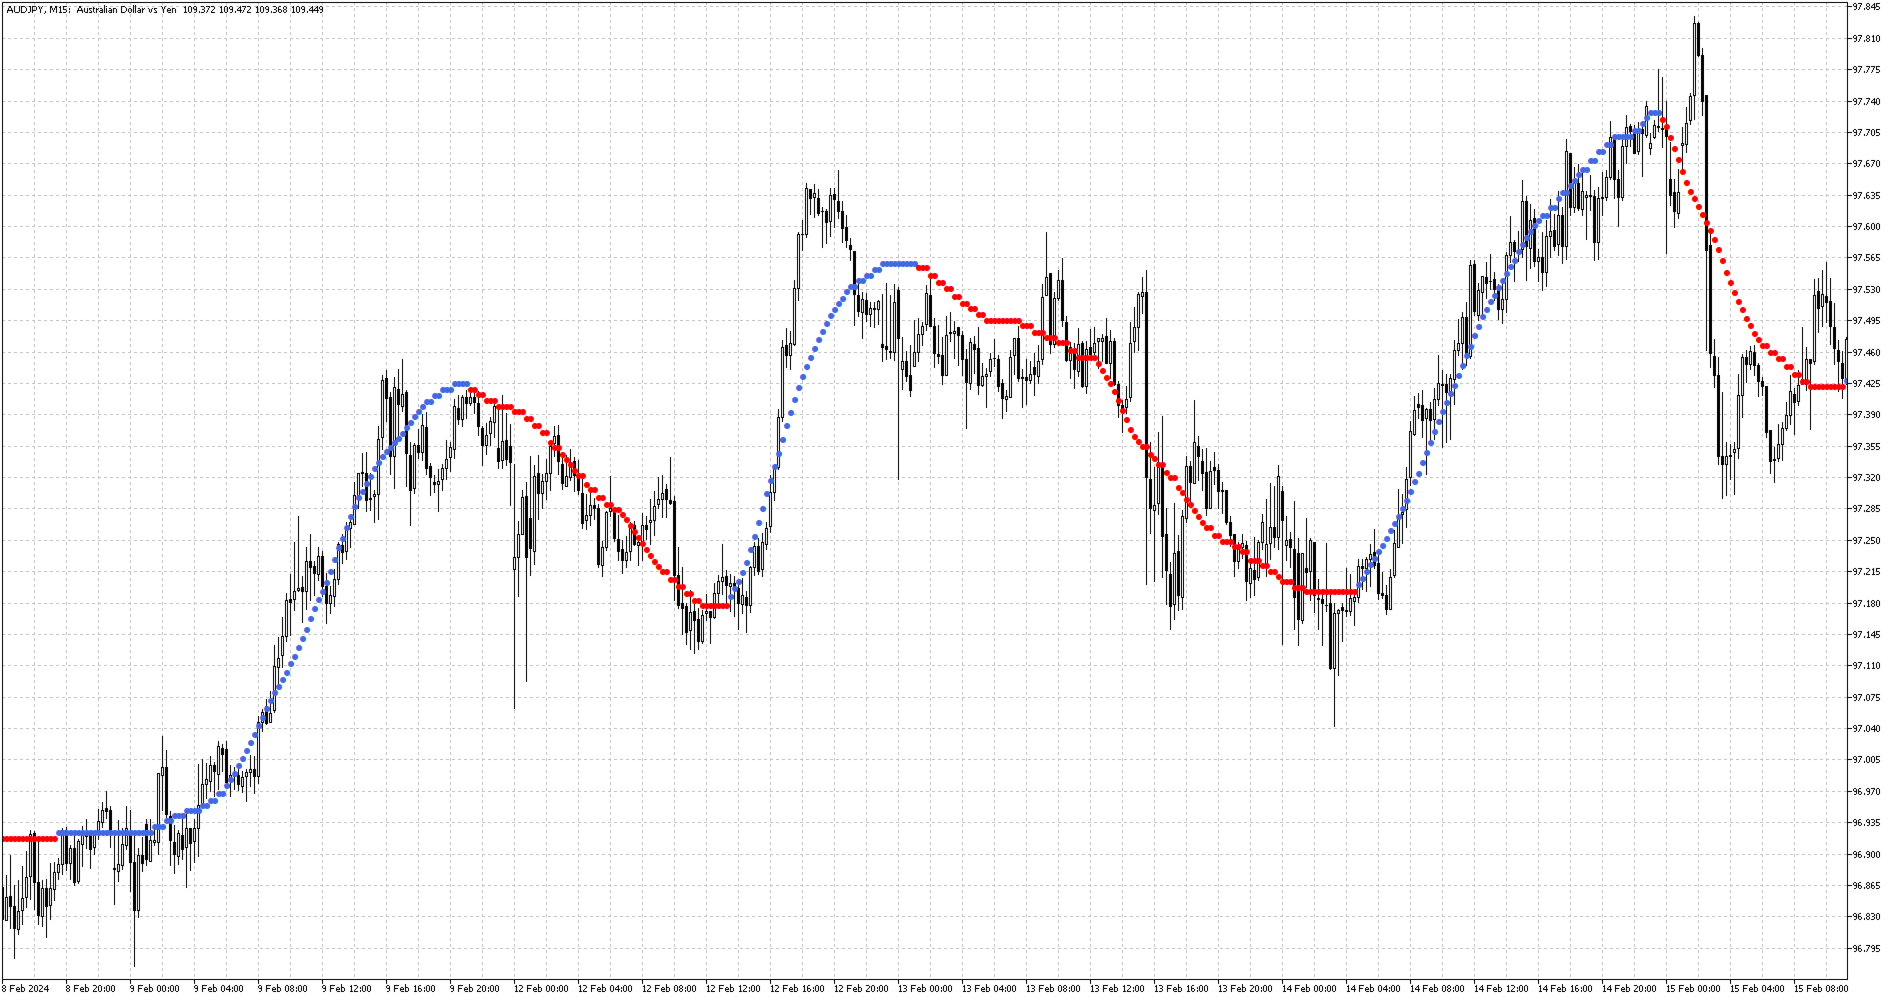
Axis Trend: Professional Analytical Foundation for Market Vector Identification

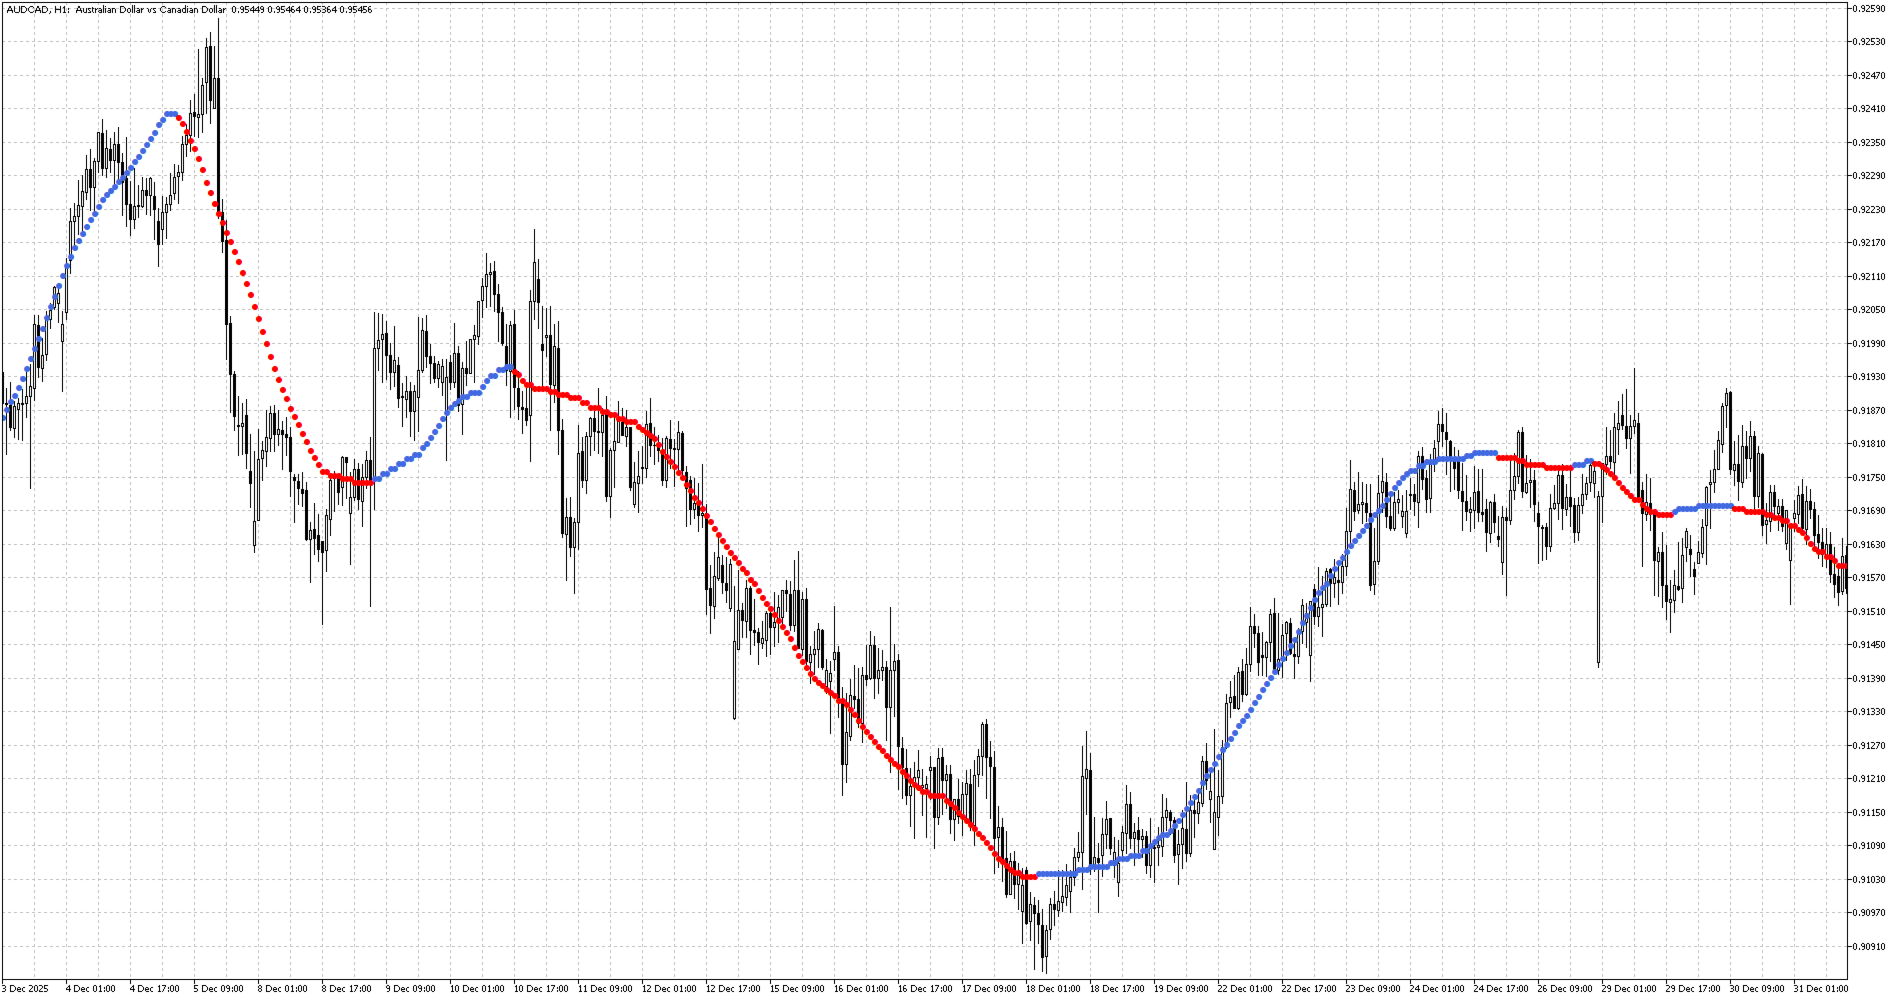
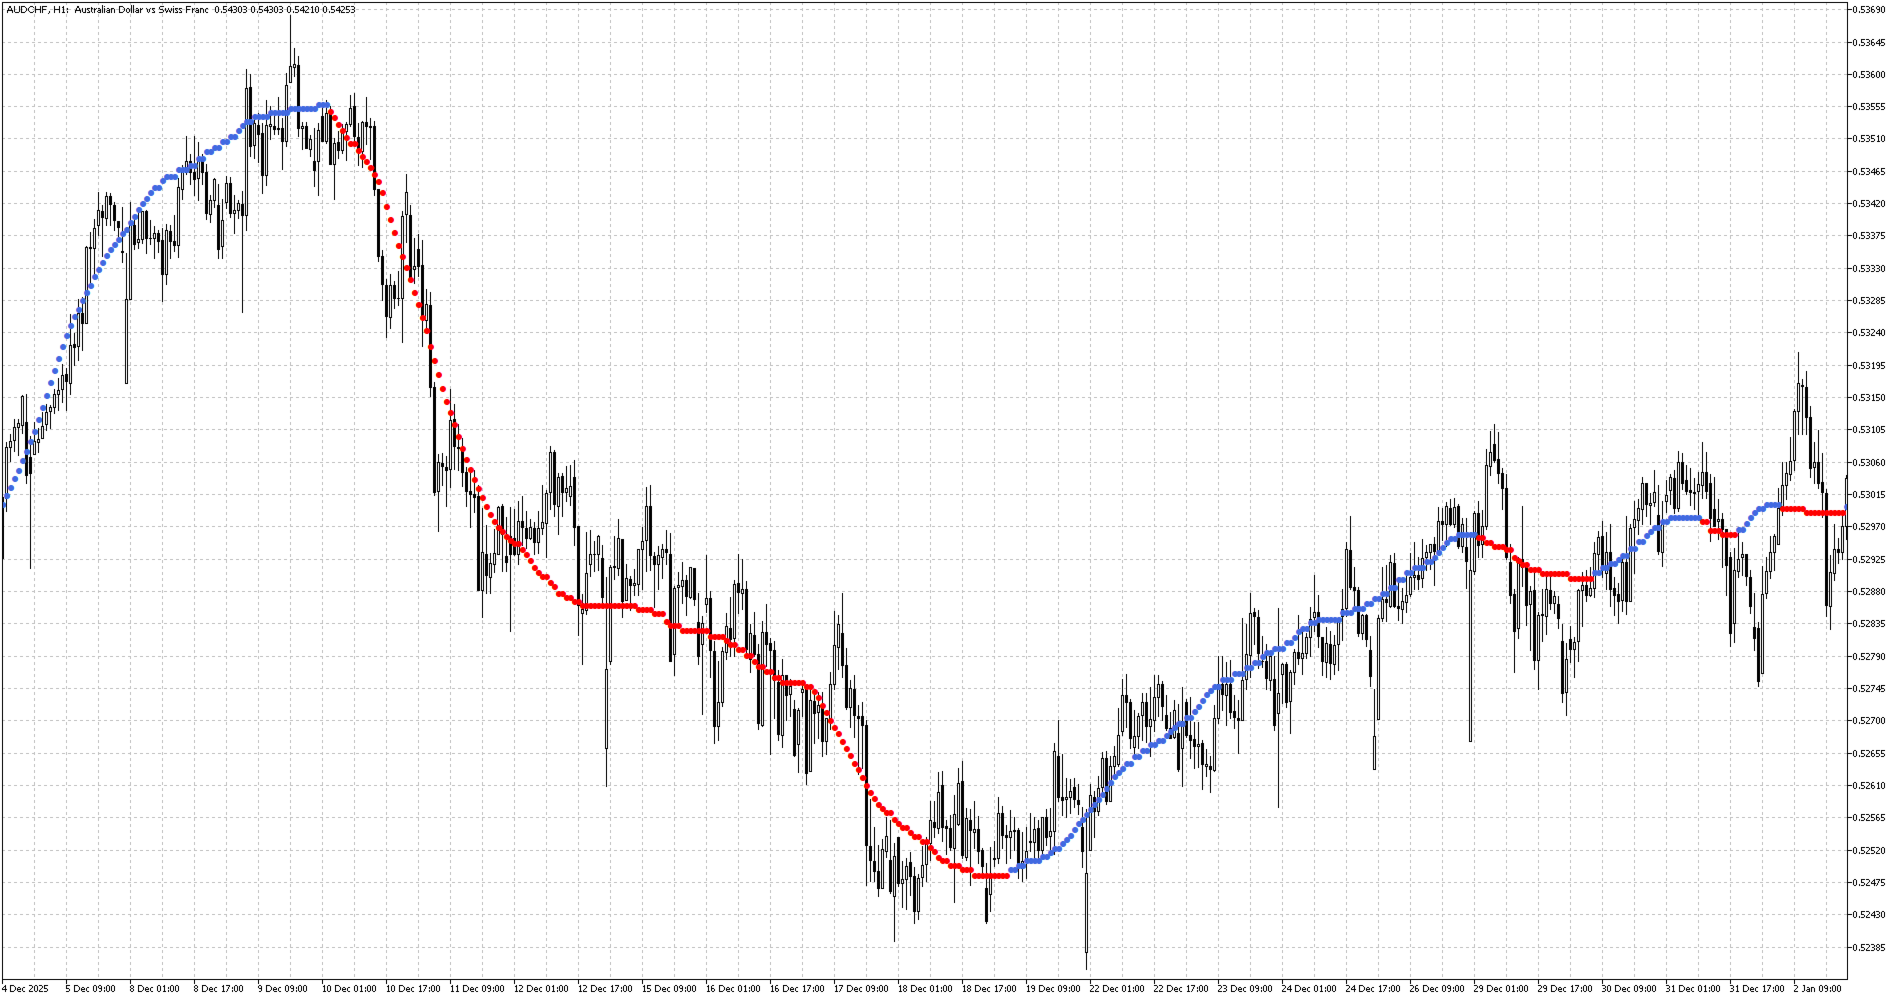
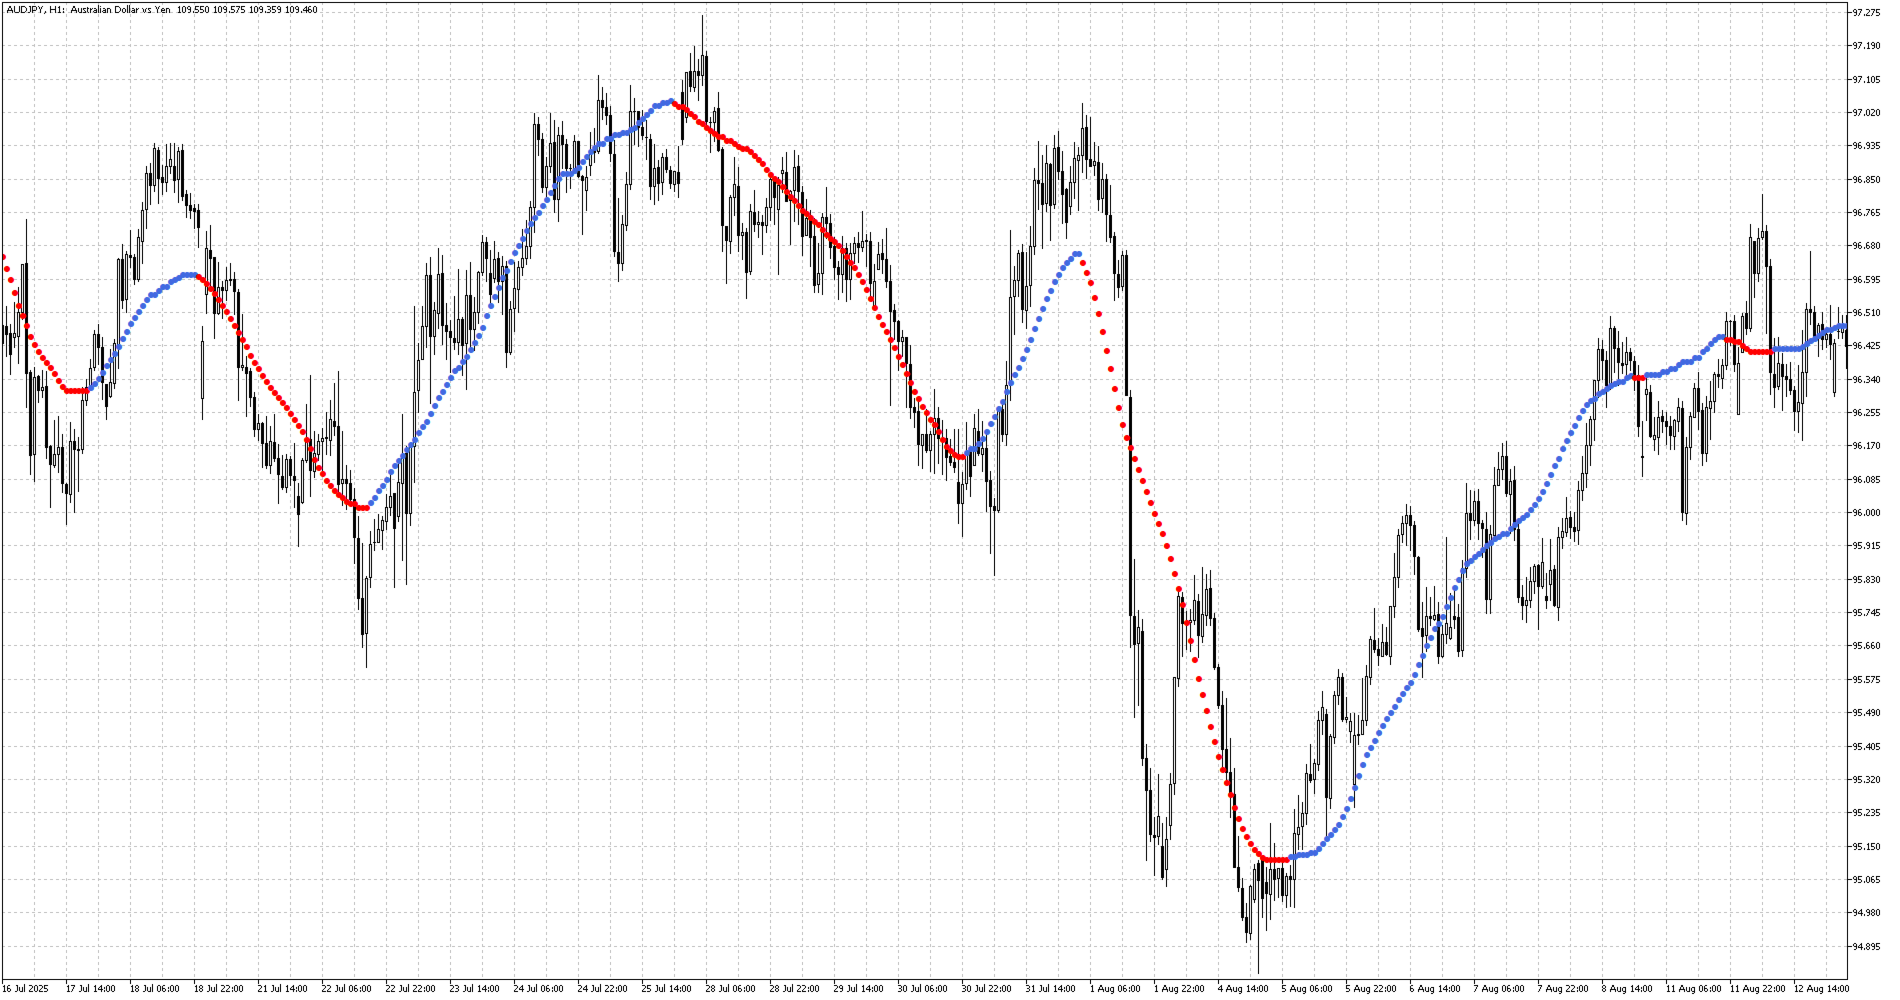
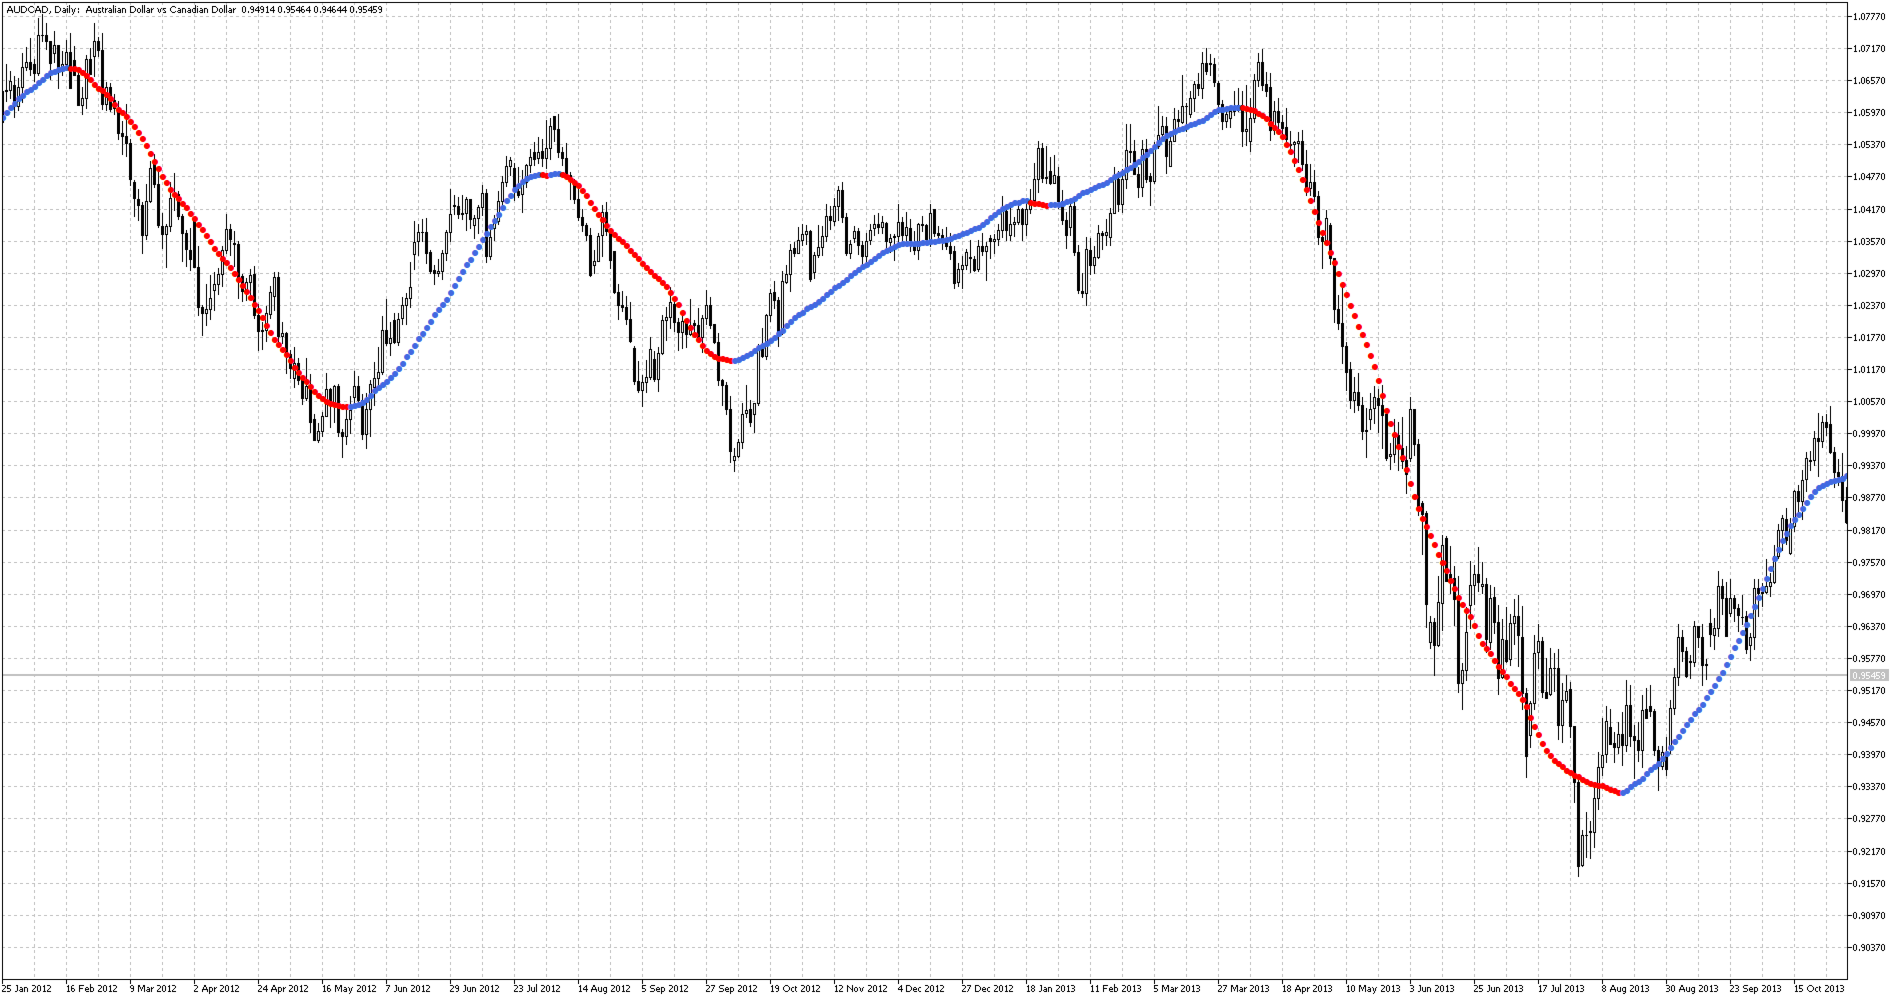
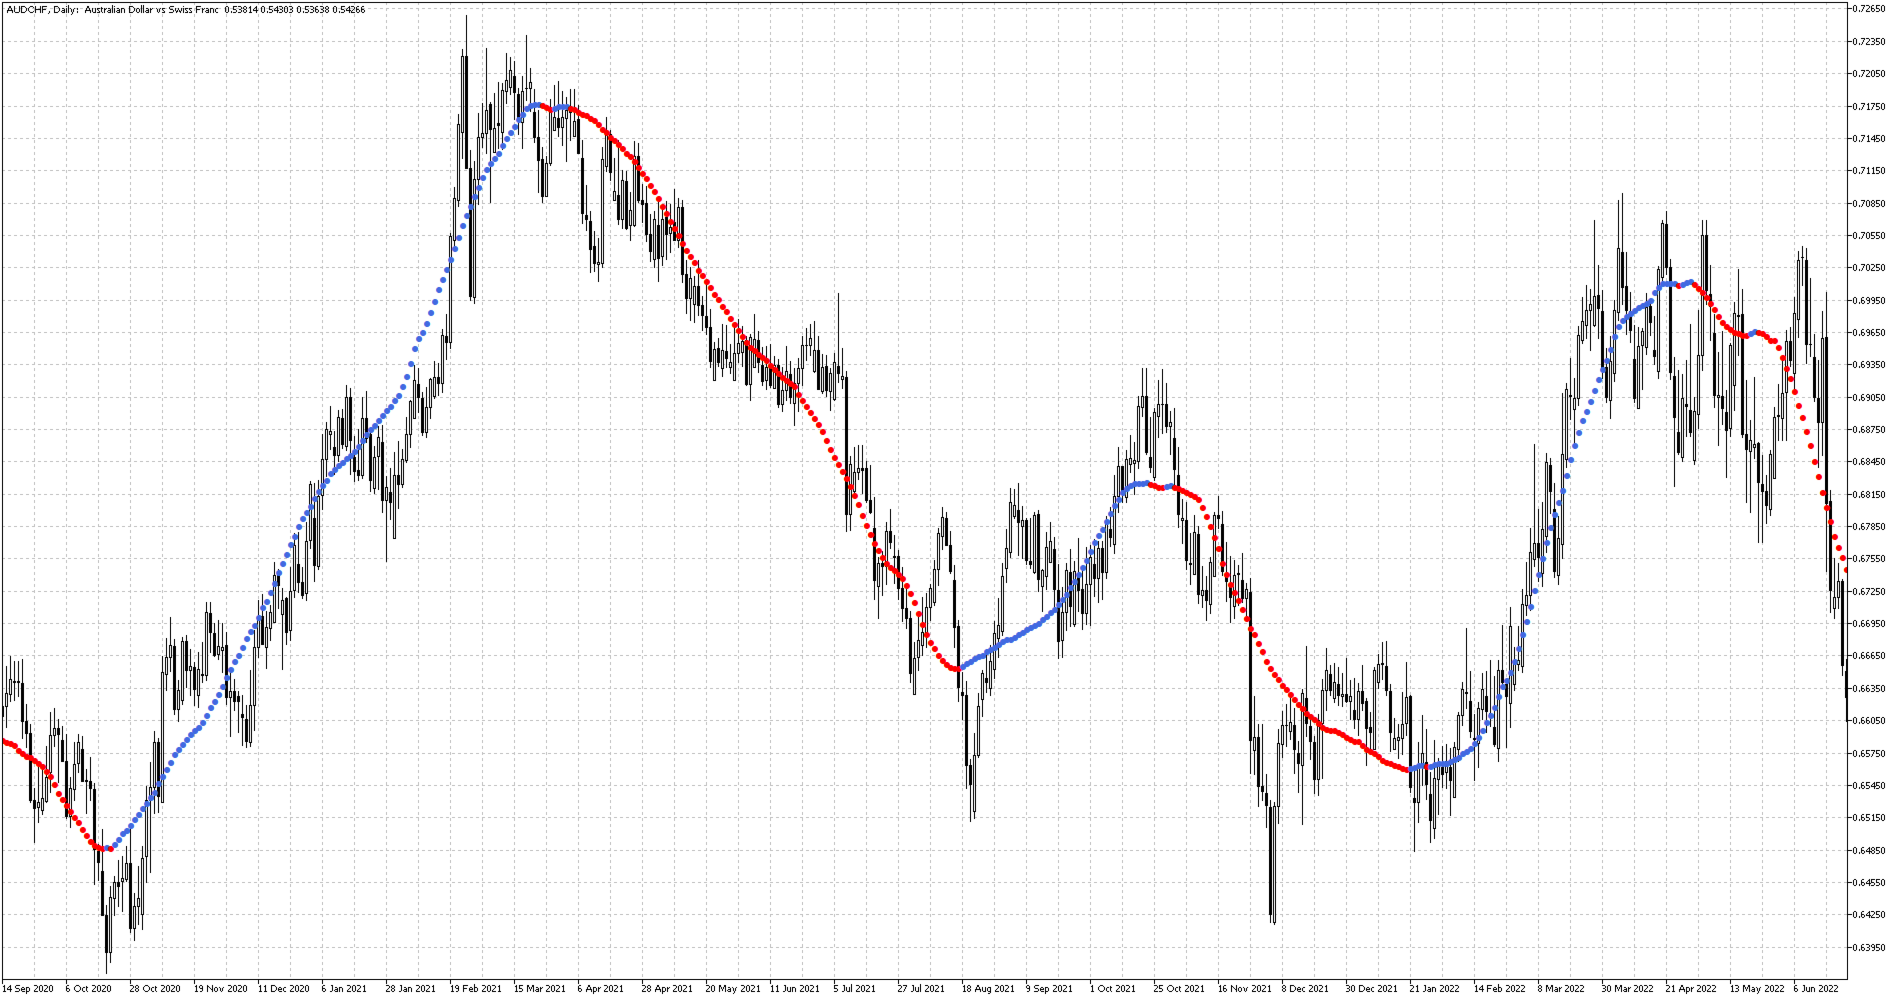
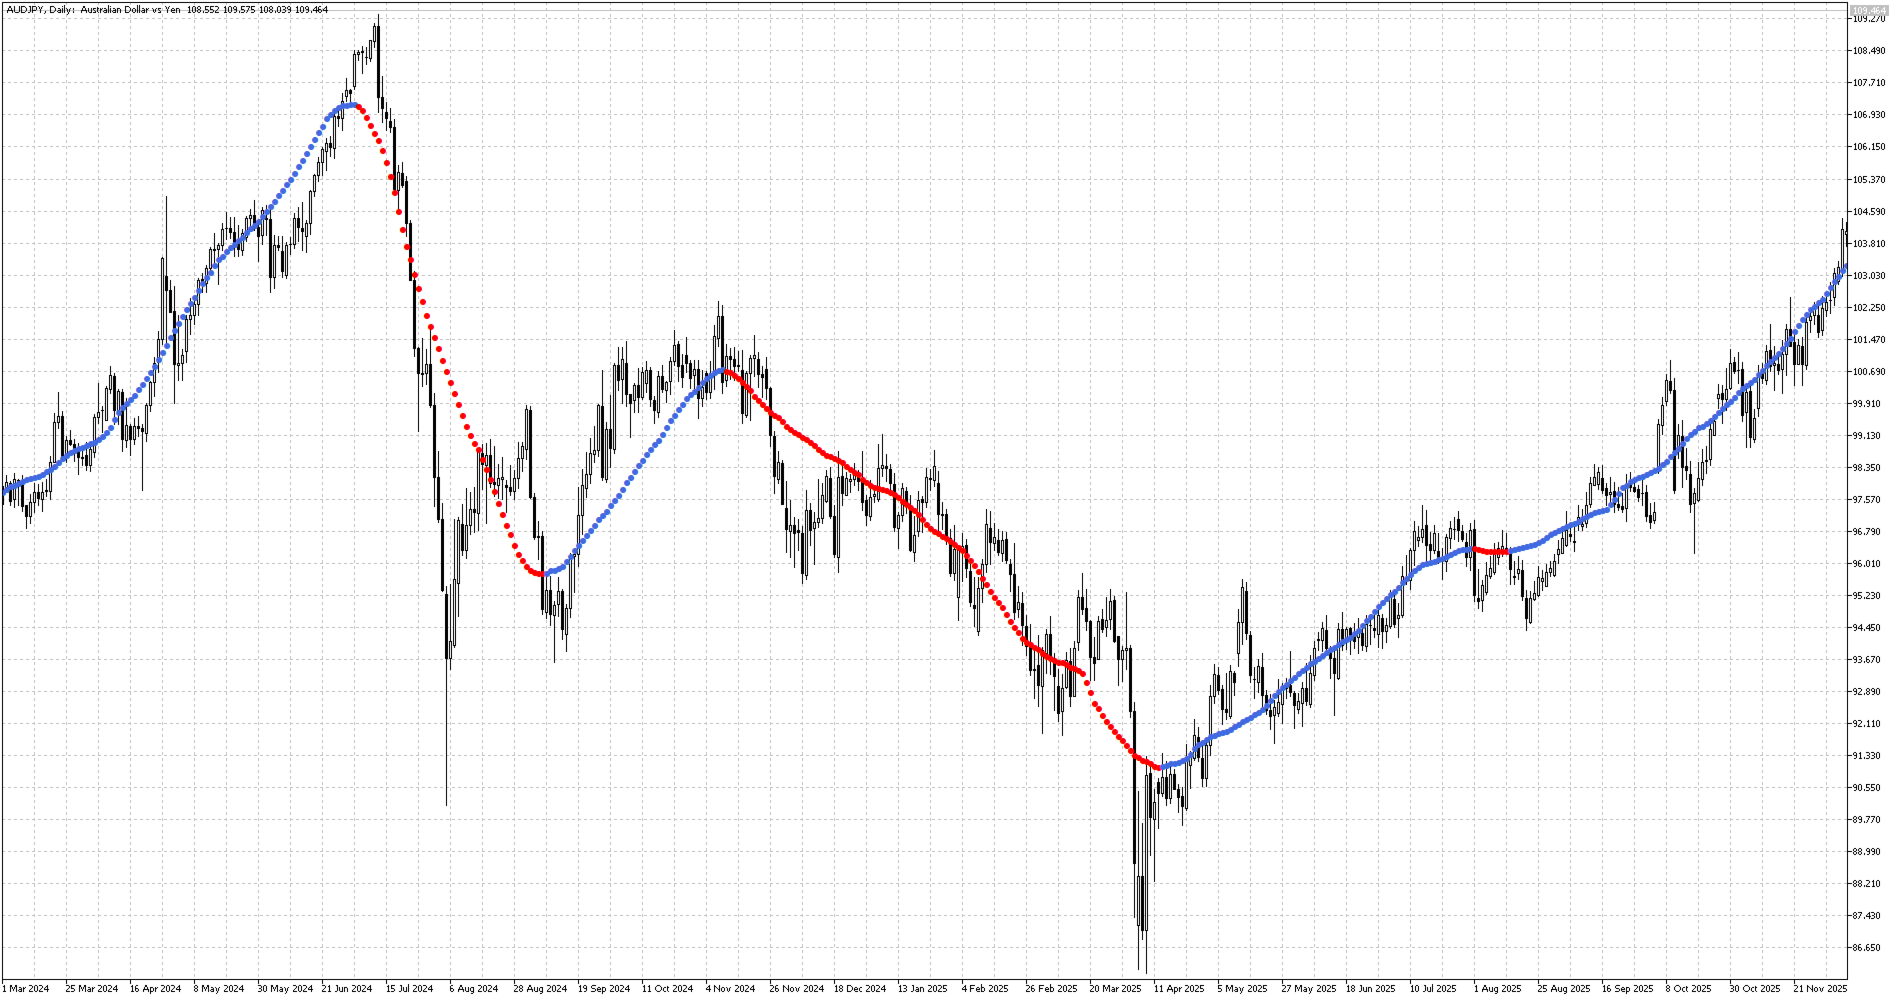
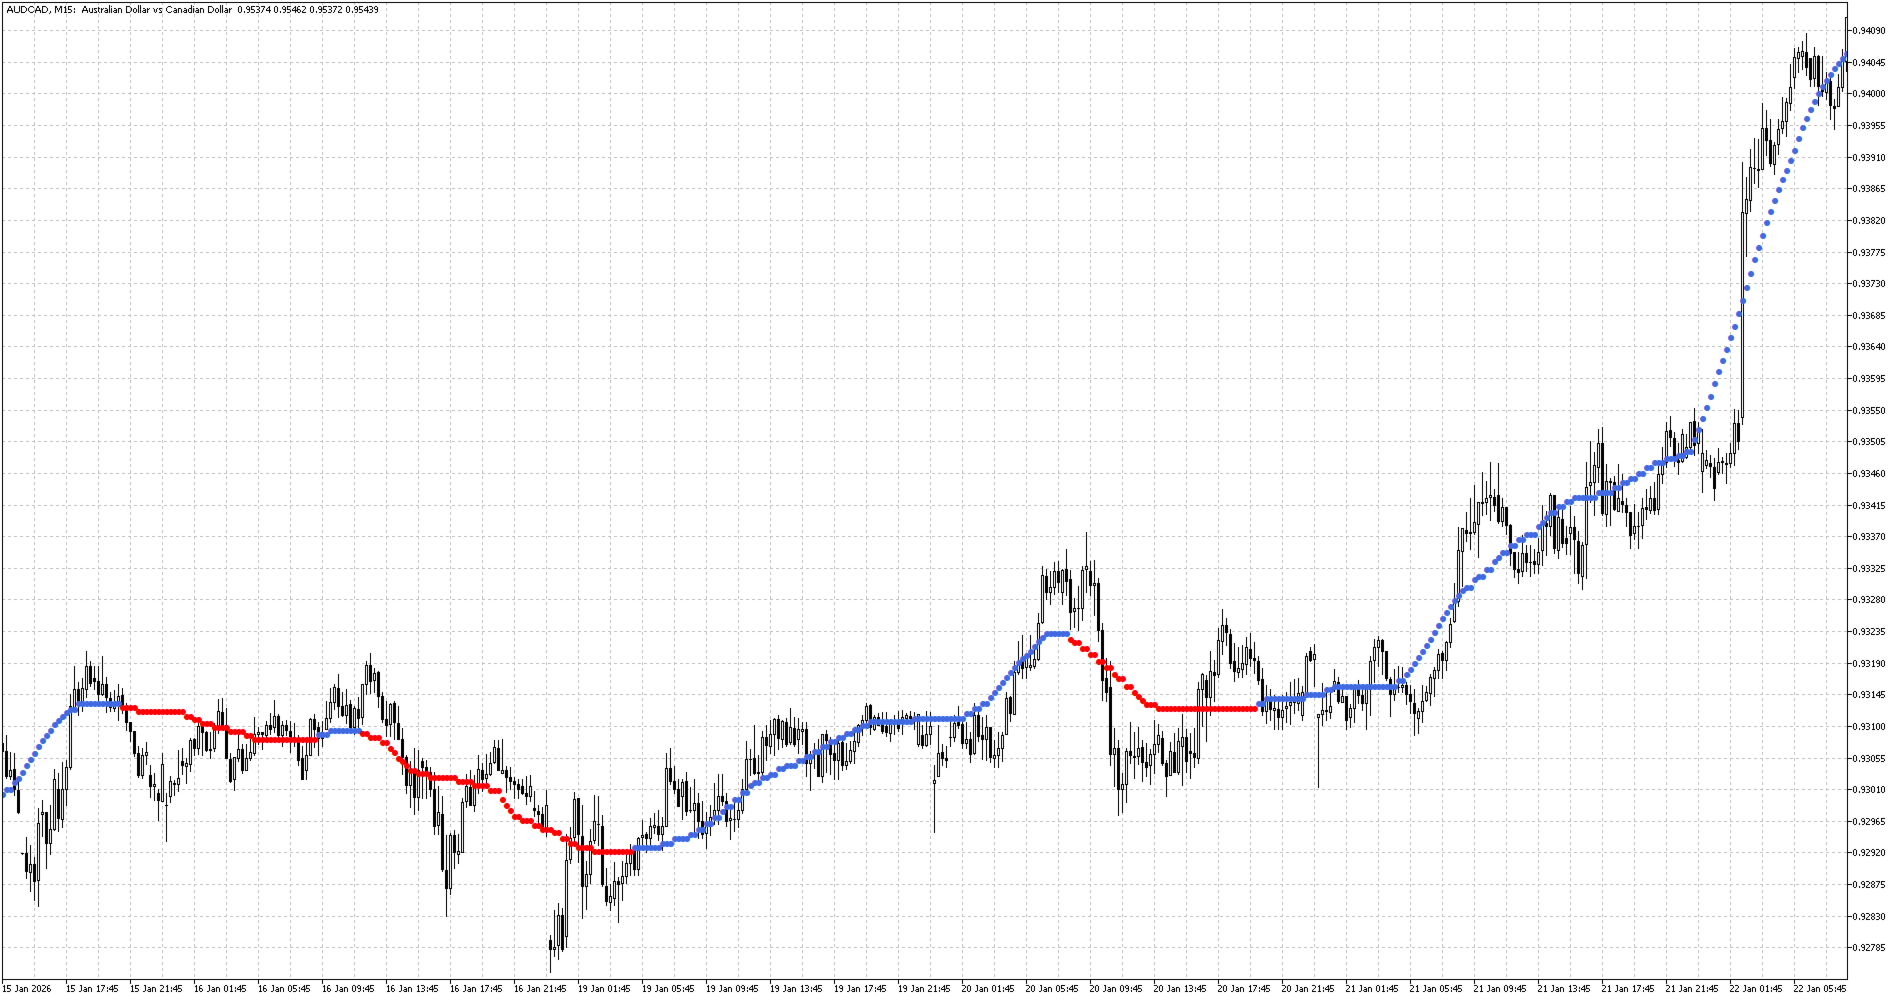
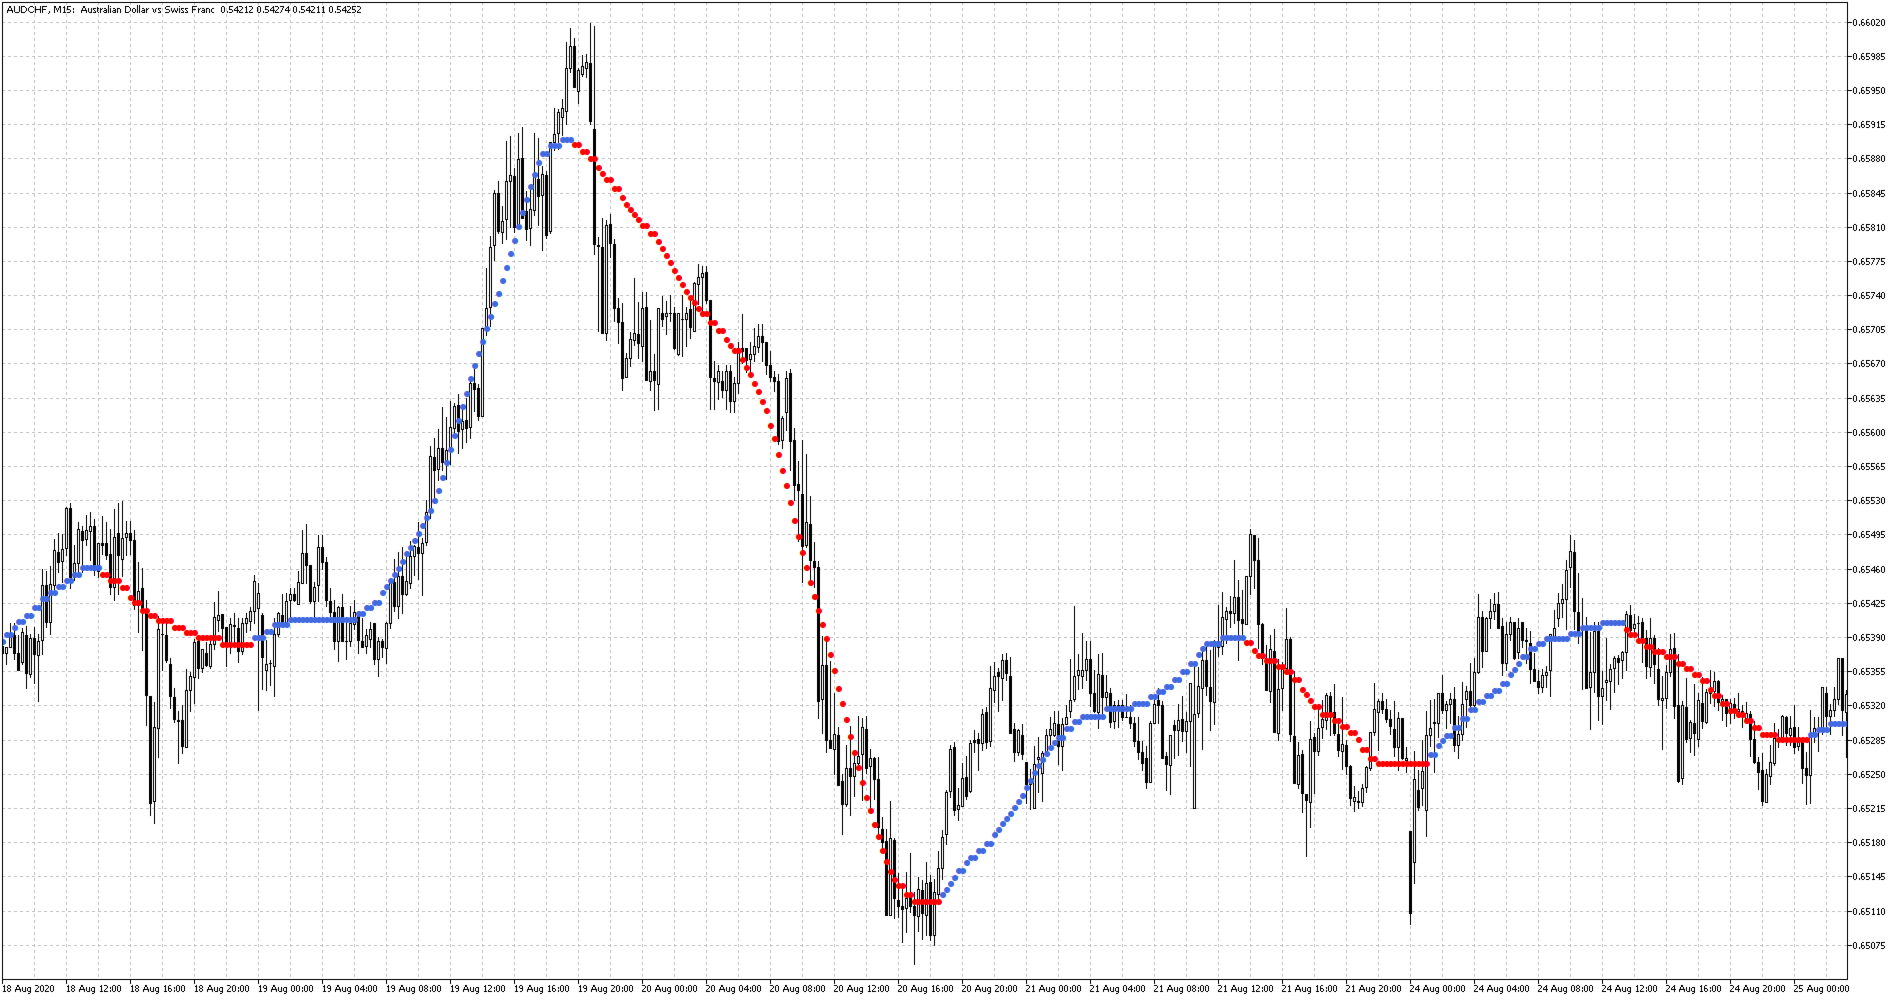
In high-volatility environments, identifying the true direction of market movement is a critical task. Axis Trend is a high-precision indicator designed to pinpoint dominant trend phases and filter out intraday market noise. The algorithm is based on the "Dynamic Axis" concept, which adapts to price changes to provide traders with clear, objective visual signals.

This indicator is an essential tool for those seeking a robust filter for their entries, effectively minimizing the impact of false breakouts and short-term price fluctuations.

Core Features:

  • Visual Clarity: Intuitive color-coded trend direction signals plotted directly on the price chart.
  • Signal Stability: Powered by verified mathematical smoothing models, ensuring consistent and reliable signal generation.
  • Zero Bias: Provides an objective view of market structure, removing emotional or subjective interpretation.
  • Multifunctional: Compatible with all timeframes and asset classes, including Forex, Commodities, Indices, and Equities.

Technical Specifications (Inputs):

  • Length – The main calculation period (analytical depth).
  • AppliedPrice – The price constant used for data processing (Close, Open, High/Low).
  • Filter – A parameter for additional signal refinement and noise reduction.
  • Deviation – A coefficient used to adjust the indicator's sensitivity to price spikes.
  • Shift – Horizontal displacement of the indicator on the time axis.

추천 제품
MTF VWAP Indicator - Quick Overview   This indicator shows you where institutional money is flowing across multiple timeframes using Volume Weighted Average Price (VWAP) to identify high-probability trading zones.     What It Actually Does:     1. Tracks Smart Money Levels: - Shows Daily, Weekly, and Monthly VWAP lines where big players (banks, funds) are trading - Tells you if price is above or below these key institutional levels - Shows distance from VWAP as a percentage (tells you how extend
Volume flow Profile
Israr Hussain Shah
Master Edition은 거래량과 자금 흐름의 관점을 통해 시장 구조를 시각화하도록 설계된 전문가급 분석 도구입니다. 표준 거래량 지표와 달리, 이 도구는 차트에 일일 거래량 프로필을 직접 표시하여 가격 발견이 발생한 위치와 "스마트 머니"가 위치한 곳을 정확하게 볼 수 있게 합니다. 이 Master Edition은 명확성과 속도를 위해 설계되었으며, 로드 시 차트 레이아웃을 즉시 아름답게 만드는 독특한 자동 테마 동기화 시스템을 특징으로 합니다. 주요 기능: 진정한 자금 흐름 계산: 표준 틱 거래량을 넘어섭니다. "Use Money Flow"를 활성화하면 거래량이 가격에 따라 가중치가 부여되어 특정 가격 수준에서의 실제 자본 투입을 드러냅니다. 가치 영역(VA) 시각화: 가치 영역(기본값: 거래량의 70%)을 자동으로 계산합니다. VA Fill: 통제 구역을 즉시 식별하기 위해 가치 영역 배경을 음영 처리합니다. 주요 수준: 통제점(POC), 가치 영역 고점(VAH), 가치 영
LiquidXPro Reverse
Alex Amuyunzu Raymond
LiquidX Pro - Precision Reversal Engine "Professional multi-confluence reversal detector that identifies high-probability tops and bottoms using institutional liquidity sweeps, volume exhaustion, and momentum divergence" Overview LiquidX Pro - Precision Reversal Engine is a sophisticated, professional-grade indicator designed for serious traders who want to catch high-probability market reversals with institutional precision. Stop chasing breakouts that fail—start trading reversals that pay. Thi
QuantDynamics
Marius Ovidiu Sunzuiana
The integrated control panel of QuantDynamics gives you full command over the indicator’s intelligence. With a single click, you can: Switch between quant models Adjust sensitivity and precision Activate enhanced modes for deeper analysis Toggle advanced filters and signal layers Monitor real‑time metrics and probability outputs The panel is engineered for speed, clarity, and instant decision‑making , even in fast markets. It reduce the noise and react in a high AI methods which are defined into
HtfCandleProjection
Salama Sarobidy Andrianthary
HTF Candle Projection C'est un outil vraiment utile. Il vous montre, directement sur votre graphique, des bougies d'unités de temps plus grandes ou même des périodes que vous avez définies. Avec lui, vous pouvez voir jusqu'à 3 projections différentes en même temps. Ça vous donne une bonne idée des grandes tendances, sans avoir à changer d'unité de temps. Voici ses principaux atouts : Voir plusieurs unités de temps à la fois : Vous pouvez afficher des bougies H4, D1, W1, ou même des périodes qu
ScalperGun
Mikhail Nazarenko
Scalper gun  - главное оружие для торговли скальпингом и свингом, с визуализацией и алертом точек входа. Индикатор работает как в трендовых, так и в нетрендовых рыночных условиях. Подходит начинающим и опытным трейдерам.  SCALPER GUN превосходит по скорости, качеству визуализации и точности входа популярные топовые индикаторы этого сайта!!! Перед покупкой скачайте демо Scalper gun и сравните с аналогичными индикаторами для скальпинга в тестере MT4. Особенности Это готовая торговая система с визу
Weis Wave Scouter
Jean Carlos Martins Roso
Weis Wave Scouter는 MetaTrader 5용으로 개발된 혁신적인 지표로, Wyckoff 방법론과 VSA(Volume Spread Analysis)의 검증된 원칙을 결합했습니다. 높은 정확성과 깊이 있는 분석을 원하는 트레이더를 위해 설계되었으며, 누적 거래량 파동 분석을 통해 시장을 전술적으로 읽고 추세 반전 및 지속의 핵심 포인트를 식별하는 데 도움을 줍니다. 이 지표는 선명한 시각적 인터페이스를 제공하며, Classic, NightVision, OceanBreeze 등 다양한 테마의 사용자 지정 가능한 색상 히스토그램을 통해 상승 및 하락 파동을 시각화합니다. 주요 기능에는 거래량 급증 감지, 낮은 활동 영역(DeadZone) 식별, 거래량 기반 파동 반전 경고 설정이 포함되어 있습니다. 또한 노력 대비 결과 분석, 원인과 결과 분석, 수요와 공급 분석 등 Wyckoff 및 VSA 이론의 핵심 요소를 지원합니다. Brick Size, Volume Scale Fact
Footprint is an indicator for order flow and volume analysis. It helps identify market structure at the cluster level, find key zones with increased activity, and work with filters directly on the chart without constantly opening the settings window. Footprint Indicator Features cluster-based Bid x Ask and Delta charts; on-chart control panel; sliders for filter adjustments; Absorption; Initiative; Stacked Imbalances; Big Trades; dPOC / Dynamic Point of Control; Delta; side market profile; cumul
Buy Sell Visual MTF V2 for MT5
Naththapach Thanakulchayanan
This MT5 indicator, Bull Bear Visual MTF V2, summarize the strength color graphic and percentages of power for both  Bull and Bear in current market emotion stage which will show you in multi timeframes (21) and sum of the total Bull and Bear power strength which is an important information for traders especially you can see all Bull and Bear power in visualized graphic easily, Hope it will be helpful tool for you for making a good decision in trading.
STRUCTURE DU MART SR ULTIMA  Structure ultime du marché et indicateur intelligent de support/résistance SMART STRUCTURE SR ULTIMA est une solution de trading avancée conçue pour fournir une lecture claire, précise et professionnelle de la structure du marché. Conçu pour les traders modernes, cet indicateur combine une structure intelligente (DER/DES) , des niveaux de support et de résistance dynamiques et un système unique de Structure Fan qui visualise la force du marché, son expansion et ses z
Tik Tok
Ivan Simonika
The Tik Tok indicator was created on the basis of the original extreme search indicators, the indicator is well suited for determining a reversal or a big sharp jerk in one direction, thanks to it you will know when this happens it will notify you when a blue dot for buying red for sale appears. It basically uses the process of detecting the rate of change in price growth and allows you to find entry and exit points from the market. fundamental technical indicator that allows you to assess the
Color Histogram Volume Set
Ricardo Almeida Branco
Do you use volume in your reading of the market? Certainly many traders use it, and do not imagine operating without it. The Color Histogram Volume Set indicator allows the user to choose the value that he considers interesting to monitor. When you pass this you will have visual confirmation and if you want you will also have the audible alert that is given by the indicator. Of course, there are other ways to try to find a high volume, such as assessing whether the volume is above av
Here   our more valuable tools SMC Trend Trading   ,  Easy SMC Trading  ,  Institutional SMC Architect Volume Analysis Tools  ,  Volume flow Profile  ,  Market volume profile  , FVG with Volume  , Liquidity Heatmap Profile  ,  Volume Spread Analysis 2. Key Features Dynamic Filtering : The core feature. As soon as the current price crosses a historical liquidity level, that level disappears. This reduces chart clutter and prevents you from trading off "dead" support/resistance. Liquidity Heatma
Market Footprint Indicator Market Footprint turns plain candles into a clear picture of where volume is happening and who is pushing price. It plots colored volume "bubbles" on every bar and a volume-by-price histogram on the right edge of the chart, so you can see at a glance where activity is concentrated and which side is in control. A small draggable panel with a built-in User Guide is included on the chart. This is an indicator for MetaTrader 5. It works on any symbol and any timeframe. P
VWAP Bands
Rafael Caetano Pinto
This indicator uses VWAP and projects this VWAP into up to 3 levels, shifted by a percentage of the chart's symbol. How to configure: Choose the symbol and desired graphic time Set the start time of the symbol (in bovespa, WIN and WDO start at 9 o'clock). This time is used as the cutoff reference for VWAP. Check which VWAP period fits the chart better: Ideally, a period when VWAP is not too distant from the chart Set percentage levels: Ideally, you should set levels based on history, so that le
Fakeouts
TECHAURORA - FZCO
Advanced Fakeout Detection Indicator   Professional Liquidity Sweep & Market Structure Analysis for MetaTrader 5 The Advanced Fakeout Detection Indicator is a sophisticated technical analysis tool designed to identify high-probability market reversal opportunities by detecting liquidity sweeps and structural breaks in price action. What This Indicator Does This indicator automatically identifies and visualizes potential fakeout scenarios where price temporarily breaks through significant level
AlphaPrime
Richard Horlock
AlphaPrime AlphaPrime is a discretionary market analysis indicator for MetaTrader 5 designed to provide multi time frame directional bias and structural context . It supports decision making by highlighting market structure, key levels, and higher time frame alignment. AlphaPrime does not execute trades and does not provide guaranteed signals. It is intended for traders who want a clear analytical framework rather than automated entries. Key Features • Multi time frame directional bias visualiz
Market Structure Fractals The structure layer MetaTrader 5 was missing Most traders stare at candles and draw structure manually — imprecisely, inconsistently, and always too late. You know what a fractal high and low look like. The question is whether you can spot every one, mark it cleanly, and track it the moment price breaks through. You can't. Market Structure Fractals can. MetaTrader 5 shows you price. It doesn't show you structure. That gap — between a candle pattern and a confirmed bre
FREE
Mean Volume indicator for MT5
Renaud Herve Francois Candel
Mean Volume Most indicators are based on price analysis. This indicator is based on volume. Volume is overlooked piece of information in most trading systems. And this is a big mistake since volume gives important information about market participants. Mean Volume is an indicator that can be used to spot when volume is above average. It usually means that institutional traders are active. Peak in volume can be used to confirm an entry since increased volume can sustain the move in one or anot
GRat Clusters  is an indicator that shows various data in the form of clusters on a price chart: volume, delta, ratio of sales and purchases, etc. It allows you to visually see the market profile in real time and on history at a given depth. Capabilities 1.8 types of cluster data: volume, delta, purchases   and sales , volume and delta, imbalance between sales and purchases , volume profile, delta profile, buy and sell profile. 2. A cluster period can be either any available in MT5 timeframe or
MT5용 Crypto_Forex 지표 "HTF 모멘텀" - HTF 모멘텀은 가격 변동률을 측정하는 주요 지표 중 하나입니다. HTF는 상위 시간대를 의미합니다. - 이 지표는 추세 방향을 보여주고 현재와 과거 값을 비교하여 가격 변동 속도를 측정합니다. - HTF 모멘텀 지표는 스캘핑 진입 또는 다른 지표와 함께 사용하는 다중 시간대 거래 시스템에 매우 적합합니다. - 이 지표를 사용하면 상위 시간대의 모멘텀을 현재 차트에 추가할 수 있습니다. - 모바일 및 PC 알림 기능이 내장되어 있습니다. ....................................................................... 여기를 클릭하여 고품질 트레이딩 로봇과 지표를 확인하세요! 이 제품은 MQL5 웹사이트에서만 제공되는 오리지널 제품입니다.
Normalized Volume indicator for MT5
Renaud Herve Francois Candel
Normalized Volume99% of indicators are based on price analysis. This indicator is based on volume. Volume is overlooked piece of information in most trading systems. And this is a big mistake since volume gives important information about market participants. Normalized Volume is an indicator that can be used to confirm reversal points. The indicator code volume with colors indicating high, normal and low volume. You could enhance dramatically your trading system using volume analysis.  Inputs
Boom Crash SMC
Israr Hussain Shah
Here   our more valuable tools SMC Trend Trading   ,  Easy SMC Trading  ,  Institutional SMC Architect Volume Analysis Tools  ,  Volume flow Profile  ,  Market volume profile  , FVG with Volume  , Liquidity Heatmap Profile  ,  Volume Spread Analysis Deriv boom and crash index spike killer system you can use it only on m5 timeframe  follow the structure and get signal with alert on phone open trade set sl tp and enjoy easy analysis and trading made simple 
AIO Concept SMC MT5
Robby Suhendrawan
Elevate Your Trading with the Ultimate Institutional Master System Discounted   Price   !!     Secure your lifetime access   now   before it switches to   subscription-only ! This all-in-one indicator displays real-time market algorithm.  Step into the world of institutional trading with the most comprehensive   Smart Money Concept (SMC)   and   ICT Concept   tool available on the market. Instead of cluttering your chart with multiple heavy indicators, we have engineered the core institutional t
Market Sessions + Pro Sentiment VP (Full Theme Sync Edition) The All-in-One Institutional Workspace for MetaTrader. Elevate your trading environment with a professional-grade toolkit designed for high-precision day trading. This isn't just an indicator; it’s a total chart transformation. The   Market Sessions + Pro Sentiment VP   replaces cluttered, manual setups with an automated, institutional-style dashboard. Key Features: Automatic Theme Sync:   Instantly transforms your MetaTrader interfac
SMT (Smart Money Technique) Divergence refers to the price divergence between correlated assets or their relationship to inversely correlated assets.  By analyzing SMT Divergence, traders can gain insights into the market's institutional structure and identify whether smart money is accumulating or distributing assets.  Every price fluctuation should be confirmed by market symmetry, and any price asymmetry indicates an SMT Divergence, suggesting a potential trend reversal. MT4 Version -  https:/
Volume Profile for MetaTrader 5 Price movement alone does not explain where the market is actually traded . What matters is where volume is built and how these areas shift over time. This Volume Profile displays the volume distribution directly on the chart , making it clear which price levels were accepted by the market and where rejection occurred. This allows structurally relevant zones to be identified and integrated into individual decision-making processes. The tool is designed for high pe
Blahtech VWAP MT5
Blahtech Limited
5 (1)
Was: $69  Now: $49   Blahtech VWAP - Volume Weighted Average Price (VWAP) is the ratio of price to total volume. It provides an average price over a specified time interval.  Links [  Install  |  Update  |  Documentation   ] Feature Highlights Configurable VWAP Line Sessions, intervals, anchored or continuous Previous day settlement line Standard Deviation bands Alerts at bar close or real time Automatic Broker or Tick volumes Significantly reduced CPU usage Input Parameters Expert Advisor Mo
The Super Arrow Indicator provides non-repainting buy and sell signals with exceptional accuracy. Key Features No repainting – confirmed signals remain fixed Clear visual arrows: green for buy, red for sell Real-time alerts via pop-up, sound, and optional email Clean chart view with no unnecessary clutter Works on all markets: Forex, gold, oil, indices, crypto Adjustable Parameters TimeFrame Default:   "current time frame" Function:   Sets the time frame for indicator calculation Options:   Can
Dragos Clean Execution
Dragos-cristian Craciun
5 (1)
Dragos Clean Execution is a price action execution indicator designed to simplify a high-probability intraday workflow based on liquidity sweep, market structure shift, and fair value gap confirmation. The indicator combines a higher-timeframe sweep concept with a lower-timeframe execution model to help traders identify cleaner entry locations, define invalidation clearly, and visualize realistic take-profit targets directly on the chart. Instead of flooding the chart with unnecessary objects, D
이 제품의 구매자들이 또한 구매함
Neuro Poseidon MT5
Daria Rezueva
4.79 (52)
Neuro Poseidon is a new indicator by Daria Rezueva. It combines precise trading signals with adaptive TP/SL levels - creating best possible trades as a result! Message me and get  Neuro Poseidon Assistant  as a gift to automize your trading process! What makes it stand out? 1. Proven profitability on all assets and timeframes 2. Only confirmed BUY and SELL signals present on the chart 3. Adaptive TP & SL levels generated by the software for each trade 4. Easy to understand - suitable for al
M1 Quantum MT5
Hamed Dehgani
5 (5)
개발자 안내: 현재 149달러 가격의 라이선스가 2개만 남아 있습니다. 모두 판매되면 가격은 169달러 로 인상됩니다. 개발자 안내: 구매 후 저에게 연락하시면 최신 권장 설정 파일(Set File) , 사용 팁, 그리고 다른 M1 Quantum 사용자들과 소통할 수 있는 VIP 지원 그룹 초대장을 받으실 수 있습니다. M1 Quantum 은 M1 전용 전문 트레이딩 시스템으로, 손절(Stop Loss), 익절(Take Profit), 그리고 스마트 자금 관리 기능이 내장된 빠르고 정확한 거래 신호를 제공합니다. M1 Quantum 은 연속 수익 거래 에 집중하여 계좌를 빠르게 성장시키도록 설계된 전문 자금 관리 시스템을 포함하고 있습니다. M1 Quantum 인디케이터 의 주요 기능 M1 타임프레임 및 모든 주요 통화쌍 용으로 설계됨 모든 거래에 손절과 익절 적용 자금 관리 시스템 이 포함되어 트레이더가 쉽게 거래할 수 있도록 안내 높은 승률 및 높은 연속 수익률 리페인트 없음,
Divergence Bomber
Ihor Otkydach
4.9 (92)
이 지표를 구매하신 분께는 다음과 같은 혜택이 무료로 제공됩니다: 각 거래를 자동으로 관리하고, 손절/익절 수준을 설정하며, 전략 규칙에 따라 거래를 종료하는 전용 도우미 툴 "Bomber Utility" 다양한 자산에 맞게 지표를 설정할 수 있는 셋업 파일(Set Files) "최소 위험", "균형 잡힌 위험", "관망 전략" 모드로 설정 가능한 Bomber Utility의 셋업 파일 이 전략을 빠르게 설치, 설정, 시작할 수 있도록 돕는 단계별 영상 매뉴얼 주의: 위의 모든 보너스를 받기 위해서는 MQL5 개인 메시지 시스템을 통해 판매자에게 연락해 주세요. 독창적인 커스텀 지표인 “Divergence Bomber(다이버전스 봄버)”를 소개합니다. 이 지표는 MACD 다이버전스(괴리) 전략을 기반으로 한 올인원(All-in-One) 거래 시스템입니다. 이 기술 지표의 주요 목적은 가격과 MACD 지표 간의 다이버전스를 감지하고, **향후 가격이 어느 방향으로 움직일지를 알려주는
Gem SIGNAL
Shengzu Zhong
5 (1)
GEM Signal Pro GEM Signal Pro는 MetaTrader 5용 추세추종형 지표로, 차트에서 더 명확한 신호, 더 구조적인 트레이드 설정, 그리고 더 실용적인 리스크 관리를 원하는 트레이더를 위해 설계되었습니다. 단순한 화살표만 표시하는 것이 아니라, GEM Signal Pro는 전체 트레이드 아이디어를 더 깔끔하고 읽기 쉬운 방식으로 보여줍니다. 조건이 확인되면 진입가, 손절가, 목표가를 차트에 표시하여 트레이더가 설정을 더 효율적으로 검토할 수 있도록 도와줍니다. 작동 방식 이 지표는 먼저 내부 로직에 따라 유효한 초기 신호를 식별합니다. 확인 조건이 충족되면, GEM Signal Pro는 차트에 전체 설정을 표시합니다. 이를 통해 트레이더는 거래 구조를 더 명확하게 보고, 수동 분석 작업을 줄일 수 있습니다. 차트에 표시되는 거래 레벨 확인된 신호에 대해, GEM Signal Pro는 다음을 표시할 수 있습니다. 진입가 손절가 목표가 1 목표가 2 목표가 3 손
UZFX {SSS} 스캘핑 스마트 시그널 v4.0 MT5는 급변하는 시장에서 정확한 실시간 시그널을 필요로 하는 스캘퍼, 데이 트레이더, 스윙 트레이더를 위해 설계된 리페인팅이 없는 고성능 트레이딩 지표입니다. (UZFX-LABS)에서 개발한 이 지표는 가격 움직임 분석, 추세 확인 및 스마트 필터링을 결합하여 모든 통화 쌍과 시간대에서 높은 확률의 매수 및 매도 신호, 경고 신호, 추세 지속 기회를 생성합니다. 거래에 대한 의구심을 떨쳐버리고, 명확성, 정밀성, 그리고 규율 있는 시장 실행을 원하는 트레이더를 위해 설계된 체계적인 신호 시스템을 따르기 시작하세요. 제 추천* 최적의 시간대: 15분 이상. {H1}이 제가 가장 선호하는 시간대입니다. 그리고 그 결과는 정말 놀라울 정도입니다...!! 주요 기능 업데이트 • 자동 매수 및 매도 신호 감지 • 고급 반전 인식 로직 • 잠재적인 시장 반전 전 조기 경고 신호 • 추세 지속 확인 신호 • 진입, 손절, TP1, TP2,
소개       Quantum Breakout PRO   , 브레이크아웃 존 거래 방식을 변화시키는 획기적인 MQL5 지표! 13년 이상의 거래 경험을 가진 숙련된 트레이더 팀이 개발한       퀀텀 브레이크아웃 PRO       혁신적이고 역동적인 브레이크아웃 존 전략으로 거래 여정을 새로운 차원으로 끌어올리도록 설계되었습니다. Quantum Breakout Indicator는 5개의 이익 목표 영역이 있는 브레이크아웃 영역의 신호 화살표와 브레이크아웃 상자를 기반으로 한 손절 제안을 제공합니다. 초보자 거래자와 전문 거래자 모두에게 적합합니다. Quantum EA 채널:       여기를 클릭하세요 중요한! 구매 후 설치 매뉴얼을 받으려면 개인 메시지를 보내주십시오. 추천: 기간: M15 통화쌍: GBPJPY, EURJPY, USDJPY,NZDUSD, XAUUSD 계정 유형: 스프레드가 매우 낮은 ECN, Raw 또는 Razor 브로커 시간: GMT +3 중개인 :
Transaction Speed MT5
Ivan Stefanov
5 (3)
이 지표는 시장에서 관심이 나타나는 영역 을 강조 표시한 후, 주문이 누적되는 영역 을 보여줍니다. 이는 **대규모 오더북(호가창)**처럼 작동합니다. 이것은 거대한 자금 을 위한 인디케이터입니다. 성능은 탁월하며, 시장에서 어떤 관심이 있든 반드시 포착할 수 있습니다 . (이것은 완전히 새로 작성되고 자동화된 버전 입니다 – 이제 수동 분석은 필요하지 않습니다.) **거래 속도(Transaction Speed)**는 새로운 개념의 인디케이터로, 시장에 대규모 주문이 언제, 어디에 쌓이는지를 보여주며 , 그 이점을 분석합니다. 매우 초기 단계에서 트렌드 전환 을 감지할 수 있습니다. FX 시장에서 흔히 사용하는 "거래량(volume)"은 오해입니다. 실제로는 시간당 가격 변화량 이므로, 올바른 용어는 거래 속도 입니다. 우리가 어떻게 사고하고, 행동하며, 분석하느냐 가 가장 중요합니다. 분석 패러다임의 전환 은 필수적입니다. 이 인디케이터는 외환 시장에서의 볼륨 개념을 논리적으로
Quantum TrendPulse
Bogdan Ion Puscasu
5 (25)
SuperTrend   ,   RSI   ,   Stochastic   의 힘을 하나의 포괄적인 지표로 결합하여 트레이딩 잠재력을 극대화하는 궁극의 트레이딩 도구   인 Quantum TrendPulse를   소개합니다. 정밀성과 효율성을 추구하는 트레이더를 위해 설계된 이 지표는 시장 추세, 모멘텀 변화, 최적의 진입 및 종료 지점을 자신 있게 식별하는 데 도움이 됩니다. 주요 특징: SuperTrend 통합:   주요 시장 추세를 쉽게 따라가고 수익성의 물결을 타세요. RSI 정밀도:   매수 과다 및 매도 과다 수준을 감지하여 시장 반전 시점을 파악하는 데 적합하며 SuperTrend 필터로 사용 가능 확률적 정확도:   변동성이 큰 시장에서 숨겨진 기회를 찾기 위해 확률적 진동   을 활용하고 SuperTrend의 필터로 사용 다중 시간대 분석:   M5부터 H1 또는 H4까지 다양한 시간대에 걸쳐 시장을 최신 상태로 유지하세요. 맞춤형 알림:   맞춤형 거래 조건이 충족되면
ARIPoint
Temirlan Kdyrkhan
1 (1)
ARIPoint is a powerful trading companion designed to generate high-probability entry signals with dynamic TP/SL/DP levels based on volatility. Built-in performance tracking shows win/loss stats, PP1/PP2 hits, and success rates all updated live. Key Features: Buy/Sell signals with adaptive volatility bands Real-time TP/SL/DP levels based on ATR Built-in MA Filter with optional ATR/StdDev volatility Performance stats panel (Success, Profit/Loss, PP1/PP2) Alerts via popup, sound, push, or email Cu
Btmm state engine pro
Garry James Goodchild
5 (5)
BTMM State Engine Pro is a MetaTrader 5 indicator for traders who use the Beat The Market Maker approach: Asian session context, kill zone timing, level progression, peak formation detection, and a multi-pair scanner from a single chart. It combines cycle state logic with a built-in scanner dashboard so you do not need the same tool on many charts at once. What it does Draws the Asian session range; session times can follow broker server offset or be set in inputs. Tracks level progression (L
Current event:  https://c.mql5.com/1/326/A2SR2025_NoMusic.gif MT5용 A2SR 지표: 자동화된 실제 수요 및 공급(S/R). + 거래 상품. Product description in English here. --   Guidance   : -- at   https://www.mql5.com/en/blogs/post/734748/page4#comment_16532516 -- and  https://www.mql5.com/en/users/yohana/blog 더욱 스마트한 거래 결정을 위한 강력하고, 정확하며, 시간 절약적인 기능 + EA 호환 객체. 주요 장점 선행 실제 SR 레벨(지연 또는 재표시 없음) 2014년부터 MT4 에서 수년간 입증된 신뢰성을 바탕으로 A2SR이 이제 MetaTrader 5에서도 사용 가능합니다. 가격이 도달하기 전에 실제 지지선과 저항선을 식별하는 선행적이고 재표시 없는 지표를 통해 트레이더에
Azimuth Pro
Ottaviano De Cicco
5 (7)
Azimuth Pro V2: Synthetic Fractal Structure and Confirmed Entries for MT5 Overview Azimuth Pro is a multi-level swing structure indicator by Merkava Labs . Four nested swing layers, swing-anchored VWAP, ABC pattern detection, three-timeframe structural filtering, and closed-bar confirmed entries — one chart, one workflow from micro-swings to macro-cycles. This is not a blind signal product. It is a structure-first workflow for traders who care about location, context, and timing. ️ Summer Sale
Quant Direction MT5
Georgios Kalomoiropoulos
Quant Direction 은 3D 시장 분석 도구입니다. 다양한 매개변수에 걸쳐 정확한 백분율 편차를 계산하면서 완벽하게 객관적인 알고리즘 기반 시장 분석을 제공합니다. 첨단 AI 기반 모델링 도구와 엄격한 테스트를 거쳐 개발된 이 알고리즘은 타의 추종을 불허하는 정확도로 시장을 분석합니다. 플랫폼에서 모든 통화쌍 또는 금융 상품을 분석할 수 있습니다. 단기 거래, 데이 트레이딩, 스윙 트레이딩 등 어떤 유형의 거래를 하든 Quant Direction은 최적의 선택입니다. 운영자가 되는 것의 진정한 이점 퀀트 디렉션의 진정한 장점은 감정, 눈의 피로, 과도한 분석을 완전히 배제한다는 점입니다. 더 이상 수십 개의 차트를 일일이 살펴보며 방향을 찾거나 자신의 판단에 끊임없이 의문을 품을 필요가 없습니다. 이 시스템은 8개의 시간 간격(5개월에서 수개월까지)을 밀리초 단위로 처리합니다. 특정 시점의 주요 시장 참여자를 정확하게 식별하여 항상 성공 확률이 가장 높은 방향으로 거래할
KURAMA GOLD SIGNAL PRO (MT5) — 7중 필터 · 자동 TP/SL · 품질 점수 · 시그널 기록 저장 | XAUUSD 완전 트레이딩 시스템 실시간 리페인트 없음. 시그널이 나타나는 순간 화살표, 진입, TP, SL이 그 자리에 고정되어 이후 절대 움직이지 않습니다. 여러분이 거래하는 것은 바로 이 실시간 시그널입니다. 그리고 v7.20에서는 실제로 발신된 모든 시그널이 자동 저장되어 재시작 후에도 정확히 복원됩니다. 구매자 전용 보너스 평생 라이선스를 구매하시면 AI Zone Radar($59 상당) + 완전 PDF 매뉴얼을 무료로 드립니다. 제품 가격에 더해 $59 상당의 보너스가 따라옵니다. 구매 후 MQL5로 메시지를 보내주세요. AI Zone Radar: https://www.mql5.com/en/market/product/175834 골드 트레이더 커뮤니티에서 실제로 사용되며 정확성과
The Oracle Pro
Ottaviano De Cicco
The Oracle Pro: Synthetic Multi-Timeframe Bias Engine for MT5 ️ Summer Launch Offer — Get The Oracle Pro for USD 199 (early buyers). Price rises with traction; final price USD 399. The Oracle Pro is a premium multi-timeframe bias engine for MetaTrader 5, built for demanding and professional traders. It answers one question with discipline: what is the directional bias on each timeframe right now, how strong is it, and how much do the timeframes agree? Everything is computed on closed bars only
ACB Breakout Arrows MT5
KEENBASE SOFTWARE SOLUTIONS
3.5 (2)
ACB Breakout Arrows 지표는 특별한 돌파 패턴을 감지하여 시장에서 중요한 진입 신호를 제공합니다. 이 지표는 차트를 지속적으로 스캔하면서 한 방향으로 움직임이 자리 잡을 때를 포착하여 큰 움직임 직전에 정확한 진입 신호를 제공합니다. 다중 종목 및 다중 시간대 스캐너는 여기에서 확인하세요 - ACB Breakout Arrows MT5용 스캐너 핵심 기능 지표가 자동으로 손절(Stop Loss) 및 익절(Take Profit) 수준을 제공합니다. 모든 시간대의 돌파 신호를 추적하는 MTF 스캐너 대시보드 포함. 데이 트레이더, 스윙 트레이더 및 스캘퍼에게 적합합니다. 신호 정확도를 높이기 위해 최적화된 알고리즘 사용. 손익분기점 또는 빠른 수익 목표를 위한 특별한 라인 (Quick Profit Line) 제공. 승률, 성공 비율, 평균 수익 등의 성과 분석 지표 제공. 재도색 없음. 신호는 고정되어 신뢰할 수 있습니다. 거래 확인 - ACB Trade Filter 지
This indicator automatically detects internal & swing market structure, Fibonacci Retracement and Fibo Levels. Features Full internal & swing market structure labeling in real-time Fibonacci Retracement Fibonacci Levels After purchasing the indicator, the full source code is provided, and via indicator buffers it can be easily integrated into your Expert Advisors (EAs) for automated trading strategies.
이 제품은 2026년 시장에 맞게 업데이트되었으며 최신 MT5 빌드에 최적화되었습니다. 가격 업데이트 안내: Smart Price Action Concepts는 현재 $200 에 제공됩니다. 다음 30회 구매 후 가격은 $299 로 인상됩니다. 특별 혜택: 구매 후 저에게 개인 메시지를 보내시면 무료 보너스 + 선물 을 받을 수 있습니다. 먼저, 이 트레이딩 도구는 리페인트 없음, 재그리기 없음, 지연 없음의 인디케이터이므로 전문적인 트레이딩에 적합하다는 점을 강조하고 싶습니다. Online course , and manual Smart Price Action Concepts Indicator는 초보자와 경험 많은 트레이더 모두에게 매우 강력한 도구입니다. 20개 이상의 유용한 인디케이터를 하나로 결합하고, Inner Circle Trader Analysis와 Smart Money Concepts Trading Strategies 같은 고급 트레이딩 아이디어를 통합합니다. 이 인디
Trend Forecaster
Alexey Minkov
5 (8)
Trend Forecaster is a MetaTrader 5 indicator that combines breakout signals, possible reversal area analysis, market range data and a visual statistics panel in one chart workspace. It shows Buy and Sell signals, tracks Average Range and Current Range, and can automatically adjust Sensitivity for the current symbol and timeframe. Manual Sensitivity control is also available. The indicator can be used on Forex pairs, metals, stocks, indices and cryptocurrencies. Different timeframes are supported
Entry Points Pro for MT5
Yury Orlov
4.48 (140)
다시 색을 칠하지 않고 거래에 진입할 수 있는 정확한 신호를 제공하는 MT5용 지표입니다. 외환, 암호화폐, 금속, 주식, 지수 등 모든 금융 자산에 적용할 수 있습니다. 매우 정확한 추정값을 제공하고 매수와 매도의 가장 좋은 시점을 알려줍니다. 하나의 시그널로 수익을 내는 지표의 예와 함께 비디오 (6:22)시청하십시오! 대부분의 거래자는 Entry Points Pro 지표의 도움으로 첫 거래 주 동안 트레이딩 결과를 개선합니다. 저희의   Telegram Group 을 구독하세요! Entry Points Pro 지표의 좋은점. 재도색이 없는 진입 신호 신호가 나타나고 확인되면(시그널 캔들이 완성된 경우) 신호는 더 이상 사라지지 않습니다. 여타 보조지표의 경우 신호를 표시한 다음 제거되기 때문에 큰 재정적 손실로 이어집니다. 오류 없는 거래 게시 알고리즘을 통해 트레이드(진입 또는 청산)를 할 이상적인 순간을 찾을 수 있으며, 이를 통해 이를 사용하는 모든 거래자의 성공률이
RelicusRoad Pro MT5
Relicus LLC
4.96 (24)
RelicusRoad Pro: 퀀트 시장 운영 체제 70% 할인 평생 이용권 (한정 시간) - 2,000명 이상의 트레이더와 함께하세요 왜 대부분의 트레이더는 "완벽한" 지표를 가지고도 실패할까요? 진공 상태에서 단일 개념 만으로 거래하기 때문입니다. 문맥 없는 신호는 도박입니다. 지속적인 승리를 위해서는 컨플루언스(중첩) 가 필요합니다. RelicusRoad Pro는 단순한 화살표 지표가 아닙니다. 완전한 퀀트 시장 생태계 입니다. 독점적인 변동성 모델링을 사용하여 가격이 이동하는 "공정 가치 로드"를 매핑하고, 단순 노이즈와 실제 구조적 돌파를 구분합니다. 추측은 그만두세요. 기관급 로드 로직으로 거래를 시작하세요. 핵심 엔진: "Road" 알고리즘 시스템의 중심에는 시장 상황에 실시간으로 적응하는 동적 변동성 채널인 Road Algo 가 있습니다. 세이프 라인(평형) 과 가격이 수학적으로 반전될 가능성이 높은 확장 레벨 을 투영합니다. Simple Road: 일반적인 시장을 위
Precision Spike Detector
Francisco Mandomo Simbine
5 (1)
Precision Spike Detector V3 – Institutional-Grade AI Trading System Attention: The price increases by US$50 for every 10 purchases.  Final price: US$599 Precision Spike Detector V3   is a   state-of-the-art, institutional-grade market analysis system   for   MetaTrader 5 , designed to detect   high-probability market movements   in synthetic indices such as   Boom, Crash, GainX, and PainX . After purchase, please contact me through the MQL5 messaging system to receive the order management tool
Grabber System MT5
Ihor Otkydach
4.83 (24)
탁월한 기술적 지표인 Grabber를 소개합니다. 이 도구는 즉시 사용 가능한 “올인원(All-Inclusive)” 트레이딩 전략으로 작동합니다. 하나의 코드 안에 강력한 시장 기술 분석 도구, 매매 신호(화살표), 알림 기능, 푸시 알림이 통합되어 있습니다. 이 인디케이터를 구매하신 모든 분들께는 다음의 항목이 무료로 제공됩니다: Grabber 유틸리티: 오픈 포지션을 자동으로 관리하는 도구 단계별 영상 매뉴얼: 설치, 설정, 그리고 실제 거래 방법을 안내 맞춤형 세트 파일: 인디케이터를 빠르게 자동 설정하여 최고의 성과를 낼 수 있도록 도와줍니다 다른 전략은 이제 잊어버리세요! Grabber만이 여러분을 새로운 트레이딩의 정점으로 이끌어 줄 수 있습니다. Grabber 전략의 주요 특징: 거래 시간 프레임: M5부터 H4까지 거래 가능한 자산: 어떤 자산이든 사용 가능하지만, 제가 직접 테스트한 종목들을 추천드립니다 (GBPUSD, GBPCAD, GBPCHF, AUDCAD, AU
Backtesting Simulator MT5
Diego Arribas Lopez
4 (1)
[ MT4 Version ] Are you tired of spending months on demo or live accounts to test your trading strategies? The Backtesting Simulator is the ultimate tool designed to elevate your backtesting experience to new heights. Utilizing Metatrader historical symbol information, it offers an unparalleled simulation of real market conditions. Take control of your testing speed, test ideas quickly or at a slower pace, and witness remarkable improvements in your testing performance. Forget about wasting tim
PrimeScalping
Temirlan Kdyrkhan
PrimeScalping is a powerful trading companion designed to generate high-probability entry signals with dynamic TP/SL/DP levels based on volatility. Built-in performance tracking shows win/loss stats, PP1/PP2 hits, and success rates — all updated live. Key Features: Buy/Sell signals with adaptive volatility bands Real-time TP/SL/DP levels based on ATR Built-in MA Filter with optional ATR/StdDev volatility Performance stats panel (Success, Profit/Loss, PP1/PP2) Alerts via popup, sound, push, or e
[Currently Gaining High Popularity!] Visibility significantly improved in the latest update! QUASAR Prism MT5 - Advanced Multi-Timeframe Pattern Scanner "Deconstruct the complex light of the market to visualize precise entry points." QUASAR Prism is a dedicated MT5 multi-timeframe consensus pattern scanner equipped with a proprietary N-Pattern analysis engine. It simultaneously analyzes market wavelengths from M1 to D1 via MTF. Complex analysis is completed simply by a "change of color." 5 Re
Meravith MT5
Ivan Stefanov
5 (1)
마켓 메이커를 위한 도구. Meravith는 다음과 같은 기능을 제공합니다: 모든 타임프레임을 분석하고 현재 유효한 추세를 표시합니다. 강세와 약세 거래량이 동일한 유동성 구간(거래량 균형 구간)을 강조 표시합니다. 서로 다른 타임프레임의 모든 유동성 레벨을 차트에 직접 표시합니다. 텍스트 기반 시장 분석을 생성하여 참고용으로 제공합니다. 현재 추세를 기반으로 목표가, 지지선 및 손절가를 계산합니다. 거래의 위험 대비 보상 비율(Risk/Reward)을 계산합니다. 계좌 잔고에 따라 포지션 크기를 산출하고 잠재 수익을 추정합니다. 시장에 중대한 변화가 발생할 경우 경고도 제공합니다. 지표의 주요 라인: 강세/약세 거래량 소진 라인 — 목표가로 사용됩니다. 시장 추세를 나타내는 라인. 시장이 강세인지 약세인지에 따라 색상이 변경되며 추세 지지선 역할을 합니다. 색상은 주로 시장 심리를 보여줍니다. 거래량 균형선(Eq). Eq(Volume Equilibrium) 라인은 시스템의 핵심입니
What Is It? This PVSRA Screener is for real-time market analysis. so instead of manually checking charts one by one, you get a live command center that tells you the market phase, volume intent, trend state, and nearest price structure all in one glance. Features at a Glance Multi-pair, multi-timeframe scanner dashboard... monitors everything at once PVA (Price Volume Analysis)... detects Climax and Rising volume candles in real time The Dragon EMA... configurable trend anchor (default 50 EMA of
Royal Wave Pro M5
Vahidreza Heidar Gholami
3.5 (4)
Royal Wave is a Trend-Power oscillator which has been programmed to locate and signal low-risk entry and exit zones. Its core algorithm statistically analyzes the market and generates trading signals for overbought, oversold and low volatile areas. By using a well-designed alerting system, this indicator makes it easier to make proper decisions regarding where to enter and where to exit trades. Features Trend-Power Algorithm Low risk Entry Zones and Exit Zones Predictions for Overbought and Over
Berma Bands
Muhammad Elbermawi
5 (8)
Berma Bands(BBs) 지표는 시장 동향을 파악하고 이를 활용하려는 트레이더에게 귀중한 도구입니다. 가격과 BBs 간의 관계를 분석함으로써 트레이더는 시장이 추세 단계인지 범위 단계인지를 분별할 수 있습니다. 자세한 내용을 알아보려면 [ Berma Home Blog ]를 방문하세요. 버마 밴드는 세 개의 뚜렷한 선으로 구성되어 있습니다. 어퍼 버마 밴드, 미들 버마 밴드, 로어 버마 밴드입니다. 이 선들은 가격 주위에 그려져 전체 추세에 대한 가격 움직임을 시각적으로 표현합니다. 이 밴드들 사이의 거리는 변동성과 잠재적인 추세 반전에 대한 통찰력을 제공할 수 있습니다. 버마 밴드 라인이 각각에서 분리될 때, 그것은 종종 시장이 횡보 또는 범위 이동 기간에 접어들고 있음을 시사합니다. 이는 명확한 방향 편향이 없음을 나타냅니다. 트레이더는 이러한 기간 동안 추세를 파악하기 어려울 수 있으며 더 명확한 추세가 나타날 때까지 기다릴 수 있습니다. 버마 밴드 라인이 단일 라인으로
제작자의 제품 더 보기
Ось відформатований текст без альтернативних назв у дужках: Latency Edge Scalpel Latency Edge Scalpel is a high-frequency, institutional-grade trading solution engineered for high-precision scalping in the decentralized Forex market. This is not a simple grid or martingale bot; it is a sophisticated mathematical tool designed to exploit micro-structural price gaps and momentary volatility imbalances. The Algorithmic Core At its heart, Latency Edge Scalpel operates on a hybrid volatility-filterin
Vector Horizon is an advanced analytical tool designed for mathematical modeling of the probable price trajectory over a specified number of bars ahead. The indicator generates a projection line representing simulated future price values derived from rigorous historical data analysis. This technical insight serves as a supplemental guide for identifying potential trend exhaustion zones, optimizing market entry/exit points, and fine-tuning stop-loss adjustments for active positions. Input Paramet
The Compare Graphs indicator is an analysis tool that allows traders to compare two or more graphs on the same chart window. This indicator is commonly used in trading platforms such as MetaTrader and provides a clearer comparison of different financial instruments or time frames. Functions of the Compare Graphs indicator may include: Selecting Charts: The trader can select the charts he wants to compare, such as price charts of different currency pairs or indicators on the same chart. Setting
The   Angle Prices   indicator is a tool that calculates the price angle based on price analysis, interpreting the time vector in the form of price points on the price chart. In other words, the X axis and Y axis are represented as price points, so you can actually calculate the angle with two axes of the same dimension. This allows traders to obtain information about the direction of price movement and possible entry or exit points for trades. Let's look at the main characteristics and interpr
The " Fortune Long " bot works using pending orders and reacts to a channel breakdown with the direction of work in the channel; it is necessary to correctly calculate the levels of entry, stop loss, take profit, and the level of deviation of the pending order from the price. The bot needs to be optimized for 2 years with a forward period of 1/2. Once optimization is complete, select the best settings and save them. Work for 6 months. The bot automatically calculates all levels and the entry le
In the world of trading, one of the main concerns is finding a reliable trading system. Meet the TrendEdge Channel indicator - your reliable companion in this search. Developed based on complex mathematical calculations, this indicator predicts the most likely short-term price movements. TrendEdge Channel is designed specifically to identify trends in price movements. Thanks to it, you can quickly determine not only the direction of the trend, but also the levels of interaction between buyers
With the growth of information technology and the increasing number of participants in financial markets, traditional analysis tools are becoming less effective. Conventional technical indicators, such as the moving average or stochastic, in their pure form are unable to accurately determine the direction of the trend or its reversal. Is it possible to find an indicator that remains effective for 14 years without changing its parameters, and at the same time adapts to market changes? Yes, such
Misio
Sabina Fik
Misio - can be used as an independent trading system. The indicator determines the market trend, ignoring sharp fluctuations and noise around the average price. It displays the trending movement with potential stop points. Simple, clear and effective use. The indicator does not redraw and does not lag. Suitable for all currency pairs and all timeframes. Interpretation: The location of the rate above or below the shadows indicates the presence of a trend. A move into the shadows signals a pos
Trend Divergence Indicator: Your Essential Tool for Market Analysis The Trend Divergence Indicator is a powerful tool designed to assist traders in identifying market trends and pinpointing entry points with precision. By leveraging price divergence, this indicator enhances your trading strategy, offering reliable insights and filtering unnecessary signals. Key Features and Benefits of the Trend Divergence Indicator Accurate Trend Analysis: The Trend Divergence Indicator uses price divergence t
BioStars
Sabina Fik
The "BioStar" indicator is an innovative tool for trend analysis on the Forex market. It has unique capabilities and a wide range of settings that will help traders make informed decisions when trading. This indicator is based on the analysis of the market trend and helps to identify the direction of price movement. It uses various mathematical algorithms and statistical methods to determine the strength and stability of the trend in the market. One of the key features of the "BioStar" indica
Core Drift Index: Your Reliable Guide in the World of Trading Core Drift Index is an innovative trend indicator designed for precise detection of market directions and reversal points . This powerful tool enables traders to optimize their investments , minimize risk, and maximize profit. Key Features and Benefits Intuitive Trend Detection Core Drift Index clearly shows trend direction, helping traders make timely entry and exit decisions. High Probability of Success With its high accuracy
Warp Range Sensor: The Color of Your Trend Warp Range Sensor is a trend direction indicator that visually displays the current market condition by coloring bars red and blue based on trend direction. What Does Warp Range Sensor Do? Identifies the Current Trend Direction Blue bars indicate an uptrend Red bars signal a downtrend Universal Application Compatible with all currency pairs and timeframes , from short-term scalping to long-term trading. Powered by Market Context & Historical Data W
Pointer Trend Switch — precision trend reversal indicator Pointer Trend Switch is a high-precision arrow indicator designed to detect key moments of trend reversal based on asymmetric price behavior within a selected range of bars. It identifies localized price impulses by analyzing how far price deviates from the opening level, helping traders find accurate entry points before a trend visibly shifts. This indicator is ideal for scalping, intraday strategies, and swing trading, and performs equa
TrendCore Adaptive FX — Smart Expert Advisor for Confident and Adaptive Forex Trading TrendCore Adaptive FX   is a powerful, fully automated trading robot designed for consistent performance in the Forex market. It combines trend-based technical analysis, adaptive lot management, and solid capital protection strategies to ensure robust and efficient trading under real market conditions. Whether you're a professional trader or a long-term investor, this EA offers an intelligent solution to a
FlexiTrade Bot: Trade Smart, Not Blind Ditch the guesswork.   FlexiTrade Bot   is more than just a trading tool — it’s an intelligent trading engine built for traders who value   speed, precision, and adaptability . With real-time market analysis and pattern recognition, FlexiTrade delivers actionable signals with razor-sharp accuracy so you can focus on results, not reaction.   What Sets FlexiTrade Apart? Market Structure Awareness Unlike bots that rely on rigid indicator rules,   FlexiTr
AlphaTrader: Your Intelligent Partner in Forex Trading AlphaTrader   is an advanced trading system that utilizes automated analysis and trading strategies to optimize decision-making in the Forex market. Built using geometric patterns and cutting-edge algorithms, this bot detects pricing patterns, providing precise signals for successful trades.   Why Choose AlphaTrader? AlphaTrader is not just a trading bot; it’s a   full-fledged partner   designed to help you manage your capital as efficien
Acceleration Bias — Price Acceleration Impulse Indicator Acceleration Bias   is a modern analytical tool designed to measure changes in price acceleration and visualize impulse asymmetry using a robust mathematical model. This indicator is intended for traders working with market volatility, impulse phases, and price-movement structure, as well as those who need algorithmic, rule-based analytical support. Purpose and Core Concept Unlike traditional oscillators that analyze only velocity changes
Structural Equilibrium: A New Era of Adaptive Market Analysis As information technology advances and market participation grows, traditional analytical tools often face declining efficiency. Standard technical indicators frequently struggle to interpret the complexities of modern, algorithm-driven market structures. Structural Equilibrium was developed as a high-performance solution featuring a multi-level adaptive smoothing mechanism. This core logic allows the tool to maintain its analytical r
Phase Analytics Pro: Advanced Cyclic Market Analyzer Phase Analytics Pro is a sophisticated technical tool designed for traders who prioritize mathematical precision over lag-heavy traditional indicators. Based on the principles of digital signal processing, this indicator decomposes price action into phase and quadrature components to identify the dominant market cycle. How it works: The algorithm calculates the instantaneous phase of the market, allowing it to distinguish between trending and
Sub Algo4
Sabina Fik
Sub Algo is a revolutionary indicator for MQL4/MQL5 that transforms how algorithmic strategies are built and executed. Instead of writing endless if–else conditions, Sub Algo provides a complete visual configuration system with: 6 independent logical operations Adaptive thresholding Automatic Buy/Sell symmetry Simple dropdown menus and input parameters This is not a library . This is a ready-to-use professional indicator that converts any combination of technical indicators into precise logical
Orynth 4
Sabina Fik
Orynth P&F Chart Overlay – Clean Trend Visualizer Orynth is a professional technical analysis tool that brings the power of Point and Figure (P&F) charting directly onto your standard candlestick chart. It filters out market noise by focusing solely on meaningful price movement, allowing traders to identify clear trends and reversals without the distraction of minor fluctuations. Unlike traditional P&F charts that open in a separate window, Orynth overlays price "boxes" directly on your main cha
The Plasma Trend indicator is a simple technical indication that is used to determine the current trend direction in the market. The Plasma Trend indicator is a powerful tool for determining the direction of the trend in the Forex market. It is based on both standard technical indicators and proprietary mathematical calculations, which provides a more accurate and reliable trend determination. Its implementation in the form of lines of two colors simplifies the visual determination of a change
Cryo
Sabina Fik
5 (1)
Cryo is based on the process of identifying the rate of change in price growth and allows you to find entry and exit points from the market. A fundamental technical indicator that allows you to assess the current market situation in order to enter the market of the selected currency pair in a trend and with minimal risk. The Cryo indicator was created on the basis of the original indicators for searching for extremes, the indicator is well suited for determining a reversal or a large sharp jer
The Angle Prices indicator is a tool that calculates the price angle based on price analysis, interpreting the time vector in the form of price points on the price chart. In other words, the X axis and Y axis are represented as price points, so you can actually calculate the angle with two axes of the same dimension. This allows traders to obtain information about the direction of price movement and possible entry or exit points for trades. Let's look at the main characteristics and interpretat
The " Fortune Long " bot works using pending orders and reacts to a channel breakdown with the direction of work in the channel; it is necessary to correctly calculate the levels of entry, stop loss, take profit, and the level of deviation of the pending order from the price. The bot needs to be optimized for 2 years with a forward period of 1/2. Once optimization is complete, select the best settings and save them. Work for 6 months. The bot automatically calculates all levels and the entry le
PricePulse Pro - Indicator of Simple Solutions! Using this indicator is very easy - just follow the colored arrows on the chart. The indicator algorithm takes into account daily price fluctuations and focuses on measuring the "candlestick" share in the trend. This indicator uses an algorithm that considers price changes based on various parameters such as H/C (high price/close), H/O (high price/open), LC (low price/close), LO (low price/open). This allows for a more detailed analysis of price
The "Trend Orbital" indicator is a tool for tracking trends in the financial asset market. It is based on the analysis of price data and provides a visual interpretation of the current direction of price movement. Options: InpAmplitude: Amplitude - determines the amount of volatility that the indicator takes into account when determining the trend. Group "Arrow": InpCodeUpArrow: Up Arrow Code - Defines the arrow symbol to display an uptrend. InpCodeDnArrow: Down Arrow Code - Defines the arrow
The Market Might indicator, despite its apparent simplicity, is based on complex analytical algorithms that allow you to accurately determine the moments of entry and exit from transactions. The signals generated by this indicator are accurate and timely, appearing directly on the current candle. The main task of the Market Might indicator is to determine the moments of entry and exit from trades. Therefore, it displays only the trend line and entry points, which provides a clear view of the m
This technical analysis indicator allows you to determine with high probability whether a trend or a flat pattern prevails in the market. It can be used both for trading within a channel and for breakout trading, provided that stop losses are used to protect against false signals. The indicator displays the channel in the form of lines located above and below the price, like other similar indicators. The upper and lower lines can also act as resistance and support levels. It quite accurately
Determining the current market trend is a key task for successful trading. It is for this purpose that the Book Scheme indicator was developed, which is an advanced algorithm for visually displaying a trend on a chart. Many traders dreamed of having reliable moving averages that kept up with the market. It was this dream that I turned into reality with the help of my indicator. Book Scheme allows you to predict future values ​​and create accurate signals for entering and exiting the market. T
필터:
리뷰 없음
리뷰 답변