Book Scheme

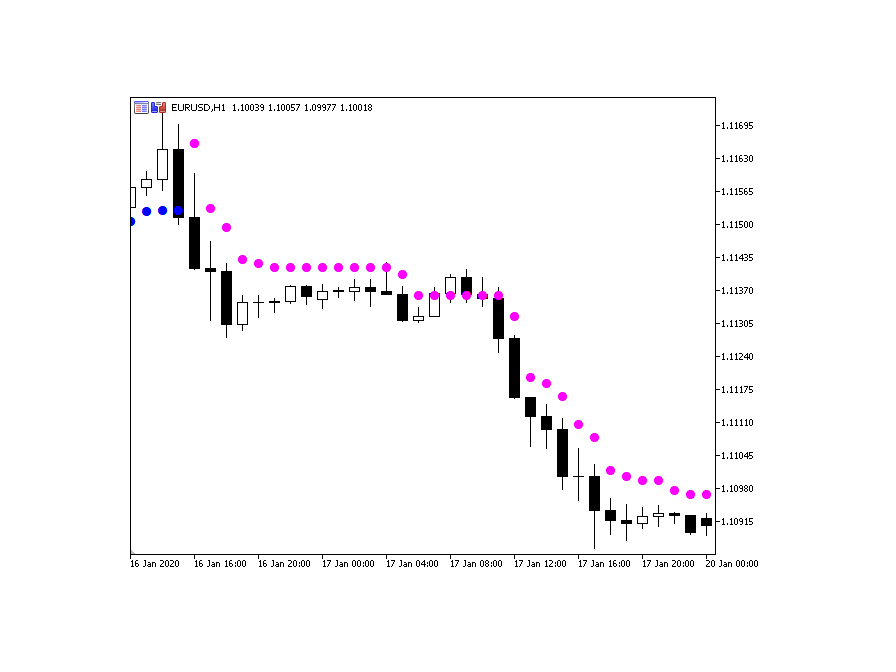
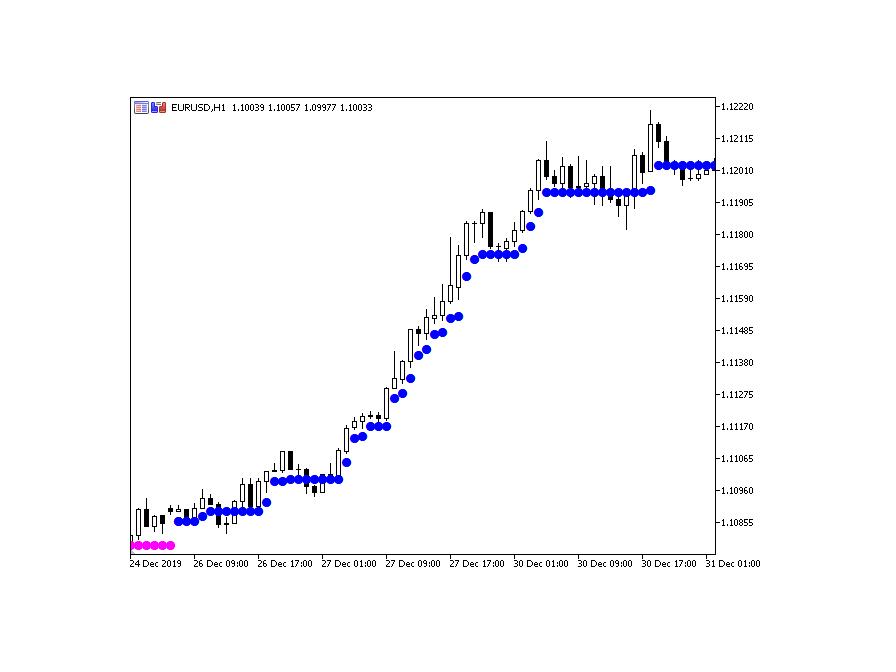
Determining the current market trend is a key task for successful trading. It is for this purpose that the Book Scheme indicator was developed, which is an advanced algorithm for visually displaying a trend on a chart.

Many traders dreamed of having reliable moving averages that kept up with the market. It was this dream that I turned into reality with the help of my indicator. Book Scheme allows you to predict future values ​​and create accurate signals for entering and exiting the market.

This indicator is designed to identify both long-term trends and short-term buy and sell signals. Its main task is to provide an accurate assessment of the current state of the market. Be it any time frame or currency pair, the Book Scheme indicator will reliably protect your position and help you make informed trading decisions.
추천 제품
SMC Structure Markup
Seyed Mohammad Hosseini Hejazi
4.67 (15)
Overview The Smart Money Structure Markup Indicator for MetaTrader 5 is a powerful tool designed to help traders identify key market structures based on popular Smart Money Concepts (SMC) strategies. This indicator detects micro-market structures, providing insights into price movements and potential trend changes. It highlights important elements such as valid Break of Structure (BOS), Change of Character (CHoCH), and Inducement (IDM), helping traders to make informed decisions. Key Features Ma
FREE
Dynamic SR and Trendline Indicator
Adebowale Adeniyi Adeleke
5 (1)
The MTF Support/Resistance & Trendline Analyzer is a powerful multi-timeframe indicator that automatically detects key support and resistance levels , draws dynamic trendlines , and provides a real-time market structure dashboard — all in one clean, lightweight display. It combines fractal logic and price action detection across three timeframes to give you a unified view of market direction and structure. Whether you trade reversals, breakouts, or trends, this tool highlights the zones that mat
FREE
Indicator Description Range Filter Pro is a sophisticated trading tool for XAUUSD (Gold) that combines adaptive price filtering with volume analysis and real-time market monitoring. Designed for both novice and professional traders, this indicator helps identify trend direction, potential reversals, and significant market movements through its multi-layered approach. Key Components 1.Dynamic Range Filter 2.Volatility-Adjusted Bands 3.Volume-Enhanced Candles 4.Professional Trading Dashboard 5.M
FREE
عنوان: محلل الدعم والمقاومة الذكي وصف مختصر: يقوم بتحديد مستويات الدعم والمقاومة الرئيسية بشكل ديناميكي، مع تسليط الضوء على نقاط المحور الحاسمة وأعلى الارتفاعات وأدنى الانخفاضات لاتخاذ قرارات تداول دقيقة. الوصف الكامل: أطلق العنان لقوة تحليل السوق الديناميكي مع SmartSRAnalyzerR! يرصد هذا المؤشر المتقدم تلقائيًا قمم وقيعان نقاط المحور، ويحسب أقرب مستويات الدعم والمقاومة، ويعرضها بوضوح على مخططك البياني. الميزات الرئيسية: الدعم والمقاومة الديناميكية: تحدد تلقائيًا المستويات الرئيسية استنادًا
FREE
Simple QM Pattern MT5
Suvashish Halder
5 (1)
Simple QM Pattern   is a powerful and intuitive trading indicator designed to simplify the identification of the Quasimodo (QM) trading pattern. The QM pattern is widely recognized among traders for effectively signaling potential   reversals   by highlighting key market structures and price action formations. This indicator helps traders easily visualize the QM pattern directly on their charts, making it straightforward even for those who are new to pattern trading. Simple QM Pattern includes d
FREE
Swing Point BoS CHoCH Con Exp Alerts
Usiola Oluwadamilol Olagundoye
NOTE: Turn Pattern Scan ON This indicator identifies Swing Points, Break of Structure (BoS), Change of Character (CHoCH), Contraction and Expansion patterns which are plotted on the charts It also comes with Alerts & Mobile notifications so that you do not miss any trades. It can be used on all trading instruments and on all timeframes. The non-repaint feature makes it particularly useful in backtesting and developing profitable trading models. The depth can be adjusted to filter swing points.
FREE
[ MT4 Version ]  [ Kill Zones ]  [ SMT Divergences ] How to trade using Order Blocks:  Click here User Interface Performance:  During testing in the strategy tester, the UI may experience lag. Rest assured, this issue is specific to the testing environment and does not affect the indicator's performance in live trading. Elevate your trading strategy with the  Order Blocks ICT Multi TF  indicator, a cutting-edge tool designed to enhance your trading decisions through advanced order block analysis
This indicator is a zero-lag indicator and displays  strength of trend change . True Trend  Oscillator Pro works best in combination with True Trend Moving Average Pro that displays exact trend as is. Oscillator value is exact price change in given direction of the trend. True Trend Moving Average Pro: https://www.mql5.com/en/market/product/103586 If you set PERIOD input parameter to 1 this indicator becomes a sharpshooter for binary options. Developers can use True Trend Oscillator in Exper
FREE
VFI Quantum
Nikita Berdnikov
5 (1)
Introducing VFI (Volume Flow Indicator) – a trading indicator that analyzes the relationship between volume and price movement to identify key trading opportunities. The indicator displays the strength and direction of volume flow, providing clear signals about potential entry and exit points. Signals are formed based on zero line crossovers, crossovers between the VFI line and its exponential moving average (EMA), and when the indicator exits overbought and oversold zones. Attention! This stra
FREE
STD Trend envelopes of averages
Luis Enrique Ricales
5 (1)
Trend Envelopes indicator is calculated based on a % of price change. That % is then used to determine if there is a new trend or trend remains the same. This version is using Standard Deviation for the price change calculation instead and is adding prices smoothing prior to be used in calculations. The smoothing can be done using one of the 4 average types: *   Simple Moving Average *   Exponential Moving Average *   Smoothed Moving Average *   Linear Weighted Moving Average Also, this
FREE
High Low Open Close
Alexandre Borela
4.98 (42)
이 프로젝트를 좋아한다면 5 스타 리뷰를 남겨주세요. 이 지표는 열리고, 높은, 낮은 및 마감 가격을 지정합니다. 기간과 그것은 특정한 시간대를 위해 조정될 수 있습니다. 이들은 많은 기관 및 전문가에 의해 보는 중요한 수준입니다 상인은 당신이 더 많은 것일 수있는 장소를 알고 도움이 될 수 있습니다 이름 * 사용 가능한 기간: 이전 날. 이전 주. 지난 달. 이전 분기. 이전 연도. 또는: 현재 날. 현재 주. 현재 달. 현재 분기. 현재 년.
FREE
Pivot Point Supertrend (corresponds to Pivot Point Super Trend indicator from Trading View) Pivot Point Period:    Pivot point defined as highest high and highest low... input 2 = defining highest high and highest low with 2 bars on each side which are lower (for highest high) and are higher (for lowest low calculation) ATR Length  : the  ATR  calculation is based on 10 periods ATR Factor: ATR multiplied by 3
FREE
이 지표는 실제 거래에 완벽한 자동 파동 분석 지표입니다! 사례... 참고:   웨이브 그레이딩에 서양식 이름을 사용하는 데 익숙하지 않습니다. Tang Lun(Tang Zhong Shuo Zen)의 명명 규칙의 영향으로 기본 웨이브를   펜   으로 명명하고 2차 웨이브 밴드를   세그먼트   로 명명했습니다. 동시에, 세그먼트에는 추세 방향이 있습니다.   주요 추세 세그먼트에는   이름이 지정되지만(이 이름 지정 방법은 향후 노트에서 사용됩니다. 먼저 말씀드리겠습니다.) 알고리즘은 굴곡 이론과 거의 관련이 없으므로 그렇게 해서는 안 됩니다. 이는 나의 시장 분석을   통해 요약된 끊임없이 변화하고 복잡한 운영 규칙을   반영합니다. 밴드는 더 이상 사람마다 다르지 않도록 표준화되고 정의되었습니다. 인위적인 간섭의 드로잉 방법은 시장 진입을 엄격하게 분석하는 데 핵심적인 역할을 합니다. 이 지표를 사용하는 것은 거래 인터페이스의 미학을 개선하고 원래의 K-line 거래를
- Displays horizontal lines for Previous Day High (PDH) and Previous Day Low (PDL) on the chart. - Customizable line colors via input parameters. - Sends sound alerts, pop-up notifications, and mobile push notifications upon the initial crossover of PDH or PDL. - Alerts are triggered only once per crossover event; they re-trigger only if the price moves away and re-crosses after a specified minimum interval. - Automatically updates the PDH/PDL levels at the start of each new day. - All indicator
FREE
SMC full setup
Ahmed Mohammed Bakr Bakr
Ultimate SMC: Professional Smart Money Concepts Indicator Unlock the hidden movements of the market. Trade with the institutions, not against them. The Ultimate SMC indicator is designed for serious traders who want to apply Smart Money Concepts (SMC) to their charts automatically. Manual SMC analysis is time-consuming and prone to subjective error. This tool removes the guesswork by algorithmically detecting Order Blocks, Fair Value Gaps, and Structural breaks in real-time. Whether you are a s
FREE
Impulse fractals indicator - is counter-trend oriented complex market fractal pattern.  Market creates bull/bear impulse, trend starts, fractals on impulsed wave are an agressive pullback signals. Buy arrow is plotted when market is bearish and it's impulse showed up-side fractal, and sell arrow is plotted when market is bullish and it's impulse showed dn-side fractal. Main indicator's adjustable inputs : impulsePeriod - main period of impulse histogram  filterPeriod  - smoothes impulse accordi
This Indicator analyses the Trend and shows signals. When you open the Chart , Indicator shows you Buy or Sell Signal as Alert.  Usage: Activate Algo Trading , Activate the Indicator and drag new currencies into chart. Indicator shows you Buy or Sell Signal as Alert. Results - Buy Signal - Sell Signal - No Signal For any question please don't hesitate to contact.
FREE
The magiciann
Abdelhak Benazizi
5 (5)
THE MAGICIAN - 전문 수급 구역 지표 골드 15분 차트에서 시장 혼란을 명확한 거래 기회로 전환하세요 골드 트레이딩에 어려움을 겪고 계신가요? XAU/USD에서 어디서 진입해야 할지 추측하는 데 지치셨나요? 매수, 매도, 관망 중 무엇을 해야 할지 혼란스러우신가요? 15분 타임프레임에서 고확률 설정을 놓치고 계신가요? "THE MAGICIAN"은 시장을 움직이는 수급의 보이지 않는 힘을 드러냅니다! THE MAGICIAN의 독특한 점은? 멀티 타임프레임 분석 H4, 일봉, 주봉 타임프레임을 동시에 분석 여러 타임프레임이 정렬되는 합류 구역 식별 최고 확률 거래를 위한 HTF 확인 구역 표시 낮은 품질의 신호를 자동으로 제거 신선한(미돌파) 구역만 표시 돌파된 구역은 절대 표시하지 않음 - 깨끗하고 테스트되지 않은 레벨만 각 구역은 신선 표시기로 마킹 50% 침투 임계값으로 품질 탐지 보장 돌파 없이 구역 터치 추적 지능형 트레이딩 가이던스 지표가 거래 또는
FREE
The Horse Signal
Nirundorn Promphao
The Horse Signal 1.26 – Price Action AI Indicator for Gold & Forex Overview: Start your 2026 trading year with "The Horse Signal," the latest precision tool from the WinWiFi Robot Series. Designed specifically for traders who demand high-accuracy entries, this indicator utilizes advanced Price Action analysis combined with an AI scanning algorithm to identify high-probability reversal and trend continuation points in real-time. Key Features: Dynamic Price Action Scan: Automatically analyzes can
FREE
Moving line
Jun Chao Jiang
The one minute chart has a bug, but the one-day chart can still be used after deleting the bug and reloading the indicators, This indicator can be used to determine how far the indicator goes up to place an order to buy, how far it goes down to place an order to sell, and not placing an order until it reaches this distance, which is considered oscillation, open an account gift index
FREE
BoxProfile MT5
Evgeny Shevtsov
4.6 (10)
The indicator displays volume profiles based on the nesting principle. Profiles periods are pre-set so that each subsequent profile has a length twice as long as the length of the previous profile. In addition to profiles, the indicator displays volume clusters sorted by color, depending on the volume they contain. Indicator operation features The indicator works on typical timeframes from M5 to MN, but for calculations uses historical data from smaller timeframes: M1 - for timeframes from M5
FREE
Free for now, price is going to be 30 USD at Jan 1. 2025. Features: Pin Bar Detection : The indicator is designed to identify bullish and bearish pin bars based on specific criteria, including the relative size of the candle’s body and shadow, as well as the position of the candle's body in relation to the 38.2% Fibonacci level. Customizable Labels : Custom text is displayed above each identified bullish or bearish pin bar, such as "[38.2]" for bullish and "[-38.2]" for bearish, helping traders
FREE
Market Sessionsync** is a cutting-edge trading session indicator designed to enhance your trading experience by visually breaking down the market's daily rhythm. With a compact window overlaid on your chart, this indicator provides a split-second understanding of the current trading session through: Basic setup: Set Difference between your local time and your broker time , set DST(Daylight Saving Time) ON or OFF , set timescale sync you want to use (Local, Broker, CET) - A vertical time marker
FREE
Slope Direction Line MT5
Do Kim Dang Khoi
5 (3)
If you love this indicator, please leave a positive rating and comment, it will be a source of motivation to help me create more products <3 How to use  Slope Direction Line Uptrend: When the SDL line slopes up and turns from red to green, it shows that the price is trending up. This is also considered a buy signal. Downtrend: When the SDL line slopes down and turns from green to red, it shows that the price is trending down. This is also considered a sell signal. Sideways: When the SDL line mo
FREE
Vertical Volume
Kim Yonghwa
4.8 (5)
기능 가격에 대한 거래량 확인 지표입니다. 주로 EURUSD에 적용되며, 다른 통화 쌍은 작동하지 않거나 계산에 오랜 시간이 걸릴 수 있습니다. 원활한 사용을 위해 "차트 경계를 오른쪽 경계에서 이동" 옵션을 활성화합니다(스크린샷에 표시됨). 새로운 막대가 나타날 때 데이터가 재설정됩니다. 변수 COlOR: 지표 색상 설정 WIDTH: 지표 너비 설정 PERIOD: 데이터 계산을 위한 기간 설정 ‐----‐-------------------------------------------------------------------------------------------------------------------------------------------------
FREE
TrendlineBreak Alert
Yasir Zaidi
4 (2)
Get ALERTS for break of your TRENDLINES, SUPPORT LINES, RESISTANCE LINE, ANY LINE!! 1. Draw a line on the chart (Trend, support, resistance, whatever you like) and give it a name (e.g. MY EURUSD line) 2. Load the Indicator and input the Line Name the same name in Indicator INPUT so system knows the name of your line (= MY EURUSD line) 3. Get Alerts when Price breaks the line and closes Works on All Time frames and charts LEAVE A COMMENT AND IF THERE IS ENOUGH INTEREST I WILL WRITE AN EA WHICH W
FREE
The new update makes this indicator a complete tool for studying, analyzing and operating probabilistic patterns. It includes: On-chart Multi-asset percentage monitor. Configurable martingales. Twenty-one pre-configured patterns, including Mhi patterns and C3. An advanced pattern editor to store up to 5 custom patterns. Backtest mode to test results with loss reports. Trend filter. Hit operational filter. Martingale Cycles option. Various types of strategies and alerts. Confluence between patter
Nem Nem
Taha Saber Ashour Kamel
Nem Nem is super accurate mt5 indicator it is working with any pair any time frame it will show and provide you with high Winrate signal you can use for forex pairs , gold and any other pairs it is easy to use also you can see the white lines for starting and end of signals it will help you to read the chart and enter and make correct decisions in trades. also it  will be clear for you when to enter and exit from any trades
FREE
Free automatic Fibonacci is an indicator that automatically plots a Fibonacci retracement based on the number of bars you select on the BarsToScan setting in the indicator. The Fibonacci is automatically updated in real time as new highest and lowest values appears amongst the selected bars. You can select which level values to be displayed in the indicator settings. You can also select the color of the levels thus enabling the trader to be able to attach the indicator several times with differe
FREE
VisualVol EURUSD
Maxim Kuznetsov
The indicator highlights the points that a professional trader sees in ordinary indicators. VisualVol visually displays different volatility indicators on a single scale and a common align. Highlights the excess of volume indicators in color. At the same time, Tick and Real Volume, Actual range, ATR, candle size and return (open-close difference) can be displayed. Thanks to VisualVol, you will see the market periods and the right time for different trading operations. This version is intended f
FREE
이 제품의 구매자들이 또한 구매함
Divergence Bomber
Ihor Otkydach
4.9 (80)
이 지표를 구매하신 분께는 다음과 같은 혜택이 무료로 제공됩니다: 각 거래를 자동으로 관리하고, 손절/익절 수준을 설정하며, 전략 규칙에 따라 거래를 종료하는 전용 도우미 툴 "Bomber Utility" 다양한 자산에 맞게 지표를 설정할 수 있는 셋업 파일(Set Files) "최소 위험", "균형 잡힌 위험", "관망 전략" 모드로 설정 가능한 Bomber Utility의 셋업 파일 이 전략을 빠르게 설치, 설정, 시작할 수 있도록 돕는 단계별 영상 매뉴얼 주의: 위의 모든 보너스를 받기 위해서는 MQL5 개인 메시지 시스템을 통해 판매자에게 연락해 주세요. 독창적인 커스텀 지표인 “Divergence Bomber(다이버전스 봄버)”를 소개합니다. 이 지표는 MACD 다이버전스(괴리) 전략을 기반으로 한 올인원(All-in-One) 거래 시스템입니다. 이 기술 지표의 주요 목적은 가격과 MACD 지표 간의 다이버전스를 감지하고, **향후 가격이 어느 방향으로 움직일지를 알려주는
Azimuth Pro
Ottaviano De Cicco
5 (1)
LAUNCH PROMO Azimuth Pro price is initially set at 299$ for the first 100 buyers. Final price will be 499$ . THE DIFFERENCE BETWEEN RETAIL AND INSTITUTIONAL ENTRIES ISN'T THE INDICATOR — IT'S THE LOCATION. Most traders enter at arbitrary price levels, chasing momentum or reacting to lagging signals. Institutions wait for price to reach structured levels where supply and demand actually shift. Azimuth Pro maps these levels automatically: swing-anchored VWAP, multi-timeframe structure lines, an
Quantum Trend Sniper
Bogdan Ion Puscasu
4.74 (53)
소개       Quantum Trend Sniper Indicator는   추세 반전을 식별하고 거래하는 방식을 변화시키는 획기적인 MQL5 지표입니다! 13년 이상의 거래 경험을 가진 숙련된 트레이더 팀이 개발한       Quantum Trend Sniper 표시기       매우 높은 정확도로 추세 반전을 식별하는 혁신적인 방법으로 거래 여정을 새로운 차원으로 끌어올리도록 설계되었습니다. ***Quantum Trend Sniper Indicator를 구입하면 Quantum Breakout Indicator를 무료로 받을 수 있습니다!*** Quantum Trend Sniper Indicator는 추세 반전을 식별하고 세 가지 이익실현 수준을 제안할 때 경고, 신호 화살표를 제공합니다. 초보자 거래자와 전문 거래자 모두에게 적합합니다. Quantum EA 채널:       여기를 클릭하세요 MT4 버전:       여기를 클릭하세요 추천: 기간:모든 기간.
무료 AUX 인디케이터와 EA 지원을 받으세요 직접 다운로드 — 여기를 클릭 [ D.I.C.E ] The DICE Indicator  Divergence in Chaos Environment는 엘리엇 파동 이론과 트레이딩 카오스 기법을 함께 사용하는 트레이더를 위해 설계된 MT5 전문 도구입니다. 가격 움직임의 숨겨진 및 일반 다이버전스를 감지하며, 빌 윌리엄스가 설명한 혼돈 시장 환경과 동기화됩니다. 주요 특징 엘리엇 파동 정렬 다이버전스: 파동 구조에 조화된 강세 및 약세 다이버전스를 탐지하여 파동 카운팅 정확도를 높입니다. 카오스 기법 통합: AO(오썸 오실레이터) 및 시장 구조 원칙과 일치하도록 설계되었습니다. 다중 타임프레임 스캐닝: 다양한 시간 프레임에서 다이버전스를 분석하여 모멘텀 변화와 추세 소진을 확인합니다. 시각적 알림 및 객체: 명확한 화살표, 선, 표시로 빠른 인식 가능. 적응형 시장 판독: 혼돈 시장 조건에 자동으로 조정되어 노이즈를 필터링하고 유효한 셋업만
PZ Swing Trading MT5
PZ TRADING SLU
5 (5)
Protect against whipsaws: revolutionize your swing trading approach Swing Trading is the first indicator designed to detect swings in the direction of the trend and possible reversal swings. It uses the baseline swing trading approach, widely described in trading literature. The indicator studies several price and time vectors to track the aggregate trend direction and detects situations in which the market is oversold or overbought and ready to correct. [ Installation Guide | Update Guide | Tro
Grabber System MT5
Ihor Otkydach
4.81 (21)
탁월한 기술적 지표인 Grabber를 소개합니다. 이 도구는 즉시 사용 가능한 “올인원(All-Inclusive)” 트레이딩 전략으로 작동합니다. 하나의 코드 안에 강력한 시장 기술 분석 도구, 매매 신호(화살표), 알림 기능, 푸시 알림이 통합되어 있습니다. 이 인디케이터를 구매하신 모든 분들께는 다음의 항목이 무료로 제공됩니다: Grabber 유틸리티: 오픈 포지션을 자동으로 관리하는 도구 단계별 영상 매뉴얼: 설치, 설정, 그리고 실제 거래 방법을 안내 맞춤형 세트 파일: 인디케이터를 빠르게 자동 설정하여 최고의 성과를 낼 수 있도록 도와줍니다 다른 전략은 이제 잊어버리세요! Grabber만이 여러분을 새로운 트레이딩의 정점으로 이끌어 줄 수 있습니다. Grabber 전략의 주요 특징: 거래 시간 프레임: M5부터 H4까지 거래 가능한 자산: 어떤 자산이든 사용 가능하지만, 제가 직접 테스트한 종목들을 추천드립니다 (GBPUSD, GBPCAD, GBPCHF, AUDCAD, AU
Super Signal – Skyblade Edition 전문가용 노리페인트 / 노래그 트렌드 신호 시스템, 뛰어난 승률 제공 | MT4 / MT5용 1분, 5분, 15분과 같은 낮은 타임프레임에서 가장 좋은 성능을 보입니다. 핵심 기능: Super Signal – Skyblade Edition은 추세 매매를 위해 설계된 스마트 신호 시스템입니다. 이 시스템은 다중 필터 로직을 활용하여, 명확한 방향성과 실질적인 모멘텀이 수반된 고품질 추세만을 감지합니다. 이 시스템은   고점 또는 저점을 예측하지 않으며 , 다음 세 가지 조건이 모두 충족될 때만 신호를 발생시킵니다: 명확한 추세 방향 강화되는 모멘텀 건전한 변동성 구조 또한, 시장 세션 기반의 유동성 분석을 통해 신호의 신뢰성과 타이밍을 더욱 향상시킵니다. 신호 특성: 모든 화살표 신호는 100% 리페인트 없음 / 지연 없음 신호가 한 번 발생하면 고정되며, 깜빡이거나 사라지지 않음 차트 상의 시각적 화살표, 정보 패널, 팝업
Trend Forecaster
Alexey Minkov
5 (7)
The Trend Forecaster indicator utilizes a unique proprietary algorithm to determine entry points for a breakout trading strategy. The indicator identifies price clusters, analyzes price movement near levels, and provides a signal when the price breaks through a level. The Trend Forecaster indicator is suitable for all financial assets, including currencies (Forex), metals, stocks, indices, and cryptocurrencies. You can also adjust the indicator to work on any time frames, although it is recommen
Berma Bands
Muhammad Elbermawi
5 (7)
Berma Bands(BBs) 지표는 시장 동향을 파악하고 이를 활용하려는 트레이더에게 귀중한 도구입니다. 가격과 BBs 간의 관계를 분석함으로써 트레이더는 시장이 추세 단계인지 범위 단계인지를 분별할 수 있습니다. 자세한 내용을 알아보려면 [ Berma Home Blog ]를 방문하세요. 버마 밴드는 세 개의 뚜렷한 선으로 구성되어 있습니다. 어퍼 버마 밴드, 미들 버마 밴드, 로어 버마 밴드입니다. 이 선들은 가격 주위에 그려져 전체 추세에 대한 가격 움직임을 시각적으로 표현합니다. 이 밴드들 사이의 거리는 변동성과 잠재적인 추세 반전에 대한 통찰력을 제공할 수 있습니다. 버마 밴드 라인이 각각에서 분리될 때, 그것은 종종 시장이 횡보 또는 범위 이동 기간에 접어들고 있음을 시사합니다. 이는 명확한 방향 편향이 없음을 나타냅니다. 트레이더는 이러한 기간 동안 추세를 파악하기 어려울 수 있으며 더 명확한 추세가 나타날 때까지 기다릴 수 있습니다. 버마 밴드 라인이 단일 라인으로
물론입니다. 아래는 제공해주신 텍스트의 한국어 번역입니다: MT4용 천문학 지표 소개: 귀하의 최상급 하늘 트레이딩 동반자 트레이딩 경험을 천체의 높이로 끌어올리기 준비가 되셨나요? MT4용 천문학 지표를 소개합니다. 이 혁신적인 도구는 복잡한 알고리즘의 힘을 활용하여 탁월한 천문학적 통찰과 정밀한 계산을 제공합니다. 정보의 우주를 손에 담다:   천문학적 데이터의 보물함을 드러내는 포괄적인 패널을 살펴보세요. 행성의 지오/헬리오센트릭 좌표, 태양/지구 거리, 크기, 길이, 별자리, 황도 좌표 및 적도 좌표, 심지어 수평 좌표 등 각각이 정밀하게 계산되고 아름답게 제시됩니다. 지표에 의해 생성된 수직선은 시간 값에 해당하여 트레이딩 여정에 우주적인 시각을 부여합니다. 행성 라인과 관계:   수정 가능한 스케일과 각도로 차트를 장식하는 행성 라인의 마법을 경험해보세요. 직관적인 컨트롤 패널을 통해 각 행성의 라인의 가시성을 손쉽게 전환할 수 있습니다. 쥰션이나 섹스타일, 사분각, 삼분
Trade smarter, not harder: Empower your trading with Harmonacci Patterns This is arguably the most complete harmonic price formation auto-recognition indicator you can find for the MetaTrader Platform. It detects 19 different patterns, takes fibonacci projections as seriously as you do, displays the Potential Reversal Zone (PRZ) and finds suitable stop-loss and take-profit levels. [ Installation Guide | Update Guide | Troubleshooting | FAQ | All Products ] It detects 19 different harmonic pri
Gold Sniper Scalper Pro
Ich Khiem Nguyen
3.5 (8)
Gold Sniper Scalper Pro는 MetaTrader 5용 전문 지표로, 트레이더가 진입 지점을 식별하고 리스크를 효과적으로 관리할 수 있도록 지원하기 위해 설계되었습니다. 이 지표는 시그널 감지 시스템, 자동 Entry/SL/TP 관리, 거래량 분석 및 실시간 성과 통계를 포함하는 포괄적인 분석 도구 세트를 제공합니다. 시스템 이해를 위한 사용자 가이드   |   기타 언어 사용자 가이드 주요 기능 시그널 감지 시스템 지표는 Price Action 분석 및 시장 구조를 기반으로 잠재적 진입 지점을 자동으로 감지합니다. 거래 기회 감지 시: - BUY 화살표(녹색) 또는 SELL 화살표(빨간색)가 차트에 표시됩니다 - 캔들이 색상으로 표시되어 시그널 영역을 식별합니다 - Entry/SL/TP 레벨이 자동으로 계산됩니다 시그널은 가격이 Entry 레벨에 도달할 때만 활성화되어, 시장에서 확인되지 않은 시그널을 필터링합니다. 지능형 Entry/SL/TP 관리 - Ent
Advanced Supply Demand MT5
Bernhard Schweigert
4.5 (14)
현재 33% 할인! 초보자나 전문 트레이더를 위한 최고의 솔루션! 이 보조지표는 우리가 다수의 독창적 기능과 새로운 공식을 통합한 독특하고 고품질이며 저렴한 거래 도구입니다. 이 업데이트를 통해 이중 시간대를 표시할 수 있습니다. 더 높은 TF를 표시할 수 있을 뿐만 아니라 차트 TF와 더 높은 TF 모두를 표시할 수 있습니다: 중첩 영역 표시. 모든 Supply Demand 트레이더들이 좋아할 것입니다. :) 중요한 정보 공개 Advanced Supply Demand의 잠재력을 극대화하려면 다음을 방문하십시오. https://www.mql5.com/ko/blogs/post/720245   진입 또는 목표의 명확한 트리거 포인트를 정확히 찾아냄으로 해서 거래가 어떻게 개선될지 상상해 보십시오. 새로운 알고리즘을 기반으로 매수자와 매도자 간의 잠재적인 불균형을 훨씬 더 쉽게 분간할 수 있습니다. 왜냐하면 가장 강한 공급영역과 가장 강한 수요 영역과 과거에 어떻게 진행 되었는지를(이전
ARIPoint
Temirlan Kdyrkhan
1 (1)
ARIPoint is a powerful trading companion designed to generate high-probability entry signals with dynamic TP/SL/DP levels based on volatility. Built-in performance tracking shows win/loss stats, PP1/PP2 hits, and success rates all updated live. Key Features: Buy/Sell signals with adaptive volatility bands Real-time TP/SL/DP levels based on ATR Built-in MA Filter with optional ATR/StdDev volatility Performance stats panel (Success, Profit/Loss, PP1/PP2) Alerts via popup, sound, push, or email Cu
Shock Pullback
Suleiman Alhawamdah
5 (1)
간단히 말해, 현재 캔들 옆에 흰색 숫자(‘핍’이라고 불림)의 움직임이 나타나기 시작하면 거래를 시작할 수 있습니다. 흰색 ‘핍’은 현재 매수 또는 매도 거래가 활성화되어 있으며 흰색으로 표시된 것처럼 올바른 방향으로 움직이고 있음을 나타냅니다. 흰색 핍의 움직임이 멈추고 정적인 녹색으로 바뀌면 이는 현재 모멘텀의 종료를 의미합니다. 숫자의 녹색은 매수 또는 매도 거래를 통해 얻은 총 수익을 ‘핍’ 단위로 나타냅니다. 또한, 인디케이터 내의 다른 고급 전문 분석 도구를 활용하여 거래를 시작할 수 있습니다. 인디케이터에 표시되는 신호와 색상을 관찰함으로써 높은 정확도로 수많은 스캘핑 기회를 포착할 수 있습니다. 테스트 중이거나 실시간 차트에서 인디케이터를 충분히 이해하는 것이 중요합니다. 대부분의 외환 시장에 적합: 금 거래 및 인기 있는 지수 시장(Dow Jones, S&P 500, Nasdaq, DAX 등), 그리고 EUR/USD, GBP/USD, USD/JPY 등 강력한 통화쌍
Quantum TrendPulse
Bogdan Ion Puscasu
5 (20)
SuperTrend   ,   RSI   ,   Stochastic   의 힘을 하나의 포괄적인 지표로 결합하여 트레이딩 잠재력을 극대화하는 궁극의 트레이딩 도구   인 Quantum TrendPulse를   소개합니다. 정밀성과 효율성을 추구하는 트레이더를 위해 설계된 이 지표는 시장 추세, 모멘텀 변화, 최적의 진입 및 종료 지점을 자신 있게 식별하는 데 도움이 됩니다. 주요 특징: SuperTrend 통합:   주요 시장 추세를 쉽게 따라가고 수익성의 물결을 타세요. RSI 정밀도:   매수 과다 및 매도 과다 수준을 감지하여 시장 반전 시점을 파악하는 데 적합하며 SuperTrend 필터로 사용 가능 확률적 정확도:   변동성이 큰 시장에서 숨겨진 기회를 찾기 위해 확률적 진동   을 활용하고 SuperTrend의 필터로 사용 다중 시간대 분석:   M5부터 H1 또는 H4까지 다양한 시간대에 걸쳐 시장을 최신 상태로 유지하세요. 맞춤형 알림:   맞춤형 거래 조건이 충족되면
우선적으로, 이 거래 도구는 전문적인 거래에 이상적인 비-다시 그리기 및 지연되지 않는 지표입니다.  온라인 강좌, 사용자 매뉴얼 및 데모. 스마트 가격 액션 컨셉트 인디케이터는 신규 및 경험 많은 트레이더 모두에게 매우 강력한 도구입니다. Inner Circle Trader Analysis 및 Smart Money Concepts Trading Strategies와 같은 고급 거래 아이디어를 결합하여 20가지 이상의 유용한 지표를 하나로 결합합니다. 이 인디케이터는 스마트 머니 컨셉트에 중점을 두어 대형 기관의 거래 방식을 제공하고 이동을 예측하는 데 도움을 줍니다.  특히 유동성 분석에 뛰어나 기관이 어떻게 거래하는지 이해하는 데 도움을 줍니다. 시장 트렌드를 예측하고 가격 변동을 신중하게 분석하는 데 탁월합니다. 귀하의 거래를 기관 전략에 맞추어 시장의 동향에 대해 더 정확한 예측을 할 수 있습니다. 이 인디케이터는 시장 구조를 분석하고 중요한 주문 블록을 식별하고 다양
Gartley Hunter Multi
Siarhei Vashchylka
5 (11)
Gartley Hunter Multi - An indicator for searching for harmonic patterns simultaneously on dozens of trading instruments and on all possible timeframes. Manual (Be sure to read before purchasing) | Version for MT4 Advantages 1. Patterns: Gartley, Butterfly, Shark, Crab. Bat, Alternate Bat, Deep Crab, Cypher 2. Simultaneous search for patterns on dozens of trading instruments and on all possible timeframes 3. Search for patterns of all possible sizes. From the smallest to the largest 4. All fou
MetaForecast M5
Vahidreza Heidar Gholami
5 (3)
MetaForecast는 가격 데이터의 조화를 기반으로 모든 시장의 미래를 예측하고 시각화합니다. 시장이 항상 예측 가능한 것은 아니지만 가격에 패턴이 있다면 MetaForecast는 가능한 정확하게 미래를 예측할 수 있습니다. 다른 유사한 제품과 비교했을 때, MetaForecast는 시장 동향을 분석하여 더 정확한 결과를 생성할 수 있습니다. 입력 매개변수 Past size (과거 크기) MetaForecast가 미래 예측을 생성하기 위한 모델을 만드는 데 사용하는 막대의 수를 지정합니다. 모델은 선택한 막대 위에 그려진 노란색 선으로 표시됩니다. Future size (미래 크기) 예측해야 할 미래 막대의 수를 지정합니다. 예측된 미래는 핑크색 선으로 표시되며 그 위에 파란색 회귀선이 그려집니다. Degree (차수) 이 입력은 MetaForecast가 시장에서 수행할 분석 수준을 결정합니다. Degree 설명  0 차수 0의 경우, "Past size" 입력에 모든 봉우리와
Rtc ML Ai Predictor
Muhammad Faisal Sagala
Rtc ML Ai | Predictor CORE MACHINE LEARNING ENGINE Adaptive ML Market Predictor – Multi-Bar Trend & Candle Forecast What This Indicator Does This indicator is a  real-time market prediction engine  designed to analyze price behavior and estimate  future market tendencies . Unlike conventional indicators, this system  does not rely on static parameters or historical curve-fitting , but adapts its internal state dynamically during live market operation. Instead of using static rules, the indic
무료 AUX 지표, EA 지원 및 전체 가이드를 얻으시려면 방문하세요 – https://www.mql5.com/en/blogs/post/763955 트렌드를 포착하세요. 패턴을 읽으세요. 진입 시점을 타이밍하세요. 30초 이내의 3단계! 분석 없이도 쉽게 거래하세요 — 당신의 스마트 어시스턴트가 워크플로우를 단순화해 드립니다. 더 이상 차트 과부하 없음. 스마트 바이어스 감지로 자신감 있게 거래하세요. 모든 통화, 암호화폐, 주식, 금속, 지수 및 모든 시간대와 호환됩니다. 그냥 클릭하고 실행하세요 — 정말 간단합니다. 속도와 명확성을 원하는 바쁜 트레이더에게 이상적입니다. TPTSyncX는 추세, 패턴, 그리고 캔들스틱 트리거 분석을 하나로 통합하여 깨끗하고 지능적인 시각 시스템으로 동기화하는 강력한 올인원 MetaTrader 5 인디케이터입니다. 명확성, 정밀성, 속도를 원하는 트레이더를 위해 설계되었으며, 가격 행동, 구조적 패턴 및 시장 타이밍 도구의 조합을 통해 높은 확
Weis Wave with Alert MT5
Trade The Volume Waves Single Member P.C.
4.94 (17)
Rental/Lifetime Package Options and Privileges  Rent Monthly Six Months   Yearly/Lifetime Weis Wave with Speed with Alert+Speed Index x x x Manual  x x x Quick Set up Video x x x Blog x x x Lifetime Updates x x x Setup and Training Material x x Discord Access Channel "The SI traders"          x Rectangle Break Alert Tool      x How to trade with it:    http://www.tradethevolumewaves.com   ** If you purchase please contact me to setup your  : Training Room and  complete manual access.  Wei
MTF WAD Simplified Indicator - Professional Trading Solution     Overview The MTF WAD Simplified is a sophisticated multi-timeframe volume-based indicator designed to track smart money flow across financial markets. By monitoring the Williams Accumulation/Distribution (WAD) across 8 different timeframes, this tool provides traders with unprecedented insight into institutional accumulation and distribution patterns.     Core Benefits for Traders     1. Smart Money Tracking - Detect Institutional
Entry Points Pro for MT5
Yury Orlov
4.48 (138)
다시 색을 칠하지 않고 거래에 진입할 수 있는 정확한 신호를 제공하는 MT5용 지표입니다. 외환, 암호화폐, 금속, 주식, 지수 등 모든 금융 자산에 적용할 수 있습니다. 매우 정확한 추정값을 제공하고 매수와 매도의 가장 좋은 시점을 알려줍니다. 하나의 시그널로 수익을 내는 지표의 예와 함께 비디오 (6:22)시청하십시오! 대부분의 거래자는 Entry Points Pro 지표의 도움으로 첫 거래 주 동안 트레이딩 결과를 개선합니다. 저희의   Telegram Group 을 구독하세요! Entry Points Pro 지표의 좋은점. 재도색이 없는 진입 신호 신호가 나타나고 확인되면(시그널 캔들이 완성된 경우) 신호는 더 이상 사라지지 않습니다. 여타 보조지표의 경우 신호를 표시한 다음 제거되기 때문에 큰 재정적 손실로 이어집니다. 오류 없는 거래 게시 알고리즘을 통해 트레이드(진입 또는 청산)를 할 이상적인 순간을 찾을 수 있으며, 이를 통해 이를 사용하는 모든 거래자의 성공률이
Meravith MT5
Ivan Stefanov
이 인디케이터는 임의의 지점에서 거래량을 분석하고 해당 거래량의 시장 소진(exhaustion) 수준을 계산합니다. Meravith 주요 라인: 강세 거래량 소진선 – 목표로 사용됩니다. 약세 거래량 소진선 – 목표로 사용됩니다. 추세선 – 시장 추세를 나타냅니다. 시장이 강세인지 약세인지에 따라 색상이 변경되며, 추세 지지선 역할을 합니다. 사용 방법: 보라색 세로선을 더블 클릭한 후 원하는 위치로 이동시키십시오. 추세와 조정을 포함해 무엇이든 분석할 수 있습니다. 인디케이터를 시장의 상단, 하단 또는 중요하다고 생각되는 임의의 지점으로 이동시킬 수 있습니다. 좋은 방법은 시장이 소진선 사이에 머물도록 Meravith를 설정하는 것입니다. 이렇게 하면 추적할 수 있는 명확한 목표를 갖게 됩니다. 초기 소진선이 돌파되면 새로운 소진선이 나타나며, 추가로 거래 가능한 채널이 형성됩니다. 소진 수준에 도달하면 인디케이터의 위치를 다시 조정하거나 다른 시간 프레임으로 전환하여 새로운 소진
Elliott Wave Trend MT5
Young Ho Seo
4 (4)
Elliott Wave Trend was designed for the scientific wave counting. This tool focuses to get rid of the vagueness of the classic Elliott Wave Counting using the guideline from the template and pattern approach. In doing so, firstly Elliott Wave Trend offers the template for your wave counting. Secondly, it offers Wave Structural Score to assist to identify accurate wave formation. It offers both impulse wave Structural Score and corrective wave Structure Score. Structural Score is the rating to sh
PZ Day Trading MT5
PZ TRADING SLU
2.83 (6)
Effortless trading: non-repainting indicator for accurate price reversals This indicator detects price reversals in a zig-zag fashion, using only price action analysis and a donchian channel. It has been specifically designed for short-term trading, without repainting or backpainting at all. It is a fantastic tool for shrewd traders aiming to increase the timing of their operations. [ Installation Guide | Update Guide | Troubleshooting | FAQ | All Products ] Amazingly easy to trade It provides
SHOGUN TRADE PRO [MT5] - Professional Market Structure & Dow Theory Suite Limited Release: Early Access Pricing This professional suite is currently available at an introductory price to celebrate its launch on the MT5 platform. Please note that the price will be adjusted incrementally as updates are released and the user base grows. Secure your "Commander’s Seat" at the most favorable rate today. The Developer’s Journey: From Noise to Clarity I will be honest: I was once a "knowledge colle
" Dynamic Scalper System MT5 " 지표는 추세 파동 내에서 스캘핑 방식으로 거래하도록 설계되었습니다. 주요 통화쌍 및 금에서 테스트되었으며, 다른 거래 상품과의 호환성이 가능합니다. 추가적인 가격 변동 지원을 통해 추세에 따라 단기 포지션 진입 신호를 제공합니다. 지표의 원리 큰 화살표는 추세 방향을 결정합니다. 작은 화살표 형태의 스캘핑 신호를 생성하는 알고리즘은 추세 파동 내에서 작동합니다. 빨간색 화살표는 상승 방향을, 파란색 화살표는 하락 방향을 나타냅니다. 민감한 가격 변동선은 추세 방향으로 그려지며, 작은 화살표의 신호와 함께 작용합니다. 신호는 다음과 같이 작동합니다. 적절한 시점에 선이 나타나면 진입 신호가 형성되고, 선이 있는 동안 미결제 포지션을 유지하며, 완료되면 거래를 종료합니다. 권장되는 작업 시간대는 M1~H4입니다. 화살표는 현재 캔들에 형성되며, 다음 캔들이 이미 시작되었더라도 이전 캔들의 화살표는 다시 그려지지 않습니다. 입
PZ Divergence Trading MT5
PZ TRADING SLU
3.71 (7)
Unlock hidden profits: accurate divergence trading for all markets Tricky to find and scarce in frequency, divergences are one of the most reliable trading scenarios. This indicator finds and scans for regular and hidden divergences automatically using your favourite oscillator. [ Installation Guide | Update Guide | Troubleshooting | FAQ | All Products ] Easy to trade Finds regular and hidden divergences Supports many well known oscillators Implements trading signals based on breakouts Displays
제작자의 제품 더 보기
The Compare Graphs indicator is an analysis tool that allows traders to compare two or more graphs on the same chart window. This indicator is commonly used in trading platforms such as MetaTrader and provides a clearer comparison of different financial instruments or time frames. Functions of the Compare Graphs indicator may include: Selecting Charts: The trader can select the charts he wants to compare, such as price charts of different currency pairs or indicators on the same chart. Setting
The   Angle Prices   indicator is a tool that calculates the price angle based on price analysis, interpreting the time vector in the form of price points on the price chart. In other words, the X axis and Y axis are represented as price points, so you can actually calculate the angle with two axes of the same dimension. This allows traders to obtain information about the direction of price movement and possible entry or exit points for trades. Let's look at the main characteristics and interpr
The " Fortune Long " bot works using pending orders and reacts to a channel breakdown with the direction of work in the channel; it is necessary to correctly calculate the levels of entry, stop loss, take profit, and the level of deviation of the pending order from the price. The bot needs to be optimized for 2 years with a forward period of 1/2. Once optimization is complete, select the best settings and save them. Work for 6 months. The bot automatically calculates all levels and the entry le
In the world of trading, one of the main concerns is finding a reliable trading system. Meet the TrendEdge Channel indicator - your reliable companion in this search. Developed based on complex mathematical calculations, this indicator predicts the most likely short-term price movements. TrendEdge Channel is designed specifically to identify trends in price movements. Thanks to it, you can quickly determine not only the direction of the trend, but also the levels of interaction between buyers
With the growth of information technology and the increasing number of participants in financial markets, traditional analysis tools are becoming less effective. Conventional technical indicators, such as the moving average or stochastic, in their pure form are unable to accurately determine the direction of the trend or its reversal. Is it possible to find an indicator that remains effective for 14 years without changing its parameters, and at the same time adapts to market changes? Yes, such
Misio
Sabina Fik
Misio - can be used as an independent trading system. The indicator determines the market trend, ignoring sharp fluctuations and noise around the average price. It displays the trending movement with potential stop points. Simple, clear and effective use. The indicator does not redraw and does not lag. Suitable for all currency pairs and all timeframes. Interpretation: The location of the rate above or below the shadows indicates the presence of a trend. A move into the shadows signals a pos
Trend Divergence Indicator: Your Essential Tool for Market Analysis The Trend Divergence Indicator is a powerful tool designed to assist traders in identifying market trends and pinpointing entry points with precision. By leveraging price divergence, this indicator enhances your trading strategy, offering reliable insights and filtering unnecessary signals. Key Features and Benefits of the Trend Divergence Indicator Accurate Trend Analysis: The Trend Divergence Indicator uses price divergence t
BioStars
Sabina Fik
The "BioStar" indicator is an innovative tool for trend analysis on the Forex market. It has unique capabilities and a wide range of settings that will help traders make informed decisions when trading. This indicator is based on the analysis of the market trend and helps to identify the direction of price movement. It uses various mathematical algorithms and statistical methods to determine the strength and stability of the trend in the market. One of the key features of the "BioStar" indica
Core Drift Index: Your Reliable Guide in the World of Trading Core Drift Index is an innovative trend indicator designed for precise detection of market directions and reversal points . This powerful tool enables traders to optimize their investments , minimize risk, and maximize profit. Key Features and Benefits Intuitive Trend Detection Core Drift Index clearly shows trend direction, helping traders make timely entry and exit decisions. High Probability of Success With its high accuracy
Warp Range Sensor: The Color of Your Trend Warp Range Sensor is a trend direction indicator that visually displays the current market condition by coloring bars red and blue based on trend direction. What Does Warp Range Sensor Do? Identifies the Current Trend Direction Blue bars indicate an uptrend Red bars signal a downtrend Universal Application Compatible with all currency pairs and timeframes , from short-term scalping to long-term trading. Powered by Market Context & Historical Data W
Pointer Trend Switch — precision trend reversal indicator Pointer Trend Switch is a high-precision arrow indicator designed to detect key moments of trend reversal based on asymmetric price behavior within a selected range of bars. It identifies localized price impulses by analyzing how far price deviates from the opening level, helping traders find accurate entry points before a trend visibly shifts. This indicator is ideal for scalping, intraday strategies, and swing trading, and performs equa
TrendCore Adaptive FX — Smart Expert Advisor for Confident and Adaptive Forex Trading TrendCore Adaptive FX   is a powerful, fully automated trading robot designed for consistent performance in the Forex market. It combines trend-based technical analysis, adaptive lot management, and solid capital protection strategies to ensure robust and efficient trading under real market conditions. Whether you're a professional trader or a long-term investor, this EA offers an intelligent solution to a
FlexiTrade Bot: Trade Smart, Not Blind Ditch the guesswork.   FlexiTrade Bot   is more than just a trading tool — it’s an intelligent trading engine built for traders who value   speed, precision, and adaptability . With real-time market analysis and pattern recognition, FlexiTrade delivers actionable signals with razor-sharp accuracy so you can focus on results, not reaction.   What Sets FlexiTrade Apart? Market Structure Awareness Unlike bots that rely on rigid indicator rules,   FlexiTr
AlphaTrader: Your Intelligent Partner in Forex Trading AlphaTrader   is an advanced trading system that utilizes automated analysis and trading strategies to optimize decision-making in the Forex market. Built using geometric patterns and cutting-edge algorithms, this bot detects pricing patterns, providing precise signals for successful trades.   Why Choose AlphaTrader? AlphaTrader is not just a trading bot; it’s a   full-fledged partner   designed to help you manage your capital as efficien
Acceleration Bias — Price Acceleration Impulse Indicator Acceleration Bias   is a modern analytical tool designed to measure changes in price acceleration and visualize impulse asymmetry using a robust mathematical model. This indicator is intended for traders working with market volatility, impulse phases, and price-movement structure, as well as those who need algorithmic, rule-based analytical support. Purpose and Core Concept Unlike traditional oscillators that analyze only velocity changes
The Plasma Trend indicator is a simple technical indication that is used to determine the current trend direction in the market. The Plasma Trend indicator is a powerful tool for determining the direction of the trend in the Forex market. It is based on both standard technical indicators and proprietary mathematical calculations, which provides a more accurate and reliable trend determination. Its implementation in the form of lines of two colors simplifies the visual determination of a change
Cryo
Sabina Fik
5 (1)
Cryo is based on the process of identifying the rate of change in price growth and allows you to find entry and exit points from the market. A fundamental technical indicator that allows you to assess the current market situation in order to enter the market of the selected currency pair in a trend and with minimal risk. The Cryo indicator was created on the basis of the original indicators for searching for extremes, the indicator is well suited for determining a reversal or a large sharp jer
The Angle Prices indicator is a tool that calculates the price angle based on price analysis, interpreting the time vector in the form of price points on the price chart. In other words, the X axis and Y axis are represented as price points, so you can actually calculate the angle with two axes of the same dimension. This allows traders to obtain information about the direction of price movement and possible entry or exit points for trades. Let's look at the main characteristics and interpretat
The " Fortune Long " bot works using pending orders and reacts to a channel breakdown with the direction of work in the channel; it is necessary to correctly calculate the levels of entry, stop loss, take profit, and the level of deviation of the pending order from the price. The bot needs to be optimized for 2 years with a forward period of 1/2. Once optimization is complete, select the best settings and save them. Work for 6 months. The bot automatically calculates all levels and the entry le
PricePulse Pro - Indicator of Simple Solutions! Using this indicator is very easy - just follow the colored arrows on the chart. The indicator algorithm takes into account daily price fluctuations and focuses on measuring the "candlestick" share in the trend. This indicator uses an algorithm that considers price changes based on various parameters such as H/C (high price/close), H/O (high price/open), LC (low price/close), LO (low price/open). This allows for a more detailed analysis of price
The "Trend Orbital" indicator is a tool for tracking trends in the financial asset market. It is based on the analysis of price data and provides a visual interpretation of the current direction of price movement. Options: InpAmplitude: Amplitude - determines the amount of volatility that the indicator takes into account when determining the trend. Group "Arrow": InpCodeUpArrow: Up Arrow Code - Defines the arrow symbol to display an uptrend. InpCodeDnArrow: Down Arrow Code - Defines the arrow
The Market Might indicator, despite its apparent simplicity, is based on complex analytical algorithms that allow you to accurately determine the moments of entry and exit from transactions. The signals generated by this indicator are accurate and timely, appearing directly on the current candle. The main task of the Market Might indicator is to determine the moments of entry and exit from trades. Therefore, it displays only the trend line and entry points, which provides a clear view of the m
This technical analysis indicator allows you to determine with high probability whether a trend or a flat pattern prevails in the market. It can be used both for trading within a channel and for breakout trading, provided that stop losses are used to protect against false signals. The indicator displays the channel in the form of lines located above and below the price, like other similar indicators. The upper and lower lines can also act as resistance and support levels. It quite accurately
Balanced Work Indicator: Your Gateway to Trend Trading Balanced Work is a trend-following indicator designed to simplify market analysis and trading decisions. This algorithmic tool draws two-colored dots along the price chart, connected by lines, offering a clear visual representation of market trends. The simplicity of this indicator lies in its color-coded signals: buy when a blue dot appears and sell when a red dot appears. It is particularly effective for scalping and pipsing, and it has p
AD Fix v5
Sabina Fik
The Accumulation/Distribution (AD) Technical Indicator   is a tool used in technical analysis to determine whether an asset is being accumulated (bought) or distributed (sold) in the market. Key Characteristics of the AD Indicator: Purpose:   The AD indicator is used to assess the balance between buying (accumulation) and selling (distribution) of an asset. This helps traders and investors evaluate the strength of the current trend and potential reversals. Interpretation: Rising Indicator:   Whe
AC Fix v5
Sabina Fik
The Accelerator Oscillator (AC) technical indicator measures the acceleration or deceleration of the current market strength. It is designed to identify potential trend reversal points and is used to determine the moment of buying or selling assets. The indicator helps traders make decisions based on changes in market dynamics. This implementation of the indicator is its creative version. Since the standard version is very limited by its built-in settings, this implementation has significantly
AO Fix v5
Sabina Fik
The AO (Accumulation/Distribution) technical indicator is a successful indicator for measuring market dynamics, which reflects specific changes in the market's driving force, which helps determine the strength of a trend, including its formation and reversal points. The AO indicator is a technical analysis tool that will help you trade more effectively. Main characteristics of the AO indicator: Purpose: The AO indicator is used to assess the balance between purchases (accumulation) and sales (di
Ric
Sabina Fik
With this indicator, you can   predict future price behavior   for a certain number of bars ahead, giving you the ability to anticipate market dynamics. The indicator draws a   forecast line , which models potential future price values based on sophisticated algorithms analyzing past data. This information can be leveraged not only for market entry and exit decisions but also for setting or adjusting stop-loss levels to better manage your positions. Application of the Forecast The data provided
AstroBias Indicator: Precision in the Angle of Your Trend The AstroBias Indicator is more than just a trend direction tool. It also tracks the change in the angle of the price slope , allowing traders to filter signals using angular filters . This makes it especially useful for building automated trading bots based on its signal logic. Key Benefits of AstroBias Indicator Highly Sensitive to Price Action AstroBias responds quickly to real-time price movements, providing clear and timely sign
Sonic Edge Meter: Precision for Reversals and Price Surges Sonic Edge Meter is a powerful indicator built on original algorithms for extremum detection . It’s specifically designed to identify market reversals and sharp directional moves , giving you a clear signal before they happen. How Does Sonic Edge Meter Work? The indicator notifies you of potential turning points or price spikes by displaying visual markers directly on the chart: Blue dot — signal to buy Red dot — signal to sell
필터:
리뷰 없음
리뷰 답변