Fusion Signal

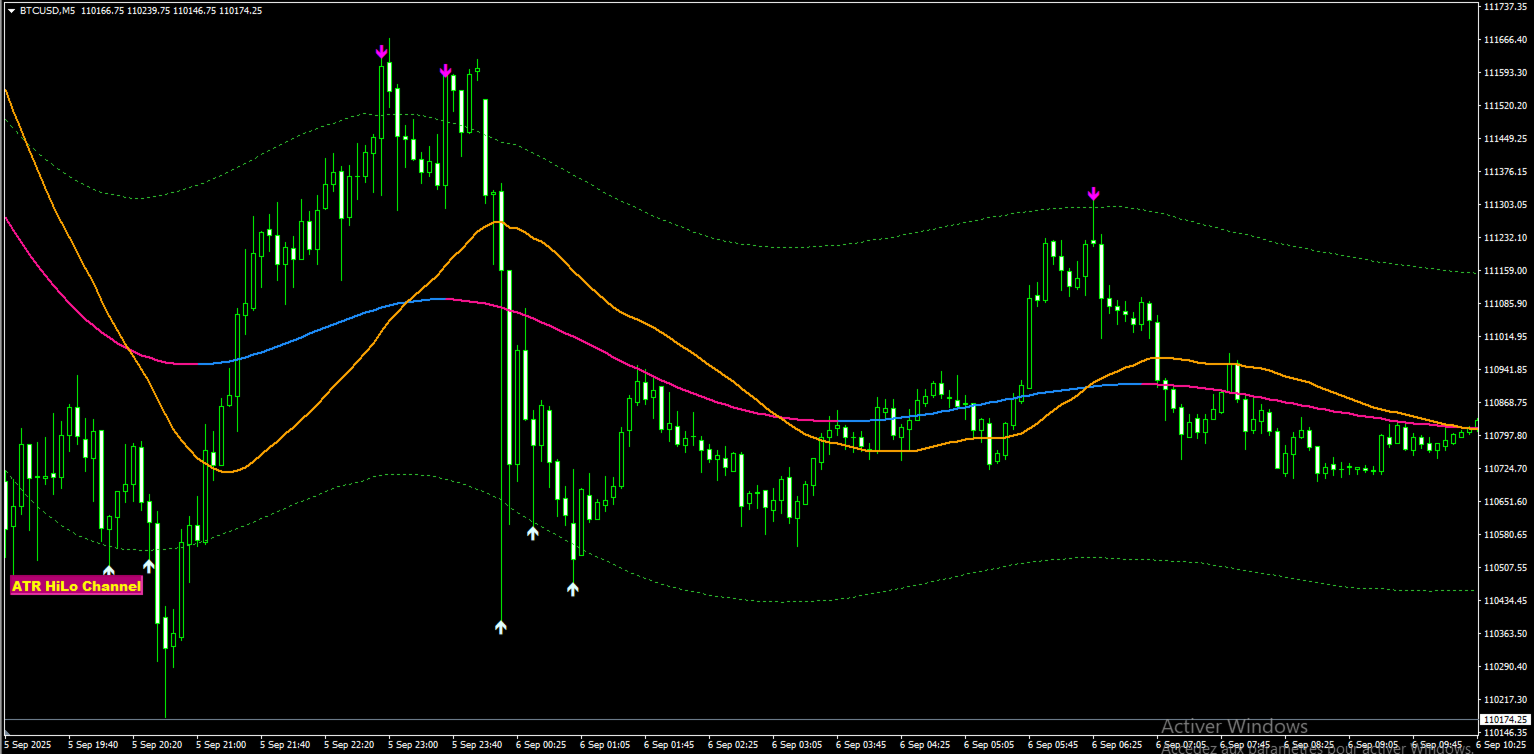
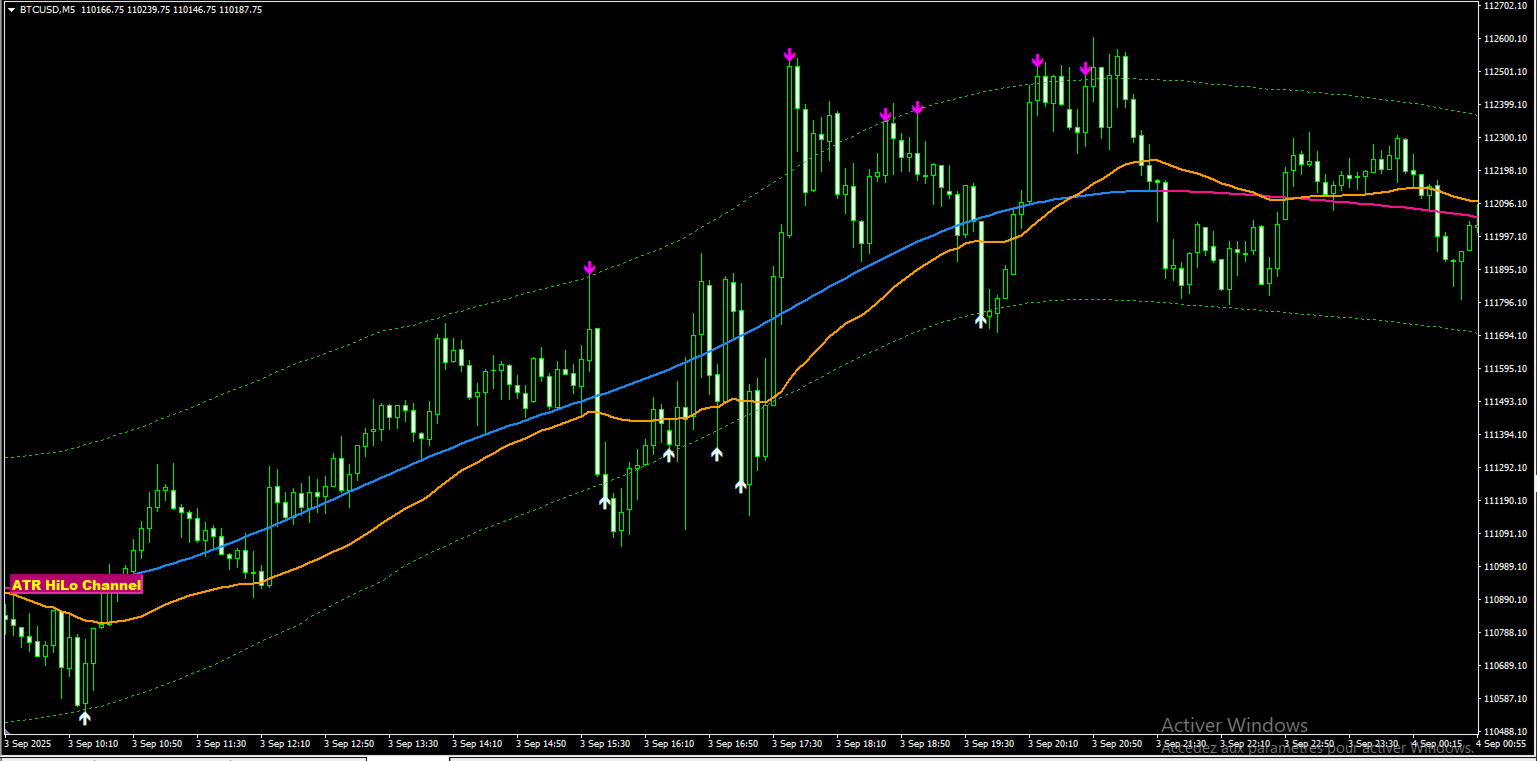
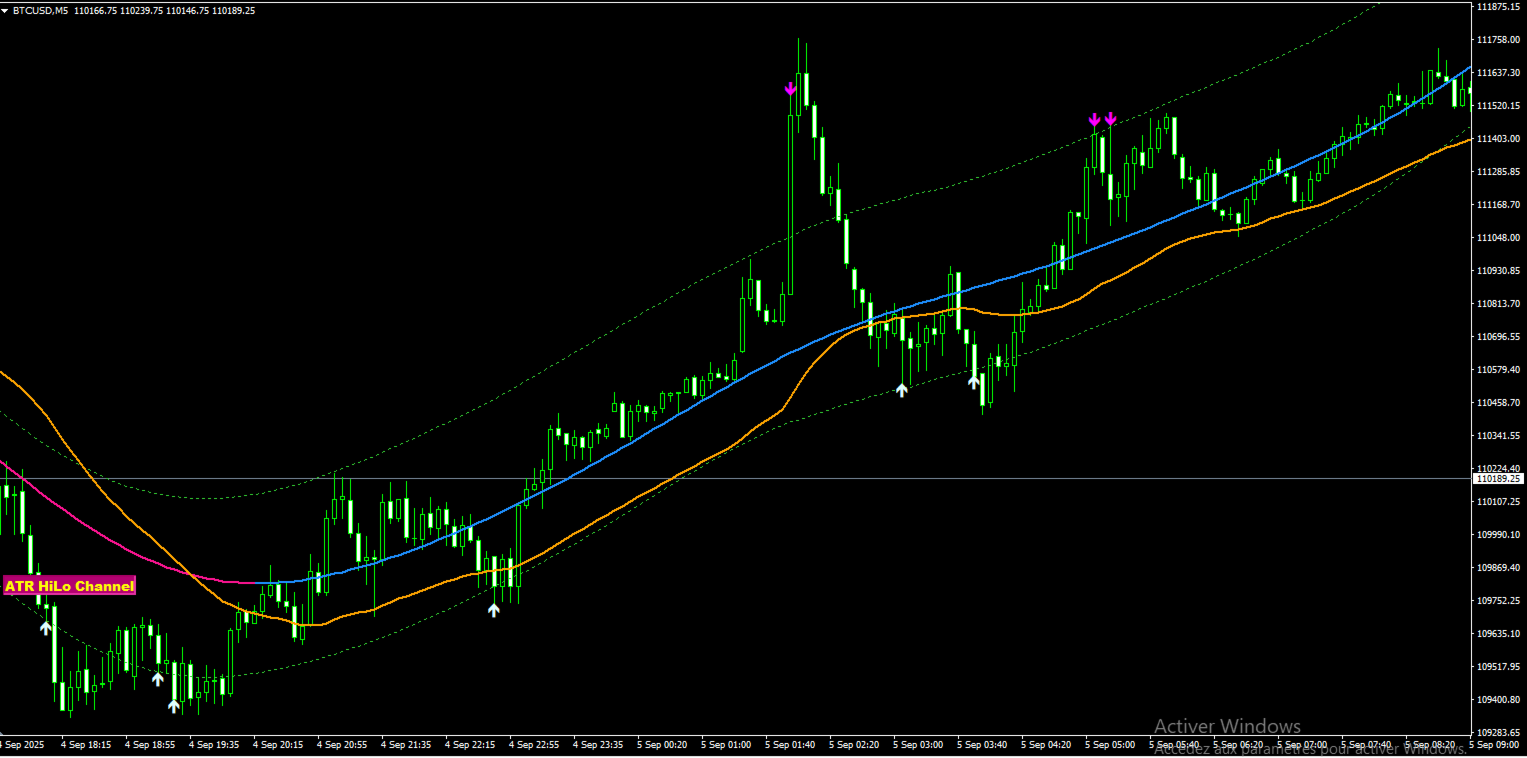
Fusion Signal — ATR HiLo Channel SMP TT (Multi-Timeframe Indicator)

Fusion Signal is an advanced MT4 indicator that blends ATR-based volatility channels with smoothed moving averages and configurable signal arrows. It’s designed to help traders identify trend direction, dynamic support/resistance and actionable breakout/reversal points with multi-timeframe precision. The indicator is highly configurable and suitable for a broad range of instruments (FX, metals, indices) and trading styles (swing / intraday).

Key features

  • ATR HiLo volatility channel: dynamically calculated upper and lower bands around a smoothed central line using ATR × Deviation.

  • Smoothed MA core: central trendline uses LWMA (configurable MA types and periods) with additional smoothing (Length × Cycle processing).

  • Multi-Timeframe (MTF): ability to compute and display channel and signals from a higher or different timeframe on the current chart.

  • Flexible arrow signals: 3 arrow modes — High/Low cross, Close cross, and Center line vs MA cross — with configurable bar offset and arrow style.

  • Real-time alerts: popup, sound (.wav), email and mobile push notifications when arrows generate signals.

  • On-chart interactive button: enable/disable the indicator display quickly without removing it from the chart.

  • Clean DataWindow labels & buffers: dedicated buffers for BUY/SELL trendlines, bands, MA and arrows — useful for automation or EA integration.

  • Full parameter control: history depth, ATR period, deviation multiplier, MTF timeframe, visual styles, arrow codes and sizes, button colors and placement.

Trading logic (overview)

  1. Compute a smoothed primary MA (configurable method & period) and further smooth it by configurable Length and Cycle parameters.

  2. Compute ATR over a configurable ATRPeriod and build upper/lower bands using the Deviation multiplier.

  3. Detect directional slope/phase of the smoothed MA to determine trend bias.

  4. Generate arrow signals when price or highs/lows cross band levels (or when selected MA crossover rules are met).

  5. Optionally propagate MTF values from the selected timeframe to the current chart for higher-timeframe confirmation.

Input parameters (all configurable)

  • History — lookback depth for drawing (default 4567)

  • TimeFrame — source timeframe (PERIOD_CURRENT by default)

  • Lenght — smoothing length (default 13)

  • Cycle — smoothing cycles (default 5)

  • sPeriod — core MA period (default 21)

  • sMode — core MA method (default MODE_LWMA)

  • sPrice — applied price (default PRICE_CLOSE)

  • ATRPeriod — ATR length used for bands (default 250)

  • Deviation — ATR multiplier for band width (default 2.222)

  • ShowChannel — channel display mode (Off / Center / Bands / Full)

  • mPeriod , mMode , mPrice — secondary MA settings (default mPeriod = 55)

  • ARROWBAR — bar offset for arrow detection (default 0)

  • WhichArrows — arrow logic: CrossHL / CrossCC / CrossMA

  • ArrGap , ArrCodeUP , ArrCodeDN , ArrSize — arrow positioning & styling

  • SoundFile — sound to play on alert (default alert2.wav )

  • ALERTBAR — which bar to use for alerts (default 1)

  • Alert toggles: AlertsMessage , AlertsSound , AlertsEmail , AlertsMobile

  • On-chart button: buttColor , buttSize , backColor , axisX , axisY , buttCorner , buttWindow

Recommended settings & usage

  • Recommended pairs: majors (EURUSD, GBPUSD, USDJPY) and XAUUSD (adjust ATR/Deviation accordingly).

  • Recommended timeframes: when ATRPeriod is large (250) use H1 or higher; for lower ATRPeriod use M15/M30. Adjust ATRPeriod and Deviation to match the volatility of the instrument and timeframe.

  • Signal confirmation: prefer trading only when MTF trend (selected TimeFrame) agrees with local signals. Use Stop Loss and proper risk management.

  • Testing: always run extensive backtests and forward tests on demo accounts to tune ATRPeriod , Deviation , sPeriod , mPeriod and arrow logic for your asset and broker.

Installation & notes

  1. Place the .mq4 file into the Indicators folder and compile in MetaEditor.

  2. Attach to your chart and configure the parameters to your preference.

  3. Ensure AlertsEmail and AlertsMobile are correctly set in MT4 options if using email or push notifications.

  4. The indicator exposes buffers for integration; developers can reference them in EAs with iCustom .

What you get

  • Fully commented MT4 indicator source code (.mq4)

  • Easy to customize visual and logic parameters

  • MTF channel & arrow signal system with alerts and on-chart button

Changelog / Version 1.0

  • Initial release: ATR HiLo Channel with MTF, arrows, alerts and on-chart control.

Disclaimer

This indicator is a tool, not a guaranteed profit system. Market conditions, broker execution, spreads and slippage affect real results. Always backtest and demo-test before using with live funds. The author is not responsible for trading losses.


추천 제품
피봇 포인트 Fibo RSJ는 피보나치 비율을 사용하여 당일의 지지선과 저항선을 추적하는 지표입니다. 이 멋진 지표는 피보나치 비율을 사용하여 피벗 포인트를 통해 최대 7단계의 지지와 저항을 생성합니다. 가격이 작업의 가능한 진입/종료 지점을 인식할 수 있는 이 지원 및 저항의 각 수준을 어떻게 존중하는지 환상적입니다. 특징 최대 7단계 지원 및 7단계 저항 레벨의 색상을 개별적으로 설정 입력 피벗 유형 피벗 피보 RSJ1 = 피보 비율 1 계산 피벗 피보 RSJ2 = 피보 비율 2 계산 피벗 Fibo RSJ3 = Fibo 비율 3 계산 피벗 피보 클래식 = 클래식 피벗 계산 최소 피벗 수준 피벗 3 레벨 피벗 4 레벨 피벗 5 레벨 6단계 피벗 피벗 7 레벨 여전히 질문이 있는 경우 다이렉트 메시지로 저에게 연락하십시오: https://www.mql5.com/ko/users/robsjunqueira/
FREE
멀티 타임프레임 지원, 사용자 정의 시각적 신호 및 구성 가능한 알림 시스템을 갖춘 Average True Range(ATR) 지표. 프리랜서 프로그래밍 서비스, 업데이트 및 기타 TrueTL 제품은 제 MQL5 프로필 에서 확인하실 수 있습니다. 피드백과 리뷰는 매우 감사하게 받겠습니다! ATR이란 무엇인가요? J. Welles Wilder가 개발한 Average True Range(ATR)는 시장 변동성을 측정하는 기술 지표입니다. 지정된 기간 동안의 True Range 평균을 계산합니다. True Range는 다음 중 가장 큰 값입니다: 현재 고가에서 현재 저가까지의 거리, 이전 종가에서 현재 고가까지의 거리, 또는 이전 종가에서 현재 저가까지의 거리. ATR은 가격 방향을 나타내지 않습니다 — 오직 변동성만 측정합니다. ATR이 상승하면 변동성 증가를 나타내고, ATR이 하락하면 변동성 감소를 신호합니다. 트레이더들은 ATR을 사용하여 시장 상황을 평가하고, 동적 손절매
FREE
FRM Half Trend
Noiros Tech
3.5 (2)
YOU CAN NOW DOWNLOAD FREE VERSIONS OF OUR PAID INDICATORS . IT'S OUR WAY OF GIVING BACK TO THE COMMUNITY ! >>>    GO HERE TO DOWNLOAD   The system is a free open source pine script originally published on TradingView by everget   . It was converted to Mt4 by Forex Robot Makers. This system is a  popular trend indicator based on ATR ( Average True Range ) , Moving Averages and the Donchian channel . System BackGround ATR The average true range is an indicator of the price volatility of an asse
FREE
Ppr PA
Yury Emeliyanov
4.5 (2)
"Ppr PA" is a unique technical indicator created to identify "PPR" patterns on the currency charts of the MT4 trading platform. These patterns can indicate possible reversals or continuation of the trend, providing traders with valuable signals to enter the market. Features: Automatic PPR Detection:   The indicator automatically identifies and marks PPR patterns with arrows on the chart. Visual Signals:   Green and red arrows indicate the optimal points for buying and selling, respectively. Ar
FREE
How would you like to instantly know what the current trend is? How about the quality of that trend? Finding the trend on a chart can be subjective. The Fractal Trend Finder indicator examines the chart for you and reveals what the current trend is based on objective criteria. Using the Fractal Trend Finder you can easily tell if you are trading with the trend or against it. It also identifies those times when the market is not trending. Theoretically, you could trade with the trend when the tre
FREE
Double HMA lines MTF
Pavel Zamoshnikov
5 (1)
This is a multi-timeframe version of the popular Hull Moving Average (HMA). The Double HMA MTF Light indicator combines two timeframes on a single chart. The HMA of the higher timeframe defines the trend, and the HMA of the current timeframe defines short-term price movements. The indicator is freely distributed and hasn't audio signals or messages. Its main function is the visualization of price movements. If you need advanced functionality of the HMA multi-timeframe indicator (information ab
FREE
Period Breakout Indicator
Komang Putra Riswanjaya
5 (1)
Overview The Period Breakout Indicator is a versatile tool designed for traders seeking to identify breakout opportunities based on customizable time periods. This indicator automatically determines the highest and lowest prices within a user-defined period, allowing you to tailor it precisely to your trading strategy. Key Features Customizable Time Periods: Define the start and end times based on your preferred trading hours or any specific period. The indicator will then calculate the highest
FREE
MT Scanner
Niravkumar Maganbhai Patel
4 (2)
This indicator helps you to Scan symbols which are in the Market Watch Window  and filter out trends with alerts. It works based on the effective indicator "SUPERTREND" which is used by many traders for trading: When box color changes to " Green " or " Red " color, it indicates you for trend change for long and short entry. And also you will get alerted on screen. When it changes to " Green ", it indicates you that trend is going upwards, and you can take the long entry. If the color changes to
FREE
High Trend Lite
Evgeniy Scherbina
1 (1)
The indicator High Trend Lite monitors 5 symbols in up to 3 timeframes simultaneously and calculates the strength of their signals. The indicator notifies you when a signal is the same in different timeframes. The indicator can do this from just one chart. Therefore, High Trend Lite is a multicurrency and multitimeframe indicator. With the High Trend Pro , available at this link , you will have an unlimited number of symbols, 4 timeframes, a colourful chart of the primary MACD indicator, several
FREE
This indicator shows the latest untouched support and resistance as horizontal lines. The indicator can show support/resistance from higher timeframes. With this indicator you can e.g. easily see the support/resistance of the timeframes H4, D1 and W1 on a H1 chart, which can be a big advantage while time your entry on H1. This is the FREE version of the indicator: Support Resistance Multi Time Frame The free version works only on EURUSD and GBPUSD! Parameters referenceTF: the timeframe from whi
FREE
High Low Open Close MT4
Alexandre Borela
4.81 (21)
이 프로젝트를 좋아한다면 5 스타 리뷰를 남겨주세요. 이 지표는 열리고, 높은, 낮은 및 마감 가격을 지정합니다. 기간과 그것은 특정한 시간대를 위해 조정될 수 있습니다. 이들은 많은 기관 및 전문가에 의해 보는 중요한 수준입니다 상인은 당신이 더 많은 것일 수있는 장소를 알고 도움이 될 수 있습니다 이름 * 사용 가능한 기간: 이전 날. 이전 주. 지난 달. 이전 분기. 이전 연도. 또는: 현재 날. 현재 주. 현재 달. 현재 분기. 현재 년.
FREE
WH Price Wave Pattern MT4
Wissam Hussein
4.4 (5)
Welcome to our   Price Wave Pattern   MT4 --(ABCD Pattern)-- The ABCD pattern is a powerful and widely used trading pattern in the world of technical analysis. It is a harmonic price pattern that traders use to identify potential buy and sell opportunities in the market. With the ABCD pattern, traders can anticipate potential price movements and make informed decisions on when to enter and exit trades. EA Version : Price Wave EA MT4 MT5 version : Price Wave Pattern MT5 Features :  Automatic
FREE
GJPivots
David Jumbo
1. Monthly, weekly and daily pivots are calculated with the beginning and ending data for each period. 2. This provides an easy line on the chart to identify where the pivots are and reduces error of calculation. 3. The indicator will help define very quickly the major pivots for the instrument even if you do not understand how to calculate the pivot. 4. You can also compare weekly and daily pivots so that you can better understand the position of price. 5 This indicator will help you trade more
FREE
Hi Low Levels Last Day MT4
Igor Vishnevskii
5 (1)
The free version of the Hi Low Last Day MT4 indicator . The Hi Low Levels Last Day MT4 indicator shows the high and low of the last trading day . The ability to change the color of the lines is available . Try the full version of the Hi Low Last Day MT4 indicator , in which additional indicator features are available : Displaying the minimum and maximum of the second last day Displaying the minimum and maximum of the previous week Sound alert when crossing max . and min . levels Selecting an arb
FREE
Free automatic fibonacci
Tonny Obare
4.67 (49)
Free automatic Fibonacci is an indicator that automatically plots a Fibonacci retracement based on the number of bars you select on the BarsToScan setting in the indicator. The Fibonacci is automatically updated in real time as new highest and lowest values appears amongst the selected bars. You can select which level values to be displayed in the indicator settings. You can also select the color of the levels thus enabling the trader to be able to attach the indicator several times with differe
FREE
High Volume Turns
Noiros Tech
4.38 (8)
YOU CAN NOW DOWNLOAD FREE VERSIONS OF OUR PAID INDICATORS . IT'S OUR WAY OF GIVING BACK TO THE COMMUNITY ! >>>  GO HERE TO DOWNLOAD Most of the time, market reversals / pull backs usually follow volume and price spikes thus  these spikes could be the first indication of an exhaustion and possible reversal/pullback. High volume Turns is an indicator that scans the market for price and volume spikes around over-bought/over-sold market conditions. These spikes when spotted serves as the first indi
FREE
Wise Men Indicator demo
Bohdan Kasyanenko
3 (2)
The indicator displays signals according to the strategy of Bill Williams on the chart. Demo version of the indicator has the same features as the paid, except that it can work only on a demo account . Signal "First Wise Man" is formed when there is a divergent bar with angulation.  Bullish divergent bar - with lower minimum and closing price in the upper half. Bearish divergent bar - higher maximum and the closing price at the bottom half. Angulation is formed when all three lines of Alligator
FREE
ENGLISH DESCRIPTION (MQL5 Standard Optimized) Product Name: Aether Elliott Wave Zigzag Pro (MT4) [Subtitle: Wave 3 Hunter | Fib 0.618 Retracement | Margin Guard] Introduction Aether Elliott Wave Zigzag Pro is a lightweight, market-compliant scalping system designed to automate the classic Elliott Wave theory. Instead of complex wave counting, it uses a precision ZigZag algorithm to identify the high-probability 1-2-3 Structure and targets the Wave 3 impulse. Engineered for MT4 stability, it feat
FREE
TreendLines
Sajjad Karimi
5 (1)
''Trendlines'' is an Indicator, that every Trader need and shows Trendline and  Support and resistance levels in all  Timeframe's. Also In 1-hour, 4-hour and daily time frames and Current timeframes, support, and resistance levels are specified and trend lines are drawn so that the trader can see all levels on a chart.   In   Properties   it is possible to turn off unnecessary Lines.  In ' Tendency indicator '' , as full package of Predictions that every Trader need, there  is also the Predict
FREE
다중 타임프레임 지원, 사용자 정의 시각 신호 및 구성 가능한 알림 시스템을 갖춘 Elder's Force Index(EFI) 지표. 프리랜서 프로그래밍 서비스, 업데이트 및 기타 TrueTL 제품은 제 MQL5 프로필 에서 확인하실 수 있습니다. 피드백과 리뷰를 진심으로 환영합니다! EFI란 무엇인가요? Elder's Force Index(EFI)는 Alexander Elder 박사가 개발한 기술적 지표로, 가격 변화, 방향, 거래량을 결합하여 가격 움직임 뒤의 힘을 측정합니다. 지표는 (종가 - 이전 종가) × 거래량으로 계산되고, 지수 이동 평균(EMA)으로 평활화됩니다. EFI는 제로 라인을 중심으로 진동합니다. 양수 값은 강세력(거래량 지지와 함께 가격 상승)을 나타내고, 음수 값은 약세력(거래량 지지와 함께 가격 하락)을 나타냅니다. 값의 크기는 힘의 강도를 반영합니다. 높은 양수 피크는 강한 매수 압력을 나타내고, 깊은 음수 저점은 강한 매도 압력을 나타냅니다. 제
FREE
This indicator is designed to detect high probability reversal patterns: Double Tops/Bottoms with fake breakouts . This is the FREE version of the indicator: https://www.mql5.com/en/market/product/26371 The free version works only on EURUSD and GBPUSD! Please read also the blog post " Professional Trading With Double Tops/Bottoms And Divergences! " which explains the concepts behind the ULTIMATE Double Top/Bottom indicator and how you can use a professional top-down approach. The provided video
FREE
Extremum Reverse Bar
Yurij Izyumov
2.8 (5)
This indicator has been created for finding the probable reversal points of the symbol price. A small candlestick reversal pattern is used it its operation in conjunction with a filter of extremums. The indicator is not redrawn! If the extremum filter is disabled, the indicator shows all points that have a pattern. If the extremum filter is enabled, the condition works – if the history Previous bars 1 candles back contains higher candles and they are farther than the Previous bars 2 candle, such
FREE
Candle Countdown — MT4용 정확한 캔들 종료 시간 카운트다운 Candle Countdown은 차트 위에 현재 캔들이 종료될 때까지 남은 시간 을 표시하는 간단하고 정확한 도구입니다. 진입 시점이 캔들 마감에 의존하는 경우, 몇 초의 차이도 중요합니다. 이 인디케이터는 정확한 시간을 보여주어 서두르거나 추측하지 않고 결정을 내릴 수 있도록 도와줍니다. 캔들 종료 시간을 정확하게 제어하기 위한 인디케이터입니다. 표시 내용: 캔들 종료까지 남은 시간 현재 서버 시간 스프레드 Stop Level 타이머는 틱에 의존하지 않고 플랫폼의 내부 타이머를 통해 업데이트되므로, 시장 움직임이 적은 상황에서도 안정적으로 동작합니다. 이로 인해 낮은 변동성 구간에서도 부드럽고 안정적인 카운트다운을 제공합니다. 모든 정보는 배경 블록에 표시되어 어떤 차트 색상에서도 잘 보이며, 차트 분석을 방해하지 않습니다. 캔들 종료 시점이 가까워질수록 타이머 색상이 변경되어 빠르게 상황을 파악할 수
FREE
멀티 타임프레임 지원, 맞춤형 시각 신호 및 구성 가능한 알림 시스템을 갖춘 Balance of Power(BOP) 지표. 프리랜서 프로그래밍 서비스, 업데이트 및 기타 TrueTL 제품은 제 MQL5 프로필 에서 이용하실 수 있습니다. 피드백과 리뷰를 대환영합니다! BOP란 무엇인가요? Balance of Power(BOP)는 가격 변화를 바의 범위와 비교하여 매수자 대 매도자의 강도를 측정하는 오실레이터입니다. 지표는 (종가 - 시가) / (고가 - 저가)로 계산된 후 단순 이동 평균(SMA)으로 평활화됩니다. BOP 값은 -1과 +1 사이에서 변동합니다. 양수 값은 매수자가 더 강함을 나타내고(종가가 시가보다 높음), 음수 값은 매도자가 더 강함을 나타냅니다(종가가 시가보다 낮음). 값의 크기는 움직임의 강도를 나타냅니다. BOP는 매수 압력과 매도 압력 사이의 균형을 보여줌으로써 시장 강도와 잠재적인 반전을 식별하는 데 도움이 됩니다. 특징: 화살표 및 수직선을 이용한
FREE
Rule Plotter MT4
Francisco Gomes Da Silva
4.25 (4)
Rule Plotter로 자동 거래 로봇 만들기 마우스 몇 번 클릭만으로 거래 전략을 자동화할 수 있다면 얼마나 강력할까요? 복잡한 코드를 파헤치지 않고도 다양한 거래 전략을 만들고 테스트할 수 있다면 얼마나 자유로울까요. Rule Plotter를 사용하면 이러한 비전을 현실로 만들 수 있습니다. 여기서는 Rule Plotter를 사용하여 사용자 정의 거래 로봇을 만드는 방법을 살펴보겠습니다. Rule Plotter는 전체 프로세스를 단순화하는 거래 시스템 생성 도구입니다. Rule Plotter란 무엇이며 어떻게 작동합니까? Rule Plotter는 MetaTrader의 지표를 사용하여 전문가 자문자 (EA)를 작성하기 위해 설계된 프로그램입니다. 이 도구를 사용하면 복잡한 프로그래밍 세부 사항을 이해하지 않고도 거래 전략을 자동화할 수 있습니다. 프로세스는 간단합니다. 원하는 지표를 차트에 추가하고 진입 및 종료 조건을 정의한 다음 Rule Plotter에게 나머지 일을 맡기면
FREE
멀티 타임프레임 지원, 사용자 정의 시각 신호 및 구성 가능한 알림 시스템을 갖춘 Chaikin Money Flow(CMF) 지표. 프리랜서 프로그래밍 서비스, 업데이트 및 기타 TrueTL 제품은 제 MQL5 프로필 에서 이용 가능합니다. 피드백과 리뷰를 매우 환영합니다! CMF란? Chaikin Money Flow(CMF)는 Marc Chaikin이 개발한 거래량 가중 모멘텀 지표로, 지정된 기간 동안의 매수 및 매도 압력을 측정합니다. 지표는 각 기간의 Money Flow Multiplier를 계산하고 룩백 기간에 걸쳐 가중 평균을 생성합니다. CMF는 +1에서 -1 사이에서 진동하며, 양수 값은 매수 압력(축적)을, 음수 값은 매도 압력(분배)을 나타냅니다. 0 이상의 값은 시장이 축적 단계에 있음을 나타내고, 0 이하의 값은 분배를 나타냅니다. 지표는 가격과 거래량 간의 관계를 분석하여 트렌드 강도를 확인하고 잠재적 반전을 식별하는 데 도움을 줍니다. 기능: 화살표와
FREE
Two Period RSI
Libertas LLC
5 (4)
Two Period RSI compares long-term and short-term RSI lines, and plots a fill between them for improved visualization. Fill is colored differently according to an uptrend (short period RSI above long period RSI) or a downtrend (short period RSI below long period RSI). Short-term RSI crossing long-term RSI adds a more robust trend confirmation signal than using single period RSI alone. This is a small tool to help visualize and confirm RSI trends. We hope you enjoy! Looking for RSI alerts? You can
FREE
Squeeze Box
Sinan Durkan
**Squeeze Box Indicator**   Squeeze Box  is a powerful technical analysis indicator developed for the MetaTrader 4 platform, designed to support day trading strategies. This indicator analyzes market movements to detect bullish and bearish breakout signals, enabling traders to capture trends early. With its customizable features and user-friendly interface, it is ideal for both novice and experienced traders. ### Features and Functions - **Bullish and Bearish Signals**: Identifies market break
FREE
Follow The Line
Oliver Gideon Amofa Appiah
3.94 (16)
FOLLOW THE LINE GET THE FULL VERSION HERE: https://www.mql5.com/en/market/product/36024 This indicator obeys the popular maxim that: "THE TREND IS YOUR FRIEND" It paints a GREEN line for BUY and also paints a RED line for SELL.  It gives alarms and alerts of all kinds. IT DOES NOT REPAINT and can be used for all currency pairs and timeframes. Yes, as easy and simple as that. Even a newbie can use it to make great and reliable trades. NB: For best results, get my other premium indicators for more
FREE
MT4 vAccount Protector Basic Account Protector Basic is a streamlined risk management tool for MetaTrader 4 (MT4) that helps traders safeguard their accounts with clear, customizable limits. Designed for simplicity and reliability, it ensures that trading remains disciplined and capital is protected. This EA closes all trades once the maximum loss is reached either in value or account percentage. It is especially useful for those trading prop funds account. Key Features: Loss Selection You can
FREE
이 제품의 구매자들이 또한 구매함
Gann Made Easy
Oleg Rodin
4.83 (156)
Gann Made Easy 는 mr.의 이론을 사용하여 최고의 거래 원칙을 기반으로 하는 전문적이고 사용하기 쉬운 Forex 거래 시스템입니다. W.D. 간. 이 표시기는 Stop Loss 및 Take Profit Levels를 포함하여 정확한 BUY 및 SELL 신호를 제공합니다. PUSH 알림을 사용하여 이동 중에도 거래할 수 있습니다. 구매 후 거래 방법 안내 및 유용한 추가 지표를 무료로 받으시려면 저에게 연락주세요! 아마도 Gann 거래 방법에 대해 이미 여러 번 들었을 것입니다. 일반적으로 Gann의 이론은 초보자 거래자뿐만 아니라 이미 거래 경험이 있는 사람들에게도 매우 복잡한 것입니다. Gann의 거래 방식은 이론적으로 적용하기 쉽지 않기 때문입니다. 나는 그 지식을 연마하고 Forex 지표에 최고의 원칙을 적용하기 위해 몇 년을 보냈습니다. 표시기는 적용하기가 매우 쉽습니다. 차트에 첨부하고 간단한 거래 권장 사항을 따르기만 하면 됩니다. 지표는 지속적으로 시장 분석
Scalper Inside PRO
Alexey Minkov
4.74 (69)
An exclusive indicator that utilizes an innovative algorithm to swiftly and accurately determine the market trend. The indicator automatically calculates opening, closing, and profit levels, providing detailed trading statistics. With these features, you can choose the most appropriate trading instrument for the current market conditions. Additionally, you can easily integrate your own arrow indicators into Scalper Inside Pro to quickly evaluate their statistics and profitability. Scalper Inside
M1 Sniper
Oleg Rodin
5 (20)
M1 SNIPER 는 사용하기 쉬운 거래 지표 시스템입니다. M1 시간대에 맞춰 설계된 화살표 지표입니다. 이 지표는 M1 시간대 스캘핑을 위한 단독 시스템으로 사용할 수 있으며, 기존 거래 시스템의 일부로도 사용할 수 있습니다. 이 거래 시스템은 M1 시간대 거래용으로 특별히 설계되었지만, 다른 시간대에도 사용할 수 있습니다. 원래는 XAUUSD와 BTCUSD 거래를 위해 이 방법을 설계했지만, 다른 시장 거래에도 유용하다는 것을 알게 되었습니다. 이 지표의 신호는 추세 방향과 반대로 거래될 수 있습니다. 저는 지표의 신호를 활용하여 양방향으로 거래할 수 있도록 돕는 특별한 거래 기법을 알려드립니다. 이 방법은 특별한 동적 지지선과 저항선 가격 영역을 활용하는 것을 기반으로 합니다. 구매하시면 M1 SNIPER 화살표 지표를 바로 다운로드하실 수 있습니다. 또한, 아래 스크린샷에 표시된 Apollo Dynamic SR 지표는 M1 SNIPER 도구를 사용하는 모든 사용자에게 무료로
Atomic Analyst
Issam Kassas
5 (4)
우선적으로 언급할 점은이 거래 지표가 다시 그리지 않고 지연되지 않으며 이를 통해 수동 및 로봇 거래 모두에 이상적이라는 점입니다. 사용자 매뉴얼: 설정, 입력 및 전략. Atomic Analyst는 가격의 강도와 모멘텀을 활용하여 시장에서 더 나은 이점을 찾는 PA Price Action Indicator입니다. 고급 필터를 장착하여 잡음과 거짓 신호를 제거하고 거래 잠재력을 높이는 데 도움이 됩니다. 복잡한 지표의 다중 레이어를 사용하여 Atomic Analyst는 차트를 스캔하고 복잡한 수학적 계산을 간단한 신호와 색상으로 변환하여 초보 트레이더가 이해하고 일관된 거래 결정을 내릴 수 있도록합니다. "Atomic Analyst"는 새로운 및 경험이 풍부한 트레이더를위한 종합적인 거래 솔루션입니다. 프리미엄 지표와 최고 수준의 기능을 하나의 거래 전략에 결합하여 모든 종류의 트레이더에 대한 다재다능한 선택지가되었습니다. 인트라데이 거래 및 스캘핑 전략 : 빠르고 정확한 일일
Trend Screener
STE S.S.COMPANY
4.79 (95)
트렌드 표시기, 트렌드 트레이딩 및 필터링을 위한 획기적인 고유 솔루션, 하나의 도구 안에 내장된 모든 중요한 트렌드 기능! Forex, 상품, 암호 화폐, 지수 및 주식과 같은 모든 기호/도구에 사용할 수 있는 100% 다시 칠하지 않는 다중 시간 프레임 및 다중 통화 표시기입니다. 기간 한정 특가: 지원 및 저항 스크리너 지표는 단 100달러에 평생 제공됩니다. (원래 가격 50 달러) (제안 연장) Trend Screener는 차트에 점이 있는 화살표 추세 신호를 제공하는 효율적인 지표 추세 추종 지표입니다. 추세 분석기 표시기에서 사용할 수 있는 기능: 1. 트렌드 스캐너. 2. 최대 이익 분석이 있는 추세선. 3. 추세 통화 강도 측정기. 4. 경고가 있는 추세 반전 점. 5. 경고가 있는 강력한 추세 점. 6. 추세 화살표 Trend Screener Indicator가 있는 일일 분석 예, 일일 신호 성능...등은 여기에서 찾을 수 있습니다.   여기를 클릭하십시오. L
Linear Trend Predictor - 진입 지점과 방향성 지원선을 결합한 추세 지표입니다. 고가/저가 채널을 돌파하는 원칙에 따라 작동합니다. 지표 알고리즘은 시장 노이즈를 걸러내고 변동성과 시장 역학을 고려합니다. 표시기 기능  평활화 방법을 사용하여 시장 추세와 BUY 또는 SELL 주문을 시작하기 위한 진입 시점을 보여줍니다.  모든 기간의 차트를 분석하여 단기 및 장기 시장 움직임을 파악하는 데 적합합니다.  어떠한 시장과 시간대에도 적용할 수 있으며, 입력 매개변수를 통해 거래자는 자신에게 맞게 지표를 독립적으로 사용자 지정할 수 있습니다.  설정된 지표 신호는 사라지거나 다시 그려지지 않습니다. 이는 캔들 마감 시 결정됩니다.  여러 유형의 알림이 화살표와 결합되어 있습니다.  이 지표는 독립적인 거래 시스템으로 사용할 수도 있고, 다른 거래 시스템에 추가하는 용도로도 사용할 수 있습니다.  모든 수준의 경험을 가진 거래자가 사용할 수 있습니다. 주요 매
Market Makers
Mohamed Hassan
5 (2)
After purchase, contact me privately to receive 7 days of free testing with EA Forex Proton. This advanced MT4 trading robot automatically executes signals from any MT4 indicator, including Market Makers. The latest version also includes AI integration, allowing each trade signal to be analyzed using Artificial Intelligence. Market Makers is a powerful price action trading system designed to identify high-probability Buy and Sell opportunities based on market momentum, volatility, and price po
Trend Lines PRO
Roman Podpora
5 (1)
트렌드 라인즈 프로       이 지표는 시장이 실제로 어떤 방향으로 전환되는지 파악하는 데 도움이 됩니다. 실제 추세 반전 지점과 주요 시장 참여자들이 다시 진입하는 지점을 보여줍니다. 보시다시피       BOS 라인       복잡한 설정이나 불필요한 노이즈 없이 더 높은 시간대의 추세 변화와 주요 레벨을 확인할 수 있습니다. 신호는 차트에 다시 그려지지 않고 캔들이 마감된 후에도 계속 표시됩니다. VERSION MT 5   -   RFI LEVELS PRO   표시기   와 결합할 때 최대 잠재력을 발휘합니다. 지표가 보여주는 내용: 실제 변화       추세(BOS 라인) 한 번 신호가 나타나면 그 신호는 계속 유효합니다! 이는 신호를 발생시킨 후 변경될 수 있는 리페인팅 방식의 지표와 중요한 차이점입니다. 리페인팅 방식의 지표는 잠재적으로 자금 손실로 이어질 수 있습니다. 이제 더욱 높은 확률과 정확도로 시장에 진입할 수 있습니다. 또한 화살표가 나타난 후 목표가(익절)
GOLD Impulse with Alert
Bernhard Schweigert
4.67 (12)
이 지표는 Advanced Currency IMPULSE with ALERT  +   Currency Strength Exotics  의 2가지 제품의 슈퍼 조합입니다. 그것은 모든 시간 프레임에 대해 작동하며 8개의 주요 통화와 하나의 기호에 대한 강약의 충동을 그래픽으로 보여줍니다! 이 표시기는 금, 이국적인 쌍, 상품, 지수 또는 선물과 같은 기호에 대한 통화 강도 가속을 표시하는 데 특화되어 있습니다. 금, 은, 오일, DAX, US30, MXN, TRY, CNH 등의 진정한 통화 강도 가속(충동 또는 속도)을 표시하기 위해 9번째 줄에 모든 기호를 추가할 수 있습니다. 새로운 기본 알고리즘을 기반으로 구축되어 잠재적인 거래를 훨씬 더 쉽게 식별하고 확인할 수 있습니다. 이는 통화의 강세 또는 약세가 가속되는지 여부를 그래픽으로 표시하고 가속 속도를 측정하기 때문입니다. 자동차의 속도계처럼 생각하면 됩니다. 가속화할 때 Forex 시장에서 동일한 일이 분명히 더 빠르
Dynamic Scalper System
Vitalyi Belyh
5 (1)
" Dynamic Scalper System " 지표는 추세 파동 내에서 스캘핑 방식으로 거래하도록 설계되었습니다. 주요 통화쌍 및 금에서 테스트되었으며, 다른 거래 상품과의 호환성이 가능합니다. 추가적인 가격 변동 지원을 통해 추세에 따라 단기 포지션 진입 신호를 제공합니다. 지표의 원리 큰 화살표는 추세 방향을 결정합니다. 작은 화살표 형태의 스캘핑 신호를 생성하는 알고리즘은 추세 파동 내에서 작동합니다. 빨간색 화살표는 상승 방향을, 파란색 화살표는 하락 방향을 나타냅니다. 민감한 가격 변동선은 추세 방향으로 그려지며, 작은 화살표의 신호와 함께 작용합니다. 신호는 다음과 같이 작동합니다. 적절한 시점에 선이 나타나면 진입 신호가 형성되고, 선이 있는 동안 미결제 포지션을 유지하며, 완료되면 거래를 종료합니다. 권장되는 작업 시간대는 M1~H4입니다. 화살표는 현재 캔들에 형성되며, 다음 캔들이 이미 시작되었더라도 이전 캔들의 화살표는 다시 그려지지 않습니다. 입력 매개
Quantum Breakout Indicator PRO
Bogdan Ion Puscasu
4.96 (26)
소개       Quantum Breakout PRO   , 브레이크아웃 존 거래 방식을 변화시키는 획기적인 MQL5 지표! 13년 이상의 거래 경험을 가진 숙련된 트레이더 팀이 개발한   Quantum Breakout PRO는   혁신적이고 역동적인 브레이크아웃 영역 전략으로 거래 여정을 새로운 차원으로 끌어올리도록 설계되었습니다. Quantum Breakout Indicator는 5개의 이익 목표 영역이 있는 브레이크아웃 영역의 신호 화살표와 브레이크아웃 상자를 기반으로 한 손절 제안을 제공합니다. 초보자 거래자와 전문 거래자 모두에게 적합합니다. Quantum EA 채널:       여기를 클릭하세요 MT5 버전 :   여기를 클릭하세요 중요한! 구매 후 설치 매뉴얼을 받으려면 개인 메시지를 보내주십시오. 추천: 기간: M15 통화쌍: GBPJPY, EURJPY, USDJPY,NZDUSD, XAUUSD 계정 유형: 스프레드가 매우 낮은 ECN, Raw 또는 Razo
MetaForecast M4
Vahidreza Heidar Gholami
5 (2)
MetaForecast는 가격 데이터의 조화를 기반으로 모든 시장의 미래를 예측하고 시각화합니다. 시장이 항상 예측 가능한 것은 아니지만 가격에 패턴이 있다면 MetaForecast는 가능한 정확하게 미래를 예측할 수 있습니다. 다른 유사한 제품과 비교했을 때, MetaForecast는 시장 동향을 분석하여 더 정확한 결과를 생성할 수 있습니다. 입력 매개변수 Past size (과거 크기) MetaForecast가 미래 예측을 생성하기 위한 모델을 만드는 데 사용하는 막대의 수를 지정합니다. 모델은 선택한 막대 위에 그려진 노란색 선으로 표시됩니다. Future size (미래 크기) 예측해야 할 미래 막대의 수를 지정합니다. 예측된 미래는 핑크색 선으로 표시되며 그 위에 파란색 회귀선이 그려집니다. Degree (차수) 이 입력은 MetaForecast가 시장에서 수행할 분석 수준을 결정합니다. Degree 설명  0 차수 0의 경우, "Past size" 입력에 모든 봉우리와
Currency Strength Exotics
Bernhard Schweigert
4.88 (33)
현재 20% 할인! 초보자 또는 전문가 트레이더를 위한 최고의 솔루션! 이 표시기는 Exotic Pairs Commodities, Indexes 또는 Futures와 같은 기호에 대한 통화 강도를 표시하는 데 특화되어 있습니다. 금, 은, 석유, DAX, US30, MXN, TRY, CNH 등의 진정한 통화 강도를 보여주기 위해 9번째 줄에 모든 기호를 추가할 수 있습니다. 이것은 독특하고 고품질이며 저렴한 거래 도구입니다. 우리는 많은 독점 기능과 새로운 공식을 통합했습니다. 새로운 추세 또는 스캘핑 기회의 정확한 트리거 포인트를 정확히 찾아낼 수 있기 때문에 거래가 어떻게 개선될지 상상해 보십시오. 사용 설명서: 여기를 클릭 https://www.mql5.com/en/blogs/post/708876 모든 시간대에 작동합니다. TREND를 빠르게 확인할 수 있습니다! 새로운 기본 알고리즘을 기반으로 설계되어 잠재적인 거래를 더욱 쉽게 식별하고 확인할 수 있습니다. 8개의
Reversal Master
Alexey Minkov
4.8 (15)
The Reversal Master is an indicator for determining the current direction of price movement and reversal points. The indicator will be useful for those who want to see the current market situation better. The indicator can be used as an add-on for ready-made trading systems, or as an independent tool, or to develop your own trading systems. The Reversal Master indicator, to determine the reversal points,  analyzes a lot of conditions since the combined analysis gives a more accurate picture of t
Scalper Vault
Oleg Rodin
5 (36)
Scalper Vault 는 성공적인 스캘핑에 필요한 모든 것을 제공하는 전문 스캘핑 시스템입니다. 이 표시기는 외환 및 바이너리 옵션 거래자가 사용할 수 있는 완전한 거래 시스템입니다. 권장 시간 프레임은 M5입니다. 시스템은 추세 방향으로 정확한 화살표 신호를 제공합니다. 또한 상단 및 하단 신호와 Gann 시장 수준을 제공합니다.  이 시스템은 사용하기가 매우 쉽습니다. 원하는 시장 지역의 화살표만 따라가면 됩니다. 엑시트는 가격이 적정 수준에 도달하거나 시장의 고점 또는 저점 신호가 나타날 때 수행됩니다.  표시기는 PUSH 알림을 포함한 모든 유형의 경고를 제공합니다. 인디케이터 구매 후 연락주세요. 내 개인 거래 권장 사항과 훌륭한 보너스 지표를 무료로 공유합니다! 나는 당신에게 행복하고 유익한 거래를 기원합니다!
Route Lines Prices - 은 가격 방향을 찾는 데 사용되는 지표입니다. 간단한 인터페이스에는 가격 움직임 및 미래 방향 계산을 위한 다양한 알고리즘이 포함되어 있습니다. 이러한 알고리즘에는 사용된 시간대에 따른 변동성 계산 및 가격 평활화 기능이 있습니다. 이 지표는 " Calculating price values " 값을 변경하는 단일 매개변수를 제공합니다. 기본값인 1은 균형 잡힌 자동 계산을 제공하며, 별도의 설정 없이 바로 사용할 수 있습니다. 2에서 500 사이의 값을 수동으로 변경하여 자신만의 거래 시스템에 맞게 지표를 맞춤 설정할 수 있습니다. 이 지표는 M1부터 H4까지의 시간대에서 사용을 권장합니다. 모든 거래 상품에 적용 가능합니다. 신호 화살표는 캔들 종가에 생성되며, 과거 차트에는 다시 그려지지 않습니다. 메인 차트에 동일한 화살표가 표시됩니다. 다양한 유형의 알림을 사용할 수 있으며, 내장된 라인 궤적 카운터는 종가를 기반으로 작동합니다. 이는
CRT Multi-Timeframe Market Structure & Liquidity Sweep Indicator Non-Repainting | Multi-Asset | MT5 Version Available MT5 Version:   https://www.mql5.com/en/market/product/162075 Full User Guide — explains what each feature does and why:   https://www.mql5.com/en/blogs/post/767525 Quick Start User Guide  — explains how to configure and in what order:  https://www.mql5.com/en/blogs/post/767540 Indicator Overview CRT Ghost Candle HTF Fractal is a complete institutional-grade market structure too
Currency Strength Wizard
Oleg Rodin
4.85 (59)
통화 강도 마법사는 성공적인 거래를 위한 올인원 솔루션을 제공하는 매우 강력한 지표입니다. 표시기는 여러 시간 프레임의 모든 통화 데이터를 사용하여 이 또는 해당 외환 쌍의 힘을 계산합니다. 이 데이터는 특정 통화의 힘을 확인하는 데 사용할 수 있는 사용하기 쉬운 통화 지수 및 통화 전력선의 형태로 표시됩니다. 필요한 것은 거래하려는 차트에 표시기를 부착하는 것뿐입니다. 표시기는 거래하는 통화의 실제 강세를 보여줍니다. 지표는 또한 추세와 거래할 때 유리하게 사용할 수 있는 구매 및 판매 거래량 압력의 극한값을 보여줍니다. 지표는 또한 피보나치에 기반한 가능한 대상을 보여줍니다. 표시기는 PUSH 알림을 포함한 모든 유형의 알림을 제공합니다. 구매 후 연락주세요. 나는 당신과 거래 팁을 공유하고 당신에게 무료로 훌륭한 보너스 지표를 줄 것입니다! 나는 당신에게 행복하고 유익한 거래를 기원합니다!
BlueDigitsFx Easy 1 2 3 System
Ziggy Janssen
4.87 (299)
MT5 버전은 여기에서 이용 가능합니다: https://www.mql5.com/en/market/product/50048 텔레그램 채널 & 그룹: https://t.me/bluedigitsfx V.I.P 그룹 접속: 유료 제품 구매 증빙을 메시지로 보내주세요 추천 브로커: https://bit.ly/BlueDigitsFxStarTrader BlueDigitsFx Easy 123 System — MT4용 강력한 반전 및 돌파 감지 시스템 초보자와 전문가 모두를 위한, 시장 구조 변화, 돌파 및 추세 반전을 쉽고 명확하게 감지할 수 있는 올인원 논리 재도색 방지(Non-Repaint) 인디케이터입니다. 이 인디케이터는 "123" 패턴을 따릅니다: 1단계: 잠재적 과매수/과매도 지점에서 큰 화살표로 새로운 고점 또는 저점을 식별 2단계: 구조가 깨졌음을 신호로 보내 추세 반전 가능성을 확인 3단계: 작은 화살표와 지지/저항 점으로 진입 신호를 확정 참고: 큰 화살표는 봉이 종료될
Auto Optimized Parabolic RSI: 고급 3D 모멘텀 엔진 대부분의 개인 투자자용 보조지표는 시장의 변동성이 변하는 순간 무용지물이 되는 정적인 입력값에 의존하기 때문에 실패합니다. Auto Optimized Parabolic RSI는 자체적인 수학적 우위를 지속적으로 재계산하여 "보조지표 노후화" 문제를 해결하며, 기관급 퀀트 트레이딩의 적응력을 귀하의 MT5 터미널에 직접 제공합니다. 핵심 이점: 맞춤형 인메모리 3D 최적화   표준 자동 최적화 도구들은 일반적인 보조지표 호출로 터미널에 과부하를 일으켜 MT5 플랫폼을 멈추게 하는 경우가 많습니다. 이 도구는 이러한 병목 현상을 완전히 우회합니다. 맞춤형 네이티브 RAM 기반 계산기로 구축된 내부 엔진은 차트를 로드하거나 타임프레임을 변경할 때마다 빛처럼 빠른 3D 그리드 검색을 실행합니다. RSI 기간(주기), SAR 스텝(가속도) 및 SAR 최대치(속도 제한)를 동시에 스캔하여 플랫폼 지연 없이 수만 개의
Advanced Supply Demand
Bernhard Schweigert
4.91 (299)
현재 40% 할인! 초보자나 전문 트레이더를 위한 최고의 솔루션! 이 보조지표는 우리가 다수의 독창적 기능과 새로운 공식을 통합한 독특하고 고품질이며 저렴한 거래 도구입니다. 이 업데이트를 통해 이중 시간대를 표시할 수 있습니다. 더 높은 TF를 표시할 수 있을 뿐만 아니라 차트 TF와 더 높은 TF 모두를 표시할 수 있습니다: 중첩 영역 표시. 모든 Supply Demand 트레이더들이 좋아할 것입니다. :) 중요한 정보 공개 Advanced Supply Demand의 잠재력을 극대화하려면 다음을 방문하십시오. https://www.mql5.com/ko/blogs/post/720245   진입 또는 목표의 명확한 트리거 포인트를 정확히 찾아냄으로 해서 거래가 어떻게 개선될지 상상해 보십시오. 새로운 알고리즘을 기반으로 매수자와 매도자 간의 잠재적인 불균형을 훨씬 더 쉽게 분간할 수 있습니다. 왜냐하면 가장 강한 공급영역과 가장 강한 수요 영역과 과거에 어떻게 진행 되었는지를(이전
Super Signal Market Slayer 비재페인트 | 고정확도 | 멀티 마켓 지능형 추세 지표 트레이딩에서 진짜 어려운 것은 주문이 아니라, 시장 변동 속에서 추세가 시작되는 순간을 정확히 파악하는 것입니다. Market Slayer 는 이를 위해 만들어졌습니다. 이 지표는 데이 트레이딩을 위해 설계된 비재페인트 지능형 지표입니다. 다중 확인 및 추세 필터링을 통해 중요한 시점에서만 명확하고 신뢰할 수 있는 Buy / Sell 신호를 제공합니다. 핵심 장점 비재페인트 신호 한 번 생성된 신호는 이동하거나 사라지지 않습니다. 고정확도 추세 판단 다양한 종목에서 테스트되었으며, 특히 골드 M5 / M15에서 안정적인 성과를 보입니다. 멀티 마켓 지원 골드, 외환, 지수, 주요 암호화폐 지원. 데이 트레이딩 최적화 M5, M15에 집중하여 노이즈를 줄이고 실행력을 향상. 직관적 구조 초보자도 쉽게 이해하고 사용할 수 있습니다. 기술 로직 요약 Market Slayer 는 단일
Super Reversal Indicator with Alert 개요 Super Reversal Indicator with Alert는 다중 시간 프레임 분석을 기반으로, 스토캐스틱 모멘텀, 수요와 공급 영역, 그리고 가격 반전 신호를 결합하여 높은 확률의 시장 반전 기회를 식별하도록 설계된 트레이딩 도구입니다. 이 지표는 명확한 시각적 신호와 실시간 알림을 통해 트레이더가 시장의 전환 지점을 쉽게 파악할 수 있도록 도와줍니다. 주요 기능 다중 시간 프레임 스토캐스틱 분석 상위 시간 프레임의 스토캐스틱 오실레이터 사용 (사용자 설정 가능) 모멘텀 변화 및 교차 신호 감지 정밀한 진입을 위한 과매수 및 과매도 구간 제공 반전 리젝션 신호 주요 가격 구간에서 강한 리젝션 캔들 감지 다음 위치에서의 반전 식별 일일 고점 (매도 반전) 일일 저점 (매수 반전) 차트에 화살표로 표시하여 직관적인 확인 가능 수요 및 공급 영역 H4 및 D1 시간 프레임에서 주요 영역 자동 표시 다음 영역 강조
Stratos Pali
Michela Russo
4.43 (7)
Stratos Pali Indicator   is a revolutionary tool designed to enhance your trading strategy by accurately identifying market trends. This sophisticated indicator uses a unique algorithm to generate a complete histogram, which records when the trend is Long or Short. When a trend reversal occurs, an arrow appears, indicating the new direction of the trend. Important Information Revealed Leave a review and contact me via mql5 message to receive My Top 5 set files for Stratos Pali at no cost! Dow
Dynamic Forex28 Navigator
Bernhard Schweigert
4.43 (7)
Dynamic Forex28 Navigator - 차세대 외환 거래 도구. 현재 49% 할인. Dynamic Forex28 Navigator는 오랫동안 인기 있는 지표의 진화형으로, 세 가지의 힘을 하나로 결합했습니다. 고급 통화 Strength28 지표(695개 리뷰) + 고급 통화 IMPULSE with ALERT(520개 리뷰) + CS28 콤보 신호(보너스). 지표에 대한 자세한 정보 https://www.mql5.com/en/blogs/post/758844 차세대 Strength 지표는 무엇을 제공합니까?  원래 지표에서 좋아했던 모든 것이 새로운 기능과 더 높은 정확도로 강화되었습니다. 주요 기능: 독점적인 통화 Strength 공식.  모든 시간대에 걸쳐 부드럽고 정확한 강도선. 추세와 정확한 진입을 식별하는 데 이상적입니다. 역동적인 시장 피보나치 수준(시장 피보나치).  이 지표에만 있는 고유한 기능. 가격 차트가 아닌 통화 강도에 피보나치가 적용됩니다.
현재 40% 할인 ! 초보자 또는 전문가 트레이더를 위한 최고의 솔루션! 이 대시보드 소프트웨어는 28개의 통화 쌍에서 작동합니다. 2가지 주요 지표(Advanced Currency Strength 28 및 Advanced Currency Impulse)를 기반으로 합니다. 전체 Forex 시장에 대한 훌륭한 개요를 제공합니다. 고급 통화 강도 값, 통화 이동 속도 및 모든(9) 시간대의 28 Forex 쌍에 대한 신호를 보여줍니다. 추세 및/또는 스캘핑 기회를 정확히 파악하기 위해 차트의 단일 지표를 사용하여 전체 시장을 볼 수 있을 때 거래가 어떻게 개선될지 상상해 보십시오! 잠재적인 거래를 식별하고 확인하면서 강력한 통화와 약한 통화를 더욱 쉽게 식별할 수 있도록 이 지표에 기능을 내장했습니다. 이 표시기는 통화의 강세 또는 약세가 증가 또는 감소하는지 여부와 모든 시간대에서 수행되는 방식을 그래픽으로 보여줍니다. 추가된 새로운 기능은 현재 시장 조건 변화에 적응하는
- Real price is 80$ - 40% Discount (It is 49$ now) Contact me for instruction, add group and any questions! - Non-repaint - I just sell my products in Elif Kaya profile, any other websites are stolen old versions, So no any new updates or support. - Lifetime update free Related product:   Bitcoin Expert Introduction The breakout and retest strategy is traded support and resistance levels. it involves price breaking through a previous level.  The break and retest strategy is designed to help tr
Order Block Hunter
Noha Mohamed Fathy Younes Badr
5 (10)
Order block hunter indicator is the best indicator for  hunt the order blocks that area where there has been a large concentration of limit orders waiting to be executed Order blocks are identified on a chart by observing previous price action and looking for areas where the price experienced significant movement or sudden changes in direction .This indicator does that for you by using very complicated codes and helps you to take the best areas To buy and sell because it make marks at the best a
FX Power MT4 NG
Daniel Stein
4.95 (21)
FX Power: 통화 강세 분석으로 더 스마트한 거래 결정을 개요 FX Power 는 어떤 시장 상황에서도 주요 통화와 금의 실제 강세를 이해하기 위한 필수 도구입니다. 강한 통화를 매수하고 약한 통화를 매도함으로써 FX Power 는 거래 결정을 단순화하고 높은 확률의 기회를 발견합니다. 트렌드를 따르거나 극단적인 델타 값을 사용해 반전을 예측하고자 한다면, 이 도구는 귀하의 거래 스타일에 완벽히 적응합니다. 단순히 거래하지 말고, FX Power 로 더 스마트하게 거래하세요. 1. FX Power가 거래자에게 매우 유용한 이유 통화와 금의 실시간 강세 분석 • FX Power 는 주요 통화와 금의 상대적 강세를 계산하고 표시하여 시장 역학에 대한 명확한 통찰력을 제공합니다. • 어떤 자산이 앞서고 있고 어떤 자산이 뒤처지는지 모니터링하여 보다 현명한 거래 결정을 내릴 수 있습니다. 포괄적인 멀티 타임프레임 뷰 • 단기, 중기 및 장기 타임프레임에서 통화와 금의 강세를
Market Reversal Alerts
LEE SAMSON
4.2 (115)
가격이 역전되고 후퇴함에 따라 시장 구조가 변경됩니다. 시장 구조 반전 경고 표시기는 추세 또는 가격 움직임이 고갈에 가까워지고 반전할 준비가 되었음을 식별합니다. 일반적으로 반전이나 큰 하락이 일어나려고 할 때 발생하는 시장 구조의 변화를 알려줍니다. 지표는 가능한 고갈 지점 근처에서 새로운 고점 또는 저점이 형성될 때마다 초기에 돌파와 가격 모멘텀을 식별합니다. 표시기는 반대쪽에 있는 마지막 촛불에 직사각형을 그립니다. 그런 다음 현재의 단기 추세에서 계속 움직이기 때문에 가격과 함께 직사각형을 따라갈 것입니다. 가격이 사각형 위나 아래로 다시 닫힐 정도로 약해지면 시장 구조에 잠재적인 변화가 일어나고 있음을 나타냅니다. 그런 다음 표시기는 방향의 잠재적인 이동과 추세 또는 주요 하락의 가능한 반전 시작에 대해 경고합니다. 작동 방식을 보려면 아래의 작동 표시기를 참조하십시오! 여기에서 모든 쌍 및 기간을 모니터링하기 위한 선택적 대시보드 추가 기능: https://www
제작자의 제품 더 보기
Smartsignals
Ahmad Bin Fawzi Bin Al-akhdar Al-fazai
SmartSignals Pro is an advanced MT5 indicator that delivers high-quality Buy & Sell signals using a powerful multi-confirmation system. It combines EMA crossover (9 & 21), RSI, MACD, ADX, VWAP, and Volume analysis to filter weak signals and improve accuracy. The indicator automatically provides a complete trading setup: Entry point Stop Loss (ATR-based) Up to 5 Take Profit levels Risk/Reward ratio Lot size calculator Features ️ Smart Buy & Sell signals ️ Multi-indicator confirmation system
Flashscalp EA
Ahmad Bin Fawzi Bin Al-akhdar Al-fazai
4.67 (6)
Flashscalp EA is an automated trading system designed to operate with precision and risk control under different market conditions. The Expert Advisor applies multiple technical filters and confluence signals to identify suitable entry and exit points. Key Features: • Advanced Entry Logic – combination of technical indicators and price action filters for trade confirmation.   • Risk Management System – dynamic stop-loss, take-profit, and breakeven adjustment to protect equity.   • Scalping and S
FREE
MT5 Meantrich EA
Ahmad Bin Fawzi Bin Al-akhdar Al-fazai
KEY FEATURES MEANTRICH EA PRO ULTIME   is a sophisticated automated trading system that combines Price Action patterns with Moving Average trend filtering to identify high-probability entries on any timeframe and instrument. Unlike traditional indicators that lag, this EA reads raw price action - just like professional traders do - and executes trades with precise risk management. TRADING LOGIC The EA scans the market for three proven price action patterns: Pin Bar   - A reversal pattern w
FREE
Fusion EA Master
Ahmad Bin Fawzi Bin Al-akhdar Al-fazai
https://youtu.be/U-tBtaEwaCk?si=yPZ0pFar0oyFq2SP Fusion EA Master: The Confluence Trading Powerhouse The price of Fusion EA Master is set to increase by 5% with every 10 copies sold. Overview Fusion EA Master is a highly versatile and robust Expert Advisor (EA) developed for the MetaTrader 5 platform. Designed to navigate complex market conditions, Fusion EA Master utilizes a Confluence Strategy , combining technical indicators with advanced Price Action patterns and stringent risk management r
LinearRegressionChannel
Ahmad Bin Fawzi Bin Al-akhdar Al-fazai
Linear Regression Channel – Indicator The Linear Regression Channel is a custom MT5 indicator that plots a regression line through price over a specified number of bars, with dynamic support and resistance boundaries. Central Line (BlueViolet): Represents the linear regression line (best-fit line) based on the selected price type (Close or High/Low). Upper Line ( Li me): Represents the regression-based resistance level, adjusted dynamically according to the highest deviation from the regressi
FREE
Price Hunter EA
Ahmad Bin Fawzi Bin Al-akhdar Al-fazai
PriceHunter EA is an algorithmic trading system that combines price action analysis with adaptive moving averages, volatility filters, and momentum confirmation. The Expert Advisor is designed to identify short-term and medium-term market opportunities while avoiding low-quality signals. Key Features of the Trading Logic: • Trend Detection – identifies the main direction using dynamic EMA-based filters.   • Momentum Confirmation – validates entries through oscillators and volume analysis to r
FREE
Parabolic MA
Ahmad Bin Fawzi Bin Al-akhdar Al-fazai
Parabolic MA Pro - Système de Trading Avancé Détectez les retournements de tendance avec précision grâce à notre système unique combinant SAR Parabolique et Moyenne Mobile !   CARACTÉRISTIQUES RÉELLES   SYSTÈME HYBRIDE INNOVANT SAR Parabolique   calculé sur la   Moyenne Mobile   (au lieu du prix direct) Filtrage des faux signaux   grâce à la double validation Algorithme exclusif   de retournement de tendance   ALERTES PRÉCISES Notifications sonores   aux points de retournement Détection automati
FREE
Line Master
Ahmad Bin Fawzi Bin Al-akhdar Al-fazai
Line Master – Trend Lines & Direction Arrows Line Master is a professional trend indicator for MetaTrader 5. It helps traders identify market direction by combining fast and slow trend lines and generating arrows at trend change points. Features: Slow Trend Line: Represents the overall market trend. Fast Trend Line: Responds quickly to short-term price changes. Color-Coded Lines: Uptrend: DodgerBlue Downtrend: Crimson Trend Arrows: Signals appear when the trend changes. Adjustable Inputs: Fast l
FREE
Dynamic Range Pro
Ahmad Bin Fawzi Bin Al-akhdar Al-fazai
Dynamic Range Pro – Indicator Dynamic Range Pro is a technical indicator designed to visualize key market zones by plotting a dynamic channel based on price extremes. Main Features: Dynamic channel calculated using the highest highs and lowest lows over a specified period. Midline representing price equilibrium. Compatible with multiple instruments and timeframes. Inputs: PeriodPR: Sets the number of bars used for channel calculation. Functionalities: Highlights potential breakouts when price mo
FREE
GoldFusion EA Scalper
Ahmad Bin Fawzi Bin Al-akhdar Al-fazai
GoldFusion Pro – Multi-Strategy Automated Trading EA GoldFusion Pro is an algorithmic trading system that combines multiple strategies with a dual risk management framework. It is designed for automated trading on various Forex pairs and timeframes. CORE FEATURES • Dual Trading Modes – single trade and multi-trade scaling system   • Flexible Take Profit / Stop Loss – dynamic ATR-based or fixed-point configuration   • Comprehensive Risk Management – daily loss limits, position sizing control, and
Fusion Trend
Ahmad Bin Fawzi Bin Al-akhdar Al-fazai
Fusion Trend – Multi-Signal Indicator Fusion Trend (Alpha Trend) is an advanced technical indicator designed to identify market trends and provide automated buy and sell signals. It combines ATR, RSI, MFI, and trend-following logic for technical analysis on any timeframe. Features: • Alpha & Offset Lines – visualize the main trend and its offset.   • Buy & Sell Signals – automatic arrows appear when trend changes are detected.   • Adaptive ATR Filter – adjusts sensitivity based on market vol
필터:
Paraboom
14
Paraboom 2025.11.13 19:40 
 

사용자가 평가에 대한 코멘트를 남기지 않았습니다

pan898899
534
pan898899 2025.09.06 22:35 
 

사용자가 평가에 대한 코멘트를 남기지 않았습니다

리뷰 답변