Bullhouse Marketprofile
- 지표
- 버전: 2.1
- 업데이트됨: 11 9월 2025
- 활성화: 5

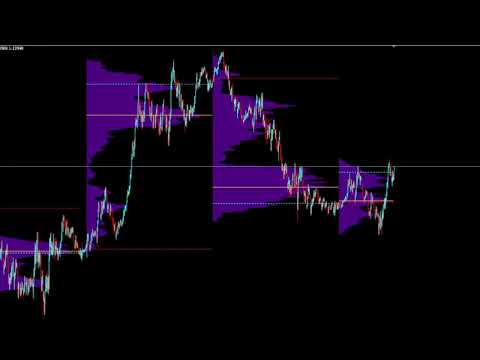
🔍 Description
The MarketProfile indicator collects and distributes traded volume at different price levels, creating a horizontal histogram that highlights areas of institutional interest.
📈 How it helps in trading
It helps traders identify strong support and resistance zones, balance areas, and points of control (POC), offering insights into where the market participants are most active.
⚙️ How to use
Set the desired range of candles or session. The indicator will plot horizontal volume distributions directly on the chart, allowing you to see high-volume nodes (HVN) and low-volume nodes (LVN) for better decision-making.
Note: Past performance does not guarantee future results. Please test the indicator thoroughly in a demo account before using it in live trading.