TK Rainbow
- 지표
- Nguyen Trung Khiem
- 버전: 1.0
TK - Rainbow 지표
설명:
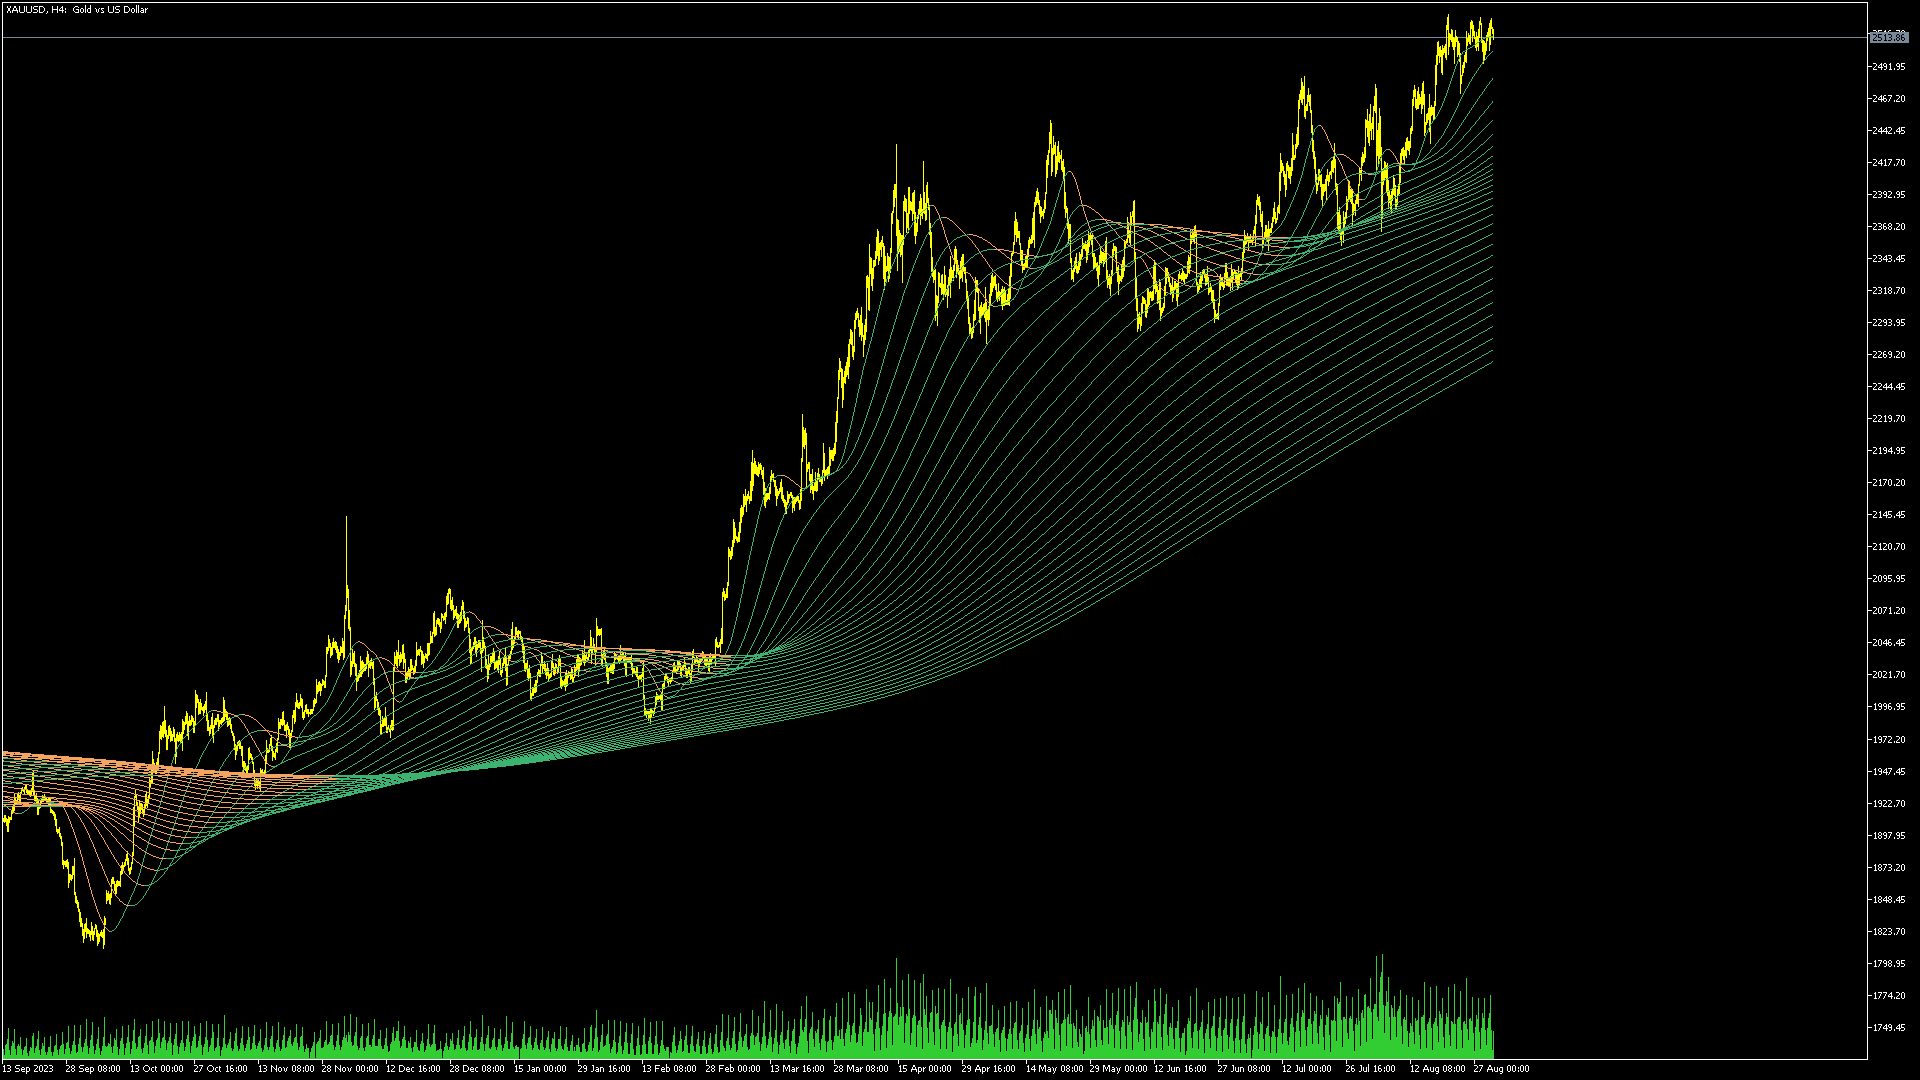
TK - Rainbow 지표는 다양한 선을 통해 시장 추세를 명확히 파악할 수 있도록 설계된 강력한 기술 분석 도구입니다. 서로 다른 기간으로 계산된 30개의 선을 사용하여 가격 움직임에 대한 포괄적인 분석을 제공합니다. 이 지표는 두 가지 색상 스키마를 사용하여 상승 추세와 하락 추세를 강조하므로 시장 상황을 한눈에 쉽게 해석할 수 있습니다.
주요 기능:
- 30개의 선: 각 선은 다양한 평활화 기간을 나타내어 광범위한 시장 추세를 포괄합니다.
- 이중 색상 스키마: 상승 추세(차가운 색상)와 하락 추세(따뜻한 색상)를 구분하기 위해 두 가지 색상을 사용합니다.
- 사용자 정의 가능한 설정: 거래 선호에 맞게 선의 두께, 스타일 및 단계 크기를 조정할 수 있습니다.
TK - Rainbow 사용 방법:
- 지표 적용:
- TK - Rainbow 지표를 MetaTrader 5의 지표 목록에서 차트에 추가합니다.
- 매개변수 설정:
- 단계 (inpStep): 각 선 사이의 기간 증가를 정의합니다. 이를 조정하여 선의 간격을 설정합니다.
- 가격 (inpPrice): 계산에 사용될 가격 유형(예: 종가, 시가, 고가, 저가)을 선택합니다.
- 선의 두께 (inpLinesWidth): 선의 두께를 설정하여 가독성을 높입니다.
- 선의 스타일 (inpLinesStyle): 선의 스타일(예: 실선, 점선)을 선택합니다.
- 색상 해석:
- 상승 추세: 차가운 색상(파란색)의 선은 상승 추세를 나타냅니다.
- 하락 추세: 따뜻한 색상(빨간색)의 선은 하락 추세를 나타냅니다.
- 거래 전략:
- 추세 식별:
- 강세 추세: 대부분의 선이 차가운 색상으로 높게 위치해 있을 때, 이는 강한 상승 추세를 시사합니다. 롱 포지션을 고려하거나 기존 포지션을 유지합니다.
- 약세 추세: 대부분의 선이 따뜻한 색상으로 낮게 위치해 있을 때, 이는 강한 하락 추세를 시사합니다. 숏 포지션을 고려하거나 기존 포지션을 유지합니다.
- 추세 반전:
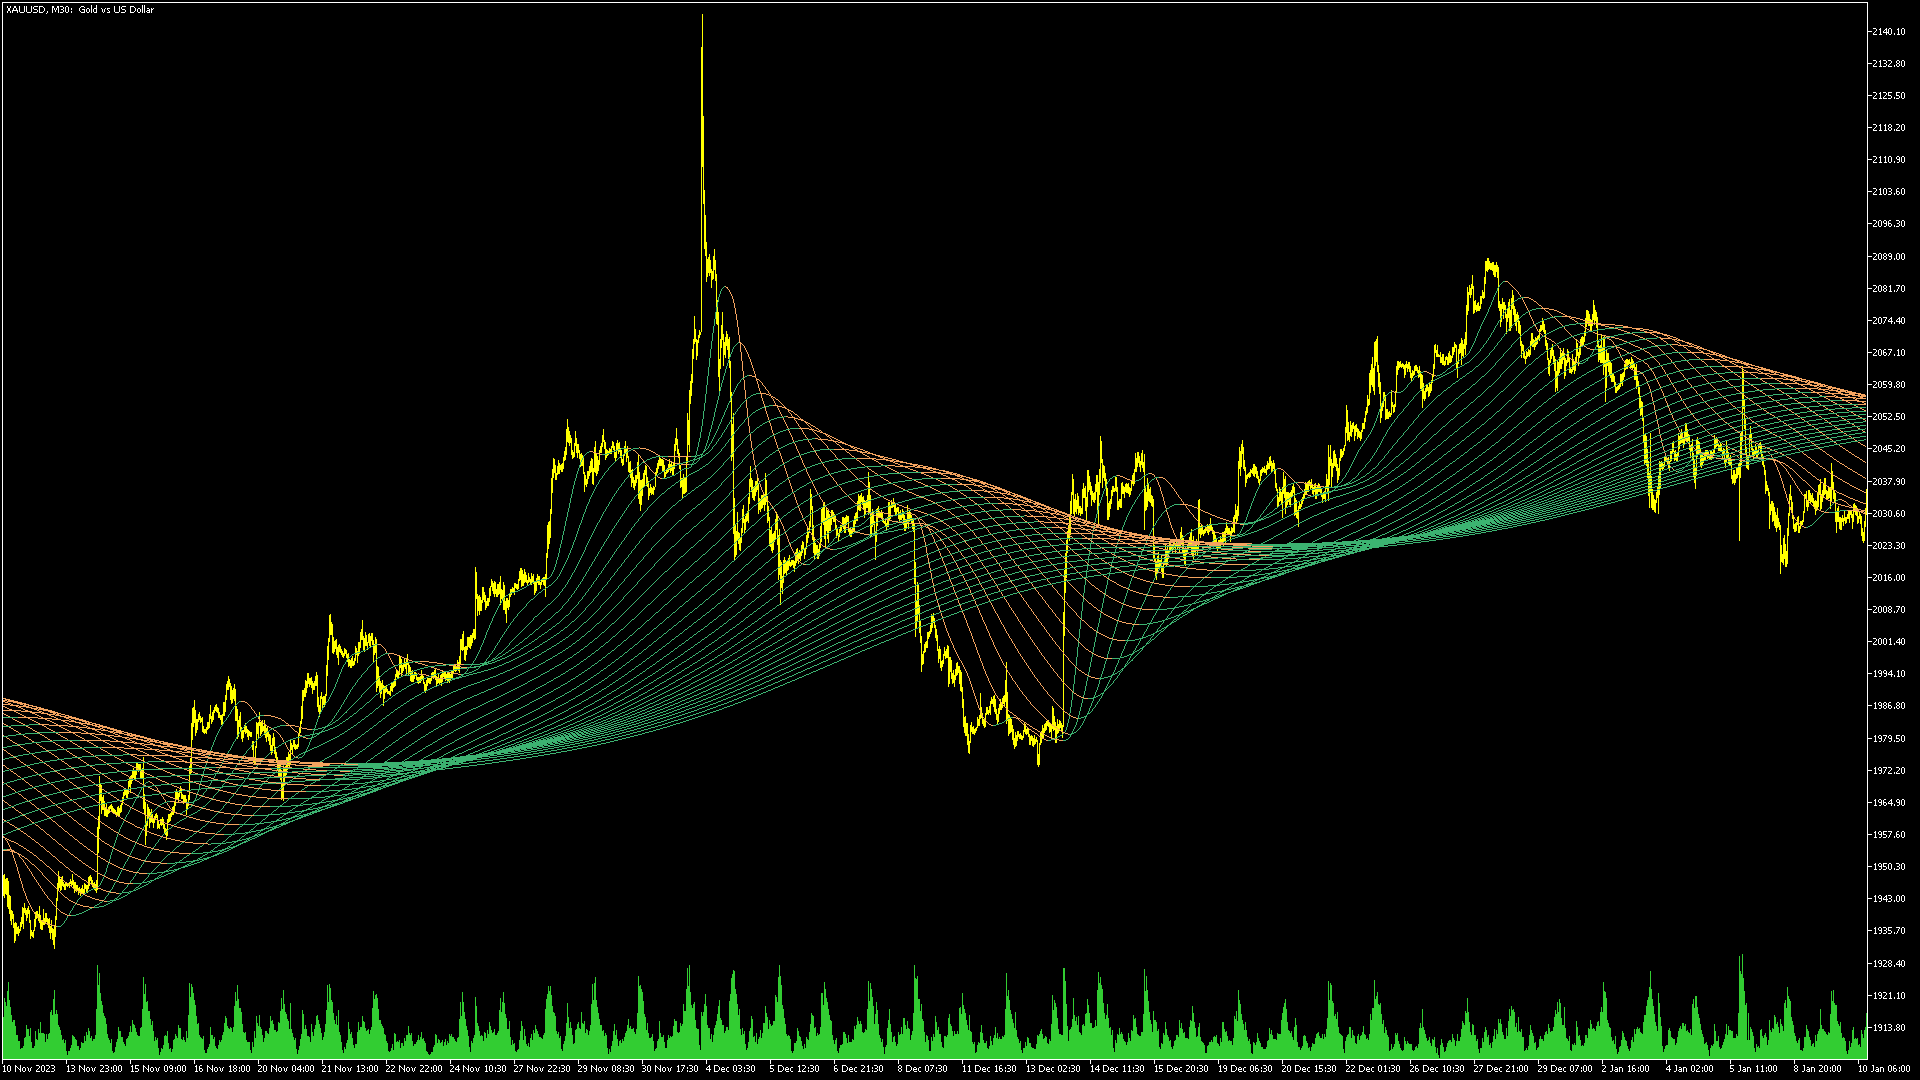
- 반전 신호: 선의 색상이 눈에 띄게 변하는 것을 찾습니다. 차가운 색상에서 따뜻한 색상으로의 전환 또는 그 반대는 잠재적인 추세 반전을 시사할 수 있습니다. 이 신호를 추가 지표나 분석 방법으로 확인합니다.
- 선 교차:
- 교차 확인: 짧은 기간의 선이 긴 기간의 선 위나 아래로 이동하는 교차를 관찰합니다. 이는 추세의 강도나 약도를 확인하고 진입 또는 청산 결정을 돕는 데 유용합니다.
- 지원 및 저항 수준:
- 추세 선: 선의 위치와 움직임을 분석하여 잠재적인 지원 및 저항 수준을 식별합니다. 선의 평평함 또는 분산은 가격이 반전되거나 통합될 수 있는 주요 수준을 나타낼 수 있습니다.
- 추세 식별:
- 가시성 조정:
- 색상 스키마와 선의 설정을 사용자 정의하여 가독성을 향상시킵니다. 다양한 거래 시간대와 시장 조건에 맞게 설정을 조정합니다.
팁:
- TK - Rainbow 지표를 다른 기술 분석 도구와 결합하여 신호를 확인하고 거래 결정을 개선합니다.
- 시장 동향과 거래 전략에 따라 지표 설정을 정기적으로 검토하고 조정합니다.

The **TK - Rainbow Indicator** is an excellent addition to the toolkit of any technical analyst or trader. Its multi-line approach, comprising **30 lines calculated over different periods**, provides an in-depth view of price movements and trends. This level of detail ensures traders can better identify subtle shifts in market momentum. The dual-color scheme is particularly user-friendly, enabling quick interpretation of upward and downward trends. By visually distinguishing between bullish and bearish conditions, the indicator simplifies decision-making, making it especially valuable for traders seeking clarity in complex market conditions. However, for some users, the sheer volume of lines might initially seem overwhelming. To maximize its potential, traders may need a period of familiarization to interpret the data effectively and integrate it into their broader strategy. ### **Pros:** - **Comprehensive Analysis:** Tracks market trends using 30 lines with different periods. - **Clear Visuals:** Dual-color scheme for intuitive trend identification. - **Versatility:** Suitable for various markets and trading strategies. ### **Cons:** - **Steep Learning Curve:** May require time to fully understand and utilize. - **Potential Clutter:** Too many lines might distract less experienced traders. ### **Verdict:** The TK - Rainbow Indicator is a powerful and visually appealing tool for traders who value detailed trend analysis. While it may demand some initial effort to master, its benefits in terms of clarity and depth of analysis are well worth the investment.