MultiOrderBlock
- 지표
- 버전: 2.0
- 활성화: 5
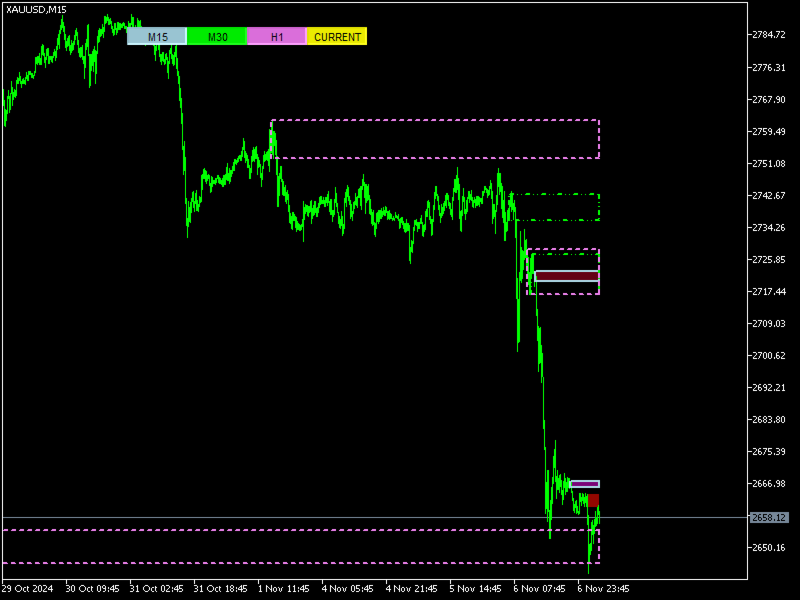
Order blocks are essential structures in trading that indicate areas where large institutional traders, like banks and hedge funds, have placed their orders.
These blocks represent significant price levels where substantial buying or selling activity has occurred, providing clues about potential market movements.
So, why should you, as a trader, care about order blocks? Well, knowing where these big orders are placed can give you a huge advantage. It’s like having a map showing where the treasure is buried.
Moreover, understanding the relationship between order blocks and liquidity can further refine your trading strategy, as these blocks often coincide with high liquidity areas that can absorb large trades without significant price slippage.
Order blocks can help you predict where the price is likely to head next, allowing you to make more informed trading decisions.
Whether you’re dealing with order block forex trading or other markets, recognizing these areas can significantly improve your entry and exit points.