
Harmonic Price Patterns
- 지표
- 버전: 5.60
- 활성화: 5

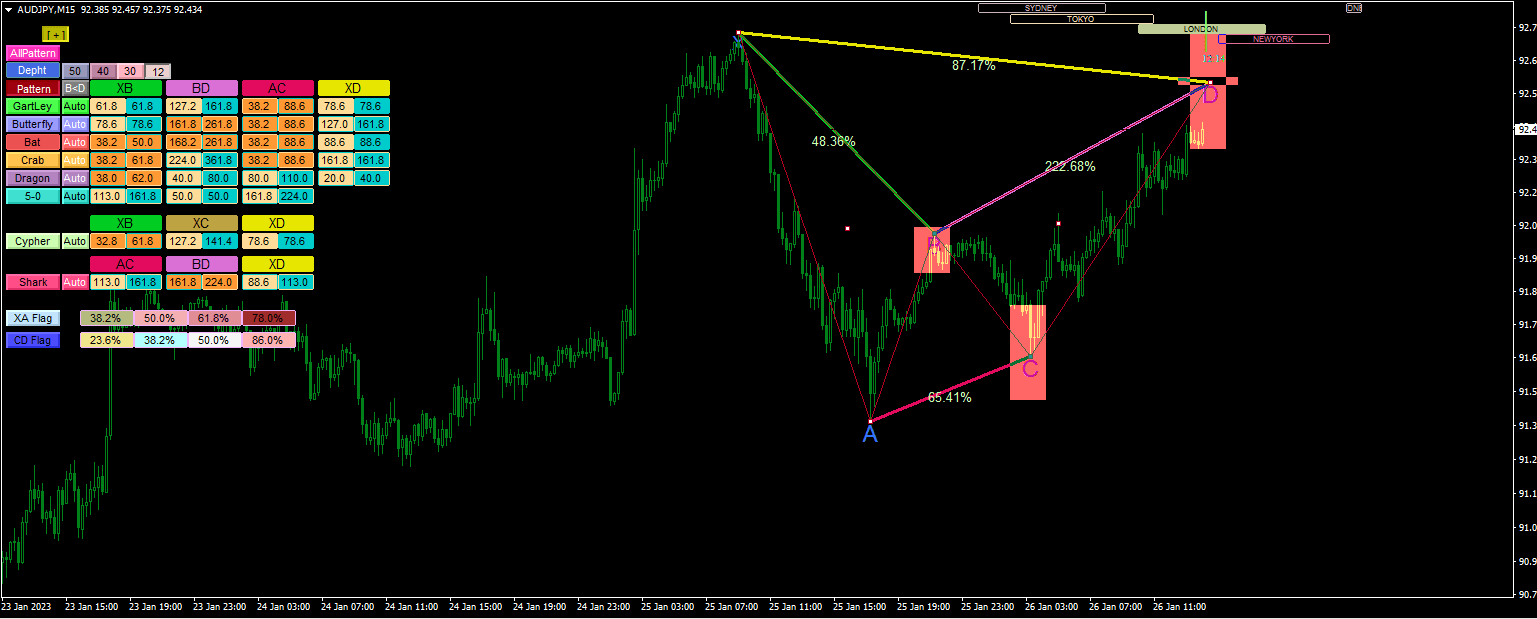
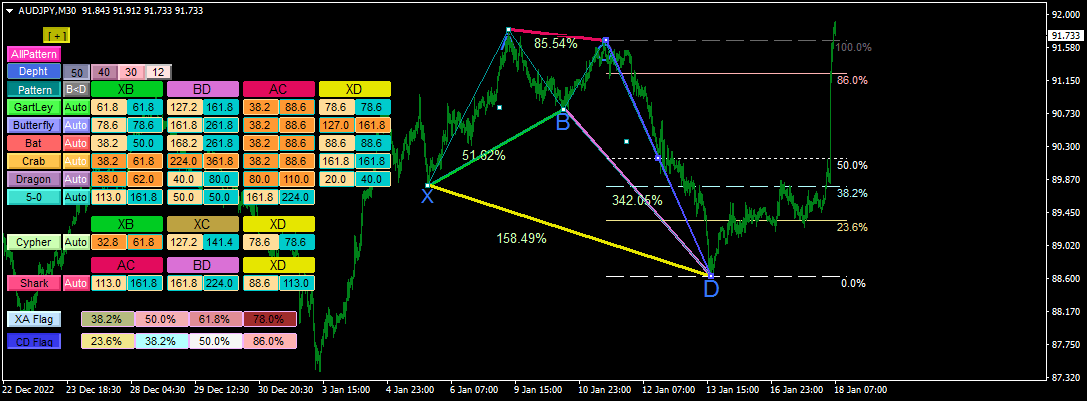
Harmonic Price Patterns is a MetaTrader 4 chart indicator for locating and studying selected harmonic formations. It analyzes price swings and compares the relationships between the X, A, B, C and D points with configurable Fibonacci ratio ranges. When the selected conditions are met, the formation is drawn on the chart for visual review.
Supported pattern families
Gartley: identifies structures using configurable retracement and projection ranges around the XA, AB, BC and CD legs. The default settings use a 61.8% B-point retracement of XA and a 78.6% D-point retracement of XA.
Butterfly: uses its own ratio ranges, including a configurable B-point retracement and an extended D-point projection beyond X. The default D-point range is 127.0% to 161.8% of XA.
Bat: checks a shallower B-point retracement range and a deeper D-point retracement of XA. The default settings use 38.2%–50.0% for B and 88.6% for D.
Crab: uses a broad B-point range and a more extended CD projection. The default settings use 38.2%–61.8% for B and 161.8% for D.
Cypher: evaluates the B and C relationships and the D-point retracement using separately configurable limits. Its default C range is 127.2%–141.4%, with D at 78.6%.
Shark: uses configurable extension ranges for the intermediate swing and a D-point range of 88.6%–113% by default.
Dragon: provides a separate set of configurable ranges for its swing relationships. The default parameters include ranges for XB, AC, BD and XD.
An additional pattern set is also configurable through its AC, XB and BD ratio parameters.
Chart analysis and display
The indicator distinguishes bullish and bearish formations with separate colors and marks the pattern pivots. It can display Fibonacci levels for the XA and CD legs, with configurable level values, line colors and text sizes. The potential reversal zone (PRZ) is shown as an analytical area derived from the pattern's measured legs; it is a reference for chart study rather than a prediction.
Swing detection is controlled by four depth settings, plus deviation and backstep parameters. These settings affect which price swings are considered and can change the formations identified. Pattern ratio limits can be customized individually, allowing the default criteria to be adapted for analysis.
The chart interface includes settings for its position, scale, font and colors. Candle and chart appearance options are available, as are controls for enabling pattern and Fibonacci displays. Use the indicator on a MetaTrader 4 chart and review the detected formations against the underlying price action and your chosen settings.
This indicator provides visual chart analysis only. It does not place, modify or close trades. Harmonic formations are interpretations of historical price relationships; detection does not confirm that price will reverse or continue in a particular direction, and it does not guarantee a trading result.



























































사용자가 평가에 대한 코멘트를 남기지 않았습니다