ATR Bot

How ATR Bot Works

  1. Tracks Market Trends with Precision: ATR Bot leverages the Average True Range (ATR) to calculate a dynamic Trailing Stop, continuously adapting to market volatility. This ensures you always have a clear view of key support and resistance levels, helping you stay ahead of price movements.
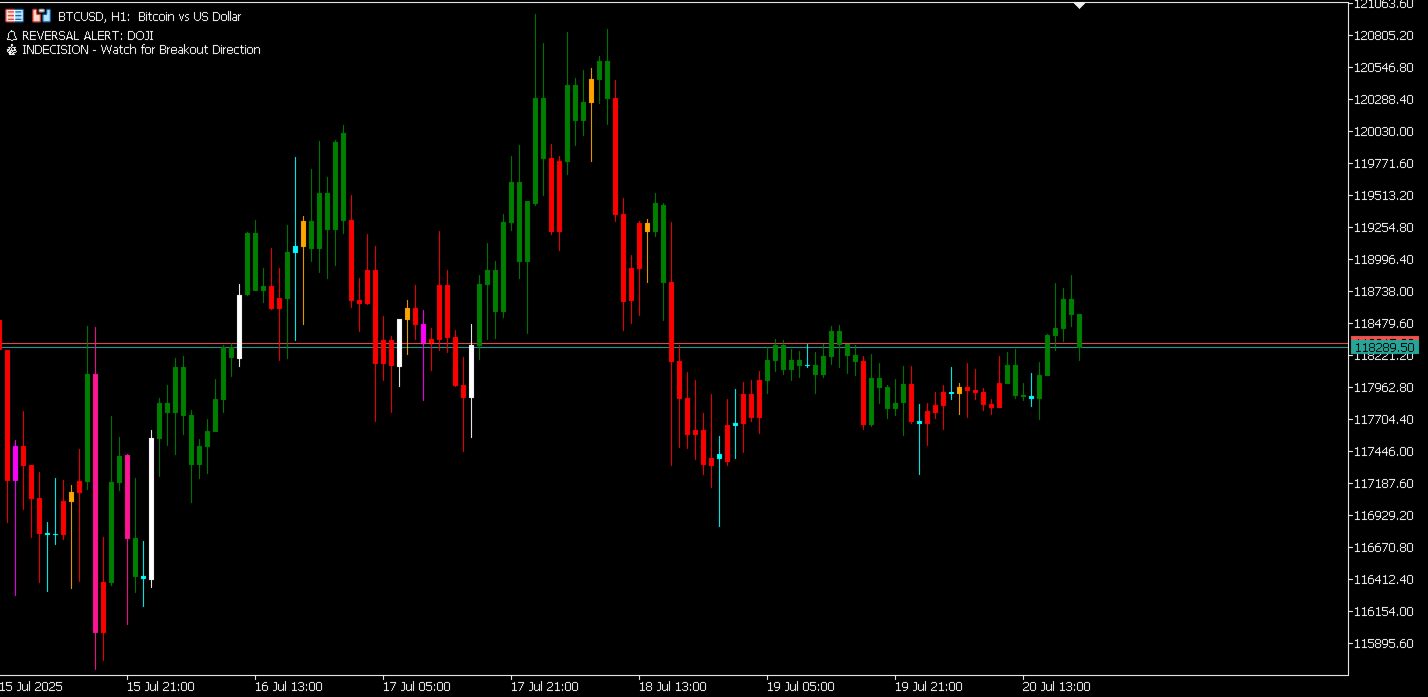
  2. Delivers Clear Trading Signals: The indicator generates vivid green arrows for optimal buy opportunities and striking red arrows for sell signals, triggered when the price crosses the ATR Trailing Stop. These visual cues make it easy to time your entries and exits with confidence.
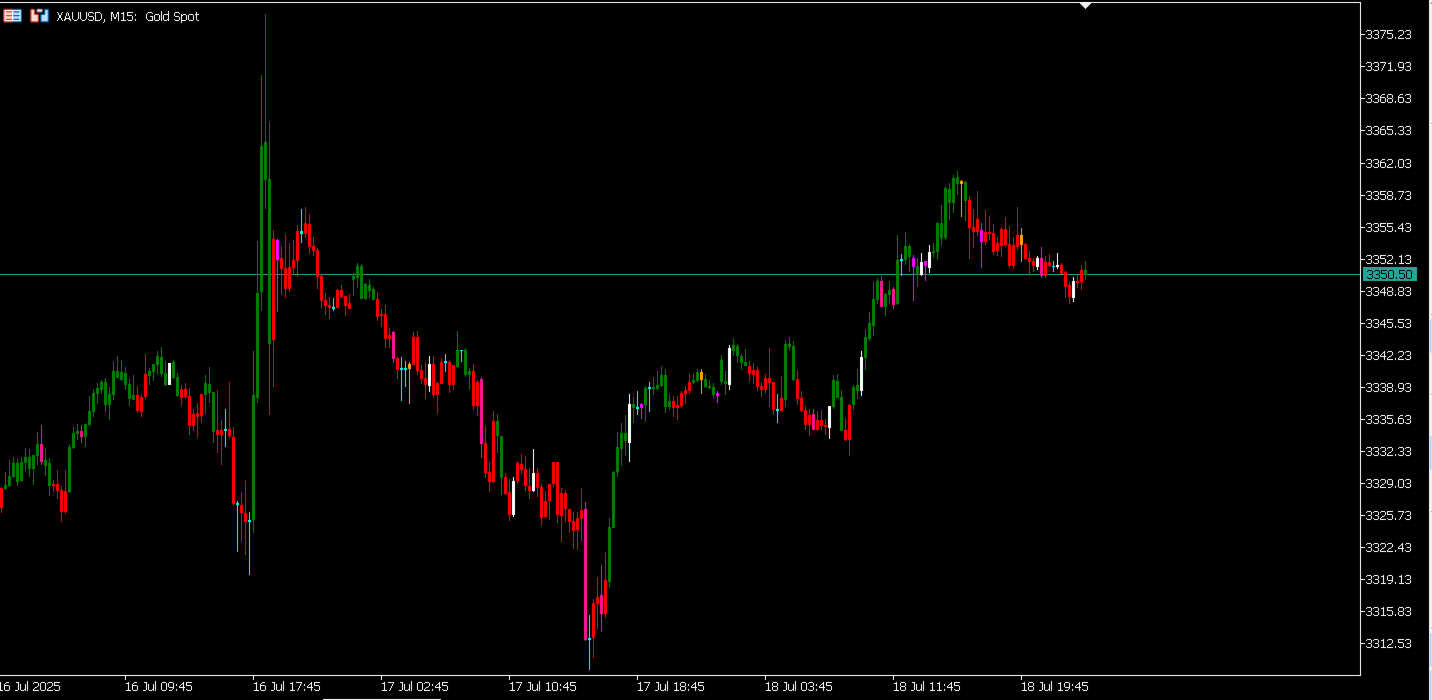
  3. Highlights High-Probability Patterns: Candlesticks transform into a spectrum of colors to spotlight various market patterns, empowering you to identify critical turning points. It detects:
    • Hammer (Lime): A bullish reversal after a downtrend, with a long lower wick and small upper wick.
    • Hanging Man (Orange): A bearish reversal after an uptrend, mirroring the Hammer’s shape.
    • Doji (Cyan): An indecision candle with a tiny body, signaling potential breakouts in either direction.
    • Bullish Engulfing (White): A strong bullish reversal where a large bullish candle engulfs the prior bearish one.
    • Bearish Engulfing (Deep Pink): A strong bearish reversal where a large bearish candle engulfs the prior bullish one.
    • Morning Star (White): A three-candle bullish reversal pattern after a downtrend.
    • Evening Star (Deep Pink): A three-candle bearish reversal pattern after an uptrend. Additionally, it highlights no-wick candles (Yellow) for unique market conditions.
  4. Offers Tailored Flexibility: Customize ATR Bot to suit your trading style by adjusting sensitivity, ATR periods, and smoothing options. Toggle Heikin Ashi candles for a smoother trend view or enable smoothed ATR for refined volatility analysis, giving you full control over your strategy.


추천 제품
Rectangle Trading Custom is a powerful technical analysis tool designed for price action and range-based traders. It allows users to define consolidation zones and receive alerts when the price breaks out of these zones or approaches trendlines drawn on the chart. Rectangles and Trendlines will be extended into future with one click. Rectangle point size, name and prices will be displayed around rectangle. Key Features: Draw Trading Zones (Rectangle Zones) Users can manually draw rectangles to
SimpleprobMT5
Augusto Martins Lopes
확률 지표 설명 확률 지표는 이전 캔들의 분석을 기반으로 매매 기회를 식별하려는 트레이더를 위한 강력한 도구입니다. 분석할 캔들의 수를 설정하여 상승 ( CALL ) 및 하락 ( PUT ) 확률을 계산하고, 차트에 화살표를 표시하여 잠재적인 진입점을 나타냅니다. 특징 캔들 분석 : 설정 가능한 수의 캔들을 분석하여 상승 및 하락 확률을 계산합니다. 시각적 신호 : 차트에 색상 화살표를 표시하여 매수(녹색) 및 매도(빨간색) 신호를 제공합니다. 음성 알림 : 매매 신호에 대한 설정 가능한 음성 알림을 제공합니다. 알림 기능 : 모바일 기기 또는 이메일로 알림을 보내 거래 신호를 전달합니다. 확률 박스 : 차트에 실시간 상승 및 하락 확률을 표시합니다. 입력 매개변수 num_candles : 분석할 캔들의 총 개수. call_threshold : CALL 신호(녹색)의 최소 확률. put_threshold : PUT 신호(빨간색)의 최소 확률. sound_alert : 음성 알림 활성화
ICT Kill zones
Israr Hussain Shah
ICT Kill zones Professional Automate your ICT & Smart Money analysis with precise, dynamic session tracking and liquidity pivots. Product Description Stop wasting time drawing boxes and lines every single day.   ICT Killzones Professional   is the ultimate session management tool designed specifically for traders utilizing Inner Circle Trader (ICT) concepts, Smart Money Concepts (SMC), and Liquidity-based strategies. This indicator automatically highlights the key trading sessions— Asia, London,
XFlow
Maxim Kuznetsov
XFlow shows an expanding price channel that helps determine the trend and the moments of its reversal. It is also used when accompanying transactions to set take profit/stop loss and averages. It has practically no parameters and is very easy to use - just specify an important moment in the history for you and the indicator will calculate the price channel. DISPLAYED LINES ROTATE - a thick solid line. The center of the general price rotation. The price makes wide cyclical movements around the
Elevate Your Trading Experience with the famous UT Bot Alert Indicator! Summary: The UT Bot Alert Indicator by Quant Nomad has a proven track record and is your gateway to a more profitable trading journey. It's a meticulously crafted tool designed to provide precision, real-time insights, and a user-friendly experience.  Key Features: 1. Precision Analysis: Powered by advanced algorithms for accurate trend identification, pinpointing critical support and resistance levels. 2. Real-time Alert
Three Candles Pattern
Edson Cavalca Junior
5 (1)
The patterns of 3 (three) Candles: Three White Soldiers; Three Black Crows; These are reversal patterns widely used by traders, as they have a high probability of showing the inversion of the current market movement. For example, if in a bullish trend there are three black crows, there is a high probability of reversing the current bullish movement. The Three White Soldiers have the following characteristics: There are 3 consecutive candles with a good body, that is, the difference between th
Hammer Star
Arkadii Zagorulko
MT5 해머 & 스타 바 패턴 인디케이터 이 강력한 MT5 인디케이터는 차트에서 해머(Hammer) 와 스타 바(Star Bar) 같은 핵심 반전 패턴을 빠르게 식별할 수 있는 도구입니다. 시장의 흐름에 상관없이 중요한 반전 신호를 놓치지 않고 포착할 수 있습니다. 주요 기능과 장점: 고/저점 감지 : 현재 캔들을 이전 X개의 캔들과 비교하여 신호 정확성을 확보 꼬리와 몸통 비율 설정 : 위/아래 꼬리가 몸통의 X배 이상이어야 하며, 불필요한 신호 필터링 반대 꼬리 확인 : 신호 꼬리의 X배 이상으로 반대 꼬리 확인, 신뢰도 향상 알림 기능 : 모바일 푸시 알림과 차트 코멘트로 중요한 신호 놓치지 않음 권장 시간 프레임 : H4 이상, 더 안정적이고 신뢰할 수 있는 신호 제공 모든 트레이더에게 적합 : 초보자는 쉽게 사용 가능, 숙련자는 전략에 맞게 커스터마이즈 가능 재도색 없음 : 신호가 한 번 나타나면 고정, 믿을 수 있는 분석 지원 이 인디케이터를 사용하면 시장에서 반전 가능
Ict institutional zones
Marrion Netondo Wabomba
SMC VALID EA (MT5) Version: 1.10 Author: Marrion Brave Wabomba Category: Smart Money Concepts (SMC) and  ICT concepts ICT Smart Money Daily Zones (SMC Pro)  ICT Smart Money Daily Zones (SMC Pro) – ICT Daily Buy & Sell Zones Pro is a professional-grade Smart Money Concepts (SMC) / ICT trading indicator for MetaTrader 5, designed to clearly map institutional daily levels and guide traders with high-probability decision zones . This indicator automatically analyzes the Daily timeframe (PDH / PD
Chart Replay Indicator MT5 Overview Chart Replay Indicator is a chart replay and training tool for MetaTrader that allows users to replay historical market data bar by bar directly on the chart. It is designed for manual backtesting, strategy training, and market behavior analysis without relying on future price information. Candles are displayed progressively to reproduce the flow of historical data. This indicator does not provide trading signals and does not execute or manage trades. Key Feat
Channel Universal   knows how to correctly build a forex channel and forms a classic trading strategy, it is easy to execute, therefore it is accessible even to beginners. Price channels work equally well on any trading assets and timeframes, they can be used both independently and with additional confirmation from oscillators and market volumes. If you look at the price and try to identify the simplest visual patterns, you will immediately see that the price almost never moves in a straight l
CISD Levels Pro automatically draws CISD Buy and Sell levels directly on your chart. It highlights pending levels while they are forming, then marks confirmed levels after the confirmation candle closes. Optional confirmation arrows help you spot the signal quickly. This tool is designed for traders who want clean, simple CISD level visualization without extra indicators or clutter. Key Features Draws Bullish (BUY) CISD levels and Bearish (SELL) CISD levels Shows Pending levels (dashed) and
Godfather mt5
Ivan Simonika
The intelligent algorithm of the Godfather indicator accurately determines the trend, filters out market noise and generates entry and exit levels. The indicator will help in finding entry points when analyzing the price chart. The program first receives a "snapshot" of the graph, then analyzes it. The results are reported to the trader in the form of signals. The main purpose of this indicator is to determine the moments of entries and exits from transactions, so the indicator displays only th
Trendicator
Nico Deuscher
Functions Analyzes the current market trend Displays a numbering system based on trend structure (see below) Colors the chart background depending on trend direction Displays the ZigZag indicator Display Fibonacci Retracement with custom defined levels at the lates corrective trend movement Display Fibonacci Expansions with custom defined levels at the latest progressive trend movement Buffers for all relevant Trend parameters so EAs can access the trend information Background Information The
Non-lagging VOLATILITY indicator A radical modification of the ATR indicator, which corrected all of its shortcomings (the picture shows the difference with ATR). The indicator shows the swing size of the current market movement. Features: does not have a time window period, i.e. any subjective settings non-delayed, the extremums of the indicator always coincide with the extremum of the price (note the picture) is normalized by means of a color solution, i.e. it has the properties of an oscillat
추측은 그만. 계산도 그만. 트레이딩을 시작하세요. Risk Reward Tool 은 TradingView의 직관적이고 시각적인 경험을 MetaTrader 차트로 직접 가져옵니다. 전문적인 트레이딩에는 정확한 리스크 관리가 필요하지만, 엑셀 시트로 수동으로 랏 사이즈를 계산하는 것은 느리고 위험합니다. 해결책: 진입가, 손절매(Stop Loss), 이익 실현(Take Profit) 레벨로 시각적 라인을 드래그하기만 하면 됩니다. 이 도구는 특정 금액(예: $50)을 리스크로 걸기 위해 거래해야 하는 랏 수를 즉시 계산해 줍니다. [   Get the MT4 Version Here   ]  주요 기능 시각적 "TradingView" 스타일: 숫자는 잊으세요; 눈으로 트레이딩하세요. 대화형 녹색(이익) 및 빨간색(손실) 영역을 차트에서 직접 드래그하여 진입 전에 설정을 명확하게 확인하세요. 즉각적인 랏 사이즈 계산기: 수학은 백그라운드에서 이루어집니다. 리스크 금액(예: $
The ZigZag Buy Level is a specialized tool for traders who utilize market structure and classic ZigZag patterns to define key support and entry points. It automatically identifies "Main Highs"—significant highs confirmed by the subsequent price action—and then calculates a high-probability "Buy Level" based on a specified percentage pullback from that Main High to the last corrective low. This indicator helps you anticipate deep retracement entries, clearly marking them on the chart with labels
Super Scanner
Li Wei Huang
【Super Scanner】Indicator Introduction : The color of the Super Scanner which is green and climbing up means that the price trend is going up.The color of the Super Scanner is red and going down means that the price trend is going down. It is very simple to use it to judge the market trend! What's even better is that the open parameters of the indicators allow investors to adjust. You can adjust【Super Scanner】according to your needs. Adjust it faster to be closer to short-term market fluctuatio
Weis Wave Box MT5
Sant Clear Ali Costa
Features 3 types of boxes: bullish, bass and unknown. The unknown box arises when prices move in the opposite direction of the current box. Allows you to set the required points for the box change. Lets you set both the box border types and colors or background color. Label that shows the box reversal points. Lets you set the size, color, corner position, and vertical label margin. Input Parameters Tab Reversal Points. Limit in points in the opposite direction to change boxes. Bulls Box Color -
Spike Oscillator
Vitalii Kondratiuk
Indicator for searching for price reversals Works well on commodity indices and currency pairs On charts such as Boom Cash, it shows the beginning of a protracted movement well. You can also catch splashes. The indicator uses algorithms, an oscillator and a trend indicator that work together. The indicator shows a candle opening signal (does not disappear, does not redraw and does not recalculate its readings) A good quality tool that can become the basis for creating your own trading system.
About indicator > The indicator is a function based on one value (open/high prices up to now) and then it is a mathematical representation of the whole function that is totally independent from any else values. So, if you ask yourself will the future be as it is on the graph... I can tell you - as it was the same as the trading function up to the moment "now"... In conclusion, the point of the indicator is  to try to show the future of the trading function into eternity. The graphic is sometime
Best swing
Winsou Cedric Anicet Kpanou
-- BEST SWING  -- L'indicateur BEST SWING est un indicateur technique personnalisé, un excellent outil pour négocier les cassures en fonction des niveaux de support et de résistance horizontaux. L'indicateur BEST SWING utilise une formule complexe en analysant des données de prix autrement incongrues sur les cours de clôture de chaque période, ainsi que les hauts et les bas du prix, afin de donner un aperçu de la force ou de la faiblesse de la tendance du marché et de sa probabilité
This Indicator adding power to traditional zigzag indicator. With High-Low numbers in vision it will be easier to estimate change of trend by knowing the depth of each wave. Information including points, pips, percentage%, and #bars can be displayed based on configuration. All information is real-time update. This indicator is especially useful in sideway market to buy low sell high.
The SyntheticaFX Scalper Pro Indicator is a versatile and user-friendly tool designed to assist traders in identifying high-accuracy entry points across multiple timeframes and all currency pairs. This indicator provides clear visual signals on the chart, along with recommended Stop Loss (SL) and Take Profit (TP) levels, making it easier for traders to plan their trades with confidence. With its built-in dashboard, the SyntheticaFX Scalper Pro Indicator offers real-time trade statistics, helpin
Xau Marti MT5
BILLY ARANDUQUE ABCEDE
Get the EA for FREE Just sign up and use my broker. Broker Link :  https://fbs.partners?ibl=684451&ibp=26113188 Setfile Here :  https://drive.google.com/file/d/1ZKvGf5KaUTZvrt2YE98a18sp7nzGUpVf/view?usp=sharing MT4 Version Here :  https://www.mql5.com/en/market/product/136465 XAU Marti The Smart Choice for Gold & Forex Traders -  Profit Potential! Why This EA Stands Out: RSI-POWERED ENTRIES   - Combines the reliability of RSI indicators with advanced money management for high-probabi
Visual Adaptive Channel Indicator
AL MOOSAWI ABDULLAH JAFFER BAQER
Visual Adaptive Channel Indicator: Trade with the Market's True Rhythm Unlock a smarter way to trade. Stop relying on static, lagging indicators that fail in changing market conditions. The Visual Adaptive Channel Indicator is your new essential tool for identifying high-probability entry points with confidence. Priced at just $30, this indicator is engineered to give you a dynamic and intelligent view of the market, helping you make informed decisions whether you are a scalper, day trader, or
The 4 headed dragon is an indicator that has two functions. 1) Set the background trend. 2) Mark the predominant trend. By combining these two indicator signals, we will be able to trade for or against the trend, adapting the signals to your reading of the market. You can download the demo and test it yourself. 1) Set the background trend.    Define four possibilities of trend that are the four heads of the dragon, marked by colors on the indicator, marking a) Powerful buying trend. b) Weak
Market Noise 시장 노이즈는 가격 차트에서 시장 단계를 결정하는 지표이며, 축적 또는 분산 단계가 발생할 때 분명하고 부드러운 추세 움직임과 시끄러운 평탄한 움직임을 구별합니다. 각 단계는 자체적인 거래 유형에 적합합니다. 추세를 따르는 시스템에서는 추세를 따르고, 공격적인 시스템에서는 플랫합니다. 시장 소음이 시작되면 거래 종료를 결정할 수 있습니다. 마찬가지로, 소음이 끝나자마자 공격적인 거래 시스템을 꺼야 합니다. 누군가는 두 가지 유형의 거래 전략을 서로 전환하면서 거래할 수 있습니다. 따라서 이 지표는 거래 결정 분야에서 훌륭한 조력자 역할을 합니다. 모든 가격 변동은 선택한 기간 동안의 일반적인 가격 변동과 해당 기간 내 가격 변동 형태의 노이즈라는 두 가지 구성 요소로 나눌 수 있습니다. 동시에, 서로 다른 기간의 서로 다른 시장은 잡음과 추세 구성 요소 사이의 광범위한 상호 관계를 보여줄 수 있습니다(그림 1). 가격 변동의 소음 수준이 높을수록 기본 추세의
Introduction This indicator detects volume spread patterns for buy and sell opportunity. The patterns include demand and supply patterns. You might use each pattern for trading. However, these patterns are best used to detect the demand zone (=accumulation area) and supply zone (=distribution area). Demand pattern indicates generally potential buying opportunity. Supply pattern indicates generally potential selling opportunity. These are the underlying patterns rather than direct price action. T
Sends alert when price moves from the previous alarm price by predefined points (or bps). Four alarm modes: push notifications, pop-up, e-mail and / or FTP. Highly customizable alert text and user-configurable indicator color / width / style. Input parameters: Alert offset, in points : Alert is triggered when price moves from the previous alert by predefined points (if the last alert has not been registered, the current price is used as the last alert). The alert price is updated automatically
한눈에 분석을 강화하세요! 이 인디케이터는 가격이 최근 반등하거나 돌파한 주요 레벨을 자동으로 표시하여, 수동으로 그릴 필요 없이 지원 및 저항 구역을 보여줍니다. 차트에 추가하기만 하면 각 기간의 이전 최고가 및 최저가 라인이 나타납니다. 각 라인의 의미 Previous Month High ‣ 이전 달 최고가: 지난 월간 기간 동안 기록된 최고 가격. Previous Month Low ‣ 이전 달 최저가: 지난 월간 기간 동안 기록된 최저 가격. Previous Week High ‣ 이전 주 최고가: 지난 주간 기간 동안 기록된 최고 가격. Previous Week Low ‣ 이전 주 최저가: 지난 주간 기간 동안 기록된 최저 가격. Previous Day High ‣ 이전 일 최고가: 직전 거래일의 최고 가격. Previous Day Low ‣ 이전 일 최저가: 직전 거래일의 최저 가격. 사용 이유 차트를 열자마자 반등 과 돌파 를 포착. 검증된 구역에서 이익실현 (T
이 제품의 구매자들이 또한 구매함
이 지표를 구매하면 제 프로페셔널 트레이드 매니저를 무료로 드립니다. 우선 이 거래 시스템이 리페인팅, 리드로잉 및 레이그 인디케이터가 아니라는 점을 강조하는 것이 중요합니다. 이는 수동 및 로봇 거래 모두에 이상적인 것으로 만듭니다. 온라인 강좌, 설명서 및 프리셋 다운로드. "스마트 트렌드 트레이딩 시스템 MT5"은 새로운 및 경험이 풍부한 트레이더를 위해 맞춤형으로 제작된 종합적인 거래 솔루션입니다. 10개 이상의 프리미엄 인디케이터를 결합하고 7개 이상의 견고한 거래 전략을 특징으로 하여 다양한 시장 조건에 대한 다목적 선택이 가능합니다. 트렌드 추종 전략: 효과적인 트렌드 추이를 타기 위한 정확한 진입 및 손절 관리를 제공합니다. 반전 전략: 잠재적인 트렌드 반전을 식별하여 트레이더가 범위 시장을 활용할 수 있게 합니다. 스캘핑 전략: 빠르고 정확한 데이 트레이딩 및 단기 거래를 위해 설계되었습니다. 안정성: 모든 인디케이터가 리페인팅, 리드로잉 및 레이그가 아니므로 신뢰
SuperScalp Pro
Van Minh Nguyen
5 (6)
SuperScalp Pro – 고급 다중 필터 스캘핑 인디케이터 시스템 SuperScalp Pro는 클래식 Supertrend와 여러 지능형 확인 필터를 결합한 고급 스캘핑 인디케이터 시스템입니다. 해당 인디케이터는 M1부터 H4까지 모든 타임프레임에서 효율적으로 작동하며, 특히 XAUUSD, BTCUSD 및 주요 외환 통화쌍에 적합합니다. 독립형 시스템으로 사용하거나 기존 거래 전략에 유연하게 통합할 수 있습니다. 이 인디케이터는 11개 이상의 필터를 통합하며, 빠른/느린 EMA, 추세 판별용 3개의 EMA, EMA 기울기(EMA slope), RSI, ADX, 거래량(Volume), VWAP, 볼린저 밴드 돌파(Bollinger Bands Breakout) 및 MACD 다이버전스 필터 등을 포함합니다. 스마트 캔들 필터는 캔들 종가를 확인하여 약한 신호를 제거하고, 3 EMA와 MACD 다이버전스 필터를 결합한 추세 인식 메커니즘은 더 높은 승률의 신호를 선별하는 데 도움을 줍니
Divergence Bomber
Ihor Otkydach
4.89 (82)
이 지표를 구매하신 분께는 다음과 같은 혜택이 무료로 제공됩니다: 각 거래를 자동으로 관리하고, 손절/익절 수준을 설정하며, 전략 규칙에 따라 거래를 종료하는 전용 도우미 툴 "Bomber Utility" 다양한 자산에 맞게 지표를 설정할 수 있는 셋업 파일(Set Files) "최소 위험", "균형 잡힌 위험", "관망 전략" 모드로 설정 가능한 Bomber Utility의 셋업 파일 이 전략을 빠르게 설치, 설정, 시작할 수 있도록 돕는 단계별 영상 매뉴얼 주의: 위의 모든 보너스를 받기 위해서는 MQL5 개인 메시지 시스템을 통해 판매자에게 연락해 주세요. 독창적인 커스텀 지표인 “Divergence Bomber(다이버전스 봄버)”를 소개합니다. 이 지표는 MACD 다이버전스(괴리) 전략을 기반으로 한 올인원(All-in-One) 거래 시스템입니다. 이 기술 지표의 주요 목적은 가격과 MACD 지표 간의 다이버전스를 감지하고, **향후 가격이 어느 방향으로 움직일지를 알려주는
FX Trend MT5 NG
Daniel Stein
5 (4)
FX Trend NG: 차세대 멀티 마켓 트렌드 인텔리전스 개요 FX Trend NG 는 다중 시간 프레임 기반의 전문 트렌드 분석 및 시장 모니터링 도구입니다. 몇 초 만에 전체 시장 구조를 파악할 수 있도록 설계되었습니다. 여러 차트를 일일이 전환할 필요 없이, 어떤 종목이 추세에 있는지, 어디에서 모멘텀이 약화되고 있는지, 그리고 어떤 시간 프레임이 서로 정렬되어 있는지 즉시 확인할 수 있습니다. 출시 기념 특별 혜택 – FX Trend NG 를 $30 (6개월) 또는 $80 평생 라이선스 로 이용할 수 있습니다. 이미 Stein Investments 고객이신가요? -> 메시지를 보내 전용 고객 그룹에 참여하세요. 설정이나 사용 방법이 필요하신가요? -> Stein Investments 공식 페이지 를 방문하세요. 1. FX Trend NG가 특별한 이유 3단계 추세 로직 – 단순한 Buy / Sell이 아닙니다 • 대부분의 지표는 Buy 또는 Sell 두 가지 상태만 제
Entry In The Zone and SMC Multi Timeframe is a real-time market analysis tool developed based on Smart Money Concepts (SMC). It is designed to analyze market structure, price direction, reversal points, and key zones across multiple timeframes in a systematic way. The system displays Points of Interest (POI) and real-time No Repaint signals, with instant alerts when price reaches key zones or when signals occur within those zones. It functions as both an Indicator and a Signal System (2-in-1), c
ARIPoint
Temirlan Kdyrkhan
ARIPoint is a powerful trading companion designed to generate high-probability entry signals with dynamic TP/SL/DP levels based on volatility. Built-in performance tracking shows win/loss stats, PP1/PP2 hits, and success rates all updated live. Key Features: Buy/Sell signals with adaptive volatility bands Real-time TP/SL/DP levels based on ATR Built-in MA Filter with optional ATR/StdDev volatility Performance stats panel (Success, Profit/Loss, PP1/PP2) Alerts via popup, sound, push, or email Cu
Power Candles MT5
Daniel Stein
5 (6)
Power Candles – 모든 시장을 위한 강도 기반 진입 신호 Power Candles 는 Stein Investments의 검증된 강도 분석을 가격 차트에 직접 제공합니다. 가격 움직임에만 반응하는 대신, 각 캔들은 실제 시장 강도를 기준으로 색상화되어 모멘텀 형성, 강도 가속, 명확한 추세 전환을 즉시 파악할 수 있습니다. 모든 시장을 위한 단일 로직 Power Candles는 모든 거래 심볼 에서 자동으로 작동합니다. 현재 심볼이 Forex인지 비-Forex 시장인지 자동으로 감지하여 내부적으로 적절한 강도 모델을 적용합니다. Forex 및 Gold 는 FX Power Delta 값을 사용합니다 (절대값 범위 최대 100) 지수, 크립토 및 CFD 는 IX Power Strength 값을 사용합니다 (절대값 범위 최대 50) 필요한 강도 계산은 Power Candles에 완전히 내장되어 있습니다. 캔들 색상이나 신호 로직을 위해 추가 인디케이터는 필요하지 않습니다. 가격
Game Changer Indicator mt5
Vasiliy Strukov
4.79 (19)
Game Changer는 모든 금융 상품에 적용 가능한 혁신적인 추세 지표로, MetaTrader를 강력한 추세 분석 도구로 탈바꿈시켜 줍니다. 모든 시간대에서 작동하며 추세 식별, 잠재적 반전 신호 제공, 트레일링 스톱 기능, 그리고 신속한 시장 대응을 위한 실시간 알림 기능을 제공합니다. 숙련된 전문가든 이제 막 시작하는 초보자든, Game Changer는 추세의 역학을 명확하게 이해하고 자신감 있고 규율 있는 거래를 할 수 있도록 도와줍니다. 이 지표는 차트 재구성 기능을 지원합니다. 구매 후 즉시 연락 주시면 특별 보너스를 드립니다. Strong Support 및 Trend Scanner 지표를 무료로 제공해 드립니다. [email protected]으로 메시지를 보내주세요. 참고로, 저는 텔레그램에서 EA나 특별 세트를 판매하지 않습니다. 모든 EA는 MQL5에서만 사용 가능하며, 세트 파일은 제 블로그(여기)에서만 다운로드하실 수 있습니다. 사기꾼을 조심하시고 다른 사
Azimuth Pro
Ottaviano De Cicco
5 (4)
LAUNCH PROMO Azimuth Pro price is initially set at 299$ for the first 100 buyers. Final price will be 499$ . THE DIFFERENCE BETWEEN RETAIL AND INSTITUTIONAL ENTRIES ISN'T THE INDICATOR — IT'S THE LOCATION. Most traders enter at arbitrary price levels, chasing momentum or reacting to lagging signals. Institutions wait for price to reach structured levels where supply and demand actually shift. Azimuth Pro maps these levels automatically: swing-anchored VWAP, multi-timeframe structure lines, an
FX Power MT5 NG
Daniel Stein
5 (31)
FX Power: 통화 강세 분석으로 더 스마트한 거래 결정을 개요 FX Power 는 어떤 시장 상황에서도 주요 통화와 금의 실제 강세를 이해하기 위한 필수 도구입니다. 강한 통화를 매수하고 약한 통화를 매도함으로써 FX Power 는 거래 결정을 단순화하고 높은 확률의 기회를 발견합니다. 트렌드를 따르거나 극단적인 델타 값을 사용해 반전을 예측하고자 한다면, 이 도구는 귀하의 거래 스타일에 완벽히 적응합니다. 단순히 거래하지 말고, FX Power 로 더 스마트하게 거래하세요. 1. FX Power가 거래자에게 매우 유용한 이유 통화와 금의 실시간 강세 분석 • FX Power 는 주요 통화와 금의 상대적 강세를 계산하고 표시하여 시장 역학에 대한 명확한 통찰력을 제공합니다. • 어떤 자산이 앞서고 있고 어떤 자산이 뒤처지는지 모니터링하여 보다 현명한 거래 결정을 내릴 수 있습니다. 포괄적인 멀티 타임프레임 뷰 • 단기, 중기 및 장기 타임프레임에서 통화와 금의 강세를
Trend Screener Pro MT5
STE S.S.COMPANY
4.84 (101)
트렌드 표시기, 트렌드 트레이딩 및 필터링을 위한 획기적인 고유 솔루션, 하나의 도구 안에 내장된 모든 중요한 트렌드 기능! Forex, 상품, 암호 화폐, 지수 및 주식과 같은 모든 기호/도구에 사용할 수 있는 100% 다시 칠하지 않는 다중 시간 프레임 및 다중 통화 표시기입니다. Trend Screener는 차트에 점이 있는 화살표 추세 신호를 제공하는 효율적인 지표 추세 추종 지표입니다. 추세 분석기 표시기에서 사용할 수 있는 기능: 1. 트렌드 스캐너. 2. 최대 이익 분석이 있는 추세선. 3. 추세 통화 강도 측정기. 4. 경고가 있는 추세 반전 점. 5. 경고가 있는 강력한 추세 점. 6. 추세 화살표 Trend Screener Indicator가 있는 일일 분석 예, 일일 신호 성능...등은 여기에서 찾을 수 있습니다. 여기를 클릭하십시오. LIMITED TIME OFFER : Trend Screener Indicator는 50$ 및 평생 동안만 사용할 수 있습니다.
Atomic Analyst MT5
Issam Kassas
4.07 (28)
우선적으로 언급할 점은이 거래 지표가 다시 그리지 않고 지연되지 않으며 이를 통해 수동 및 로봇 거래 모두에 이상적이라는 점입니다. 사용자 매뉴얼: 설정, 입력 및 전략. Atomic Analyst는 가격의 강도와 모멘텀을 활용하여 시장에서 더 나은 이점을 찾는 PA Price Action Indicator입니다. 고급 필터를 장착하여 잡음과 거짓 신호를 제거하고 거래 잠재력을 높이는 데 도움이 됩니다. 복잡한 지표의 다중 레이어를 사용하여 Atomic Analyst는 차트를 스캔하고 복잡한 수학적 계산을 간단한 신호와 색상으로 변환하여 초보 트레이더가 이해하고 일관된 거래 결정을 내릴 수 있도록합니다. "Atomic Analyst"는 새로운 및 경험이 풍부한 트레이더를위한 종합적인 거래 솔루션입니다. 프리미엄 지표와 최고 수준의 기능을 하나의 거래 전략에 결합하여 모든 종류의 트레이더에 대한 다재다능한 선택지가되었습니다. 인트라데이 거래 및 스캘핑 전략 : 빠르고 정확한 일일
Smart Stop Indicator – 차트 위에서 직접 작동하는 지능형 스톱로스 시스템 개요 Smart Stop Indicator는 감이나 추측이 아닌 명확하고 체계적인 방식으로 스톱로스를 설정하고 싶은 트레이더를 위한 맞춤형 솔루션입니다. 이 도구는 클래식 프라이스 액션 논리(고점, 저점 구조)와 현대적인 브레이크아웃 인식을 결합하여 실제로 가장 논리적인 다음 스톱 레벨을 정확히 식별합니다. 추세, 박스권, 빠른 브레이크아웃 상황 등 어떤 시장에서도 인디케이터는 최적의 SL 구역과 상태(“new”, “broken”, “valid”)를 차트에 직접 표시합니다. 새로운 기능으로 SL 거리의 %ADR 표시가 추가되었습니다. 핵심 기능 자동 시장구조 기반 스톱 설정 • 시장 구조와 실시간 가격 움직임을 기반으로 의미 있는 스톱로스 레벨을 자동으로 탐지합니다. 스마트 브레이크아웃 감지 • 빠른 방향 변화나 돌파 상황에서도 불필요한 조기 스톱 조정을 강요하지 않으며 유연하게 반응합
Entry Points Pro for MT5
Yury Orlov
4.48 (138)
다시 색을 칠하지 않고 거래에 진입할 수 있는 정확한 신호를 제공하는 MT5용 지표입니다. 외환, 암호화폐, 금속, 주식, 지수 등 모든 금융 자산에 적용할 수 있습니다. 매우 정확한 추정값을 제공하고 매수와 매도의 가장 좋은 시점을 알려줍니다. 하나의 시그널로 수익을 내는 지표의 예와 함께 비디오 (6:22)시청하십시오! 대부분의 거래자는 Entry Points Pro 지표의 도움으로 첫 거래 주 동안 트레이딩 결과를 개선합니다. 저희의   Telegram Group 을 구독하세요! Entry Points Pro 지표의 좋은점. 재도색이 없는 진입 신호 신호가 나타나고 확인되면(시그널 캔들이 완성된 경우) 신호는 더 이상 사라지지 않습니다. 여타 보조지표의 경우 신호를 표시한 다음 제거되기 때문에 큰 재정적 손실로 이어집니다. 오류 없는 거래 게시 알고리즘을 통해 트레이드(진입 또는 청산)를 할 이상적인 순간을 찾을 수 있으며, 이를 통해 이를 사용하는 모든 거래자의 성공률이
Grabber System MT5
Ihor Otkydach
4.82 (22)
탁월한 기술적 지표인 Grabber를 소개합니다. 이 도구는 즉시 사용 가능한 “올인원(All-Inclusive)” 트레이딩 전략으로 작동합니다. 하나의 코드 안에 강력한 시장 기술 분석 도구, 매매 신호(화살표), 알림 기능, 푸시 알림이 통합되어 있습니다. 이 인디케이터를 구매하신 모든 분들께는 다음의 항목이 무료로 제공됩니다: Grabber 유틸리티: 오픈 포지션을 자동으로 관리하는 도구 단계별 영상 매뉴얼: 설치, 설정, 그리고 실제 거래 방법을 안내 맞춤형 세트 파일: 인디케이터를 빠르게 자동 설정하여 최고의 성과를 낼 수 있도록 도와줍니다 다른 전략은 이제 잊어버리세요! Grabber만이 여러분을 새로운 트레이딩의 정점으로 이끌어 줄 수 있습니다. Grabber 전략의 주요 특징: 거래 시간 프레임: M5부터 H4까지 거래 가능한 자산: 어떤 자산이든 사용 가능하지만, 제가 직접 테스트한 종목들을 추천드립니다 (GBPUSD, GBPCAD, GBPCHF, AUDCAD, AU
Quantum TrendPulse
Bogdan Ion Puscasu
5 (20)
SuperTrend   ,   RSI   ,   Stochastic   의 힘을 하나의 포괄적인 지표로 결합하여 트레이딩 잠재력을 극대화하는 궁극의 트레이딩 도구   인 Quantum TrendPulse를   소개합니다. 정밀성과 효율성을 추구하는 트레이더를 위해 설계된 이 지표는 시장 추세, 모멘텀 변화, 최적의 진입 및 종료 지점을 자신 있게 식별하는 데 도움이 됩니다. 주요 특징: SuperTrend 통합:   주요 시장 추세를 쉽게 따라가고 수익성의 물결을 타세요. RSI 정밀도:   매수 과다 및 매도 과다 수준을 감지하여 시장 반전 시점을 파악하는 데 적합하며 SuperTrend 필터로 사용 가능 확률적 정확도:   변동성이 큰 시장에서 숨겨진 기회를 찾기 위해 확률적 진동   을 활용하고 SuperTrend의 필터로 사용 다중 시간대 분석:   M5부터 H1 또는 H4까지 다양한 시간대에 걸쳐 시장을 최신 상태로 유지하세요. 맞춤형 알림:   맞춤형 거래 조건이 충족되면
FX Levels MT5
Daniel Stein
5 (13)
FX Levels: 모든 시장을 위한 뛰어난 정확도의 지지와 저항 간단 요약 통화쌍, 지수, 주식, 원자재 등 어떤 시장이든 믿을 만한 지지·저항 레벨을 찾고 싶나요? FX Levels 는 전통적인 “Lighthouse” 기법과 첨단 동적 접근을 결합해, 거의 보편적인 정확성을 제공합니다. 실제 브로커 경험을 반영하고, 자동화된 일별 업데이트와 실시간 업데이트를 결합함으로써 FX Levels 는 가격 반전 포인트를 파악하고, 수익 목표를 설정하며, 자신 있게 트레이드를 관리할 수 있게 돕습니다. 지금 바로 시도해 보세요—정교한 지지/저항 분석이 어떻게 여러분의 트레이딩을 한 단계 끌어올릴 수 있는지 직접 확인하세요! 1. FX Levels가 트레이더에게 매우 유용한 이유 뛰어난 정확도의 지지·저항 존 • FX Levels 는 다양한 브로커 환경에서도 거의 동일한 존을 생성하도록 설계되어, 데이터 피드나 시간 설정 차이로 인한 불일치를 해소합니다. • 즉, 어떤 브로커를 사용하
우선적으로, 이 거래 도구는 전문적인 거래에 이상적인 비-다시 그리기 및 지연되지 않는 지표입니다.  온라인 강좌, 사용자 매뉴얼 및 데모. 스마트 가격 액션 컨셉트 인디케이터는 신규 및 경험 많은 트레이더 모두에게 매우 강력한 도구입니다. Inner Circle Trader Analysis 및 Smart Money Concepts Trading Strategies와 같은 고급 거래 아이디어를 결합하여 20가지 이상의 유용한 지표를 하나로 결합합니다. 이 인디케이터는 스마트 머니 컨셉트에 중점을 두어 대형 기관의 거래 방식을 제공하고 이동을 예측하는 데 도움을 줍니다.  특히 유동성 분석에 뛰어나 기관이 어떻게 거래하는지 이해하는 데 도움을 줍니다. 시장 트렌드를 예측하고 가격 변동을 신중하게 분석하는 데 탁월합니다. 귀하의 거래를 기관 전략에 맞추어 시장의 동향에 대해 더 정확한 예측을 할 수 있습니다. 이 인디케이터는 시장 구조를 분석하고 중요한 주문 블록을 식별하고 다양
RFI levels PRO MT5
Roman Podpora
5 (2)
이 지표는 추세 반전 지점과 가격 반등 영역을 정확하게 보여줍니다.       주요 투자자들   . 새로운 트렌드가 형성되는 곳을 파악하고 최대한 정확하게 의사결정을 내리며 모든 거래를 완벽하게 통제합니다. TREND LINES PRO   지표와 함께 사용할 때 최대의 잠재력을 발휘합니다.  VERSION MT4 지표가 보여주는 내용: 새로운 추세의 시작 시 활성화되는 반전 구조 및 반전 수준. 최소한의 위험 대비 수익률을 갖는 이익 실현   (TAKE PROFIT)   및   손절매(STOP LOSS)   레벨 표시       RR 1:2   . 지능형 손실 감소 로직이 적용된 손절매 기능. 지정된 지표에서 두 가지 추세 유형에 대한 반전 패턴을 표시합니다. 지표: 트렌드를 따라   트렌드 라인 프로   (글로벌 트렌드 변화) 트렌드 프로   (빠른 트렌드 변화) 간단하고 효과적입니다       스캐너       실시간 추세 (신규). 다중 시간 프레임 도구 필터링. 표시하다  
Berma Bands
Muhammad Elbermawi
5 (8)
Berma Bands(BBs) 지표는 시장 동향을 파악하고 이를 활용하려는 트레이더에게 귀중한 도구입니다. 가격과 BBs 간의 관계를 분석함으로써 트레이더는 시장이 추세 단계인지 범위 단계인지를 분별할 수 있습니다. 자세한 내용을 알아보려면 [ Berma Home Blog ]를 방문하세요. 버마 밴드는 세 개의 뚜렷한 선으로 구성되어 있습니다. 어퍼 버마 밴드, 미들 버마 밴드, 로어 버마 밴드입니다. 이 선들은 가격 주위에 그려져 전체 추세에 대한 가격 움직임을 시각적으로 표현합니다. 이 밴드들 사이의 거리는 변동성과 잠재적인 추세 반전에 대한 통찰력을 제공할 수 있습니다. 버마 밴드 라인이 각각에서 분리될 때, 그것은 종종 시장이 횡보 또는 범위 이동 기간에 접어들고 있음을 시사합니다. 이는 명확한 방향 편향이 없음을 나타냅니다. 트레이더는 이러한 기간 동안 추세를 파악하기 어려울 수 있으며 더 명확한 추세가 나타날 때까지 기다릴 수 있습니다. 버마 밴드 라인이 단일 라인으로
매일 많은 트레이더들이 공통적인 도전에 직면합니다: 가격이 주요 레벨을 돌파하는 것처럼 보여 거래에 진입하면, 시장이 반전하여 스톱로스가 발동됩니다. 이것을 거짓 돌파(False Breakout)라고 합니다 — 가격이 지지 또는 저항 수준을 잠시 넘어선 후 방향을 반전하는 움직임입니다. 이러한 움직임은 실제 가격 방향이 명확해지기 전에 스톱로스가 발동되는 결과를 초래할 수 있습니다. 기술적 분석에서 이 현상은 일반적으로 "유동성 스윕"(liquidity sweep) 또는 "스톱 헌팅"(stop hunt)이라고 합니다. Mirage Trading System은 거짓 돌파 패턴을 감지하도록 설계된 지표입니다. "Mirage"(신기루)라는 이름은 시장에서 빈번하게 발생하는 기만적인 가격 움직임이라는 환상을 의미합니다. 거짓 돌파가 많은 트레이더를 당황하게 할 수 있지만, Mirage Trading System은 이러한 패턴이 언제 형성되는지 식별하고 후속 가격 움직임의 잠재적 방향을 나
트렌드 라인즈 프로       이 지표는 시장이 실제로 어떤 방향으로 전환되는지 파악하는 데 도움이 됩니다. 실제 추세 반전 지점과 주요 시장 참여자들이 다시 진입하는 지점을 보여줍니다. 보시다시피       BOS 라인       복잡한 설정이나 불필요한 노이즈 없이 더 높은 시간대의 추세 변화와 주요 레벨을 확인할 수 있습니다. 신호는 차트에 다시 그려지지 않고 캔들이 마감된 후에도 계속 표시됩니다. MT4 버전   -   RFI LEVELS PRO   표시기   와 결합 시 최대 잠재력을 발휘합니다. 지표가 보여주는 내용: 실제 변화       추세(BOS 라인) 한 번 신호가 나타나면 그 신호는 계속 유효합니다! 이는 신호를 발생시킨 후 변경될 수 있는 리페인팅 방식의 지표와 중요한 차이점입니다. 리페인팅 방식의 지표는 잠재적으로 자금 손실로 이어질 수 있습니다. 이제 더욱 높은 확률과 정확도로 시장에 진입할 수 있습니다. 또한 화살표가 나타난 후 목표가(익절)에 도달하거나
Pointer Trend Switch — precision trend reversal indicator Pointer Trend Switch is a high-precision arrow indicator designed to detect key moments of trend reversal based on asymmetric price behavior within a selected range of bars. It identifies localized price impulses by analyzing how far price deviates from the opening level, helping traders find accurate entry points before a trend visibly shifts. This indicator is ideal for scalping, intraday strategies, and swing trading, and performs equa
Trend indicator AI mt5
Ramil Minniakhmetov
5 (15)
트렌드 인공 지능 지표는 실행 가능한 진입 점 및 반전 경고와 추세 식별을 결합하여 상인의 시장 분석을 향상시킬 훌륭한 도구입니다. 이 표시기는 사용자가 자신감과 정밀도로 외환 시장의 복잡성을 탐색 할 수 있도록 지원합니다 기본 신호 외에도 트렌드 인공 지능 지표는 풀백 또는 되돌림 중에 발생하는 2 차 진입 점을 식별하여 거래자가 기존 트렌드 내에서 가격 수정을 활용할 수 있도록합니다. 중요한 장점: ·작동 4 및 5 *명확한 구매 또는 판매 신호 *다시 칠하지 않습니다 *모든 자산에서 작동 나는 전보 사기에 개 또는 세트를 판매하지 않도록주의. 모든 설정은 블로그에 여기에 무료.  중요! 지침 및 보너스를 얻기 위해 구입 후 즉시 저에게 연락! 진짜 가동 감시는 뿐 아니라 나의 다른 제품 여기에서 찾아낼 수 있습니다: https://www.mql5.com/en/users/mechanic/seller&nbsp ; 설정 및 입력: 모든 자산에 대해 기본 설정을 권
Crystal Heikin Ashi Signals - Professional Trend & Signal Detection Indicator Advanced Heikin Ashi Visualization with Intelligent Signal System for Manual & Automated Trading Final Price: $149 ---------> Price goes up $10 after every 10 sales . Limited slots available — act fast . Overview Crystal Heikin Ashi Signals is a professional-grade MetaTrader 5 indicator that combines pure Heikin Ashi candle visualization with an advanced momentum-shift detection system. Designed for both manual traders
소개       Quantum Breakout PRO   , 브레이크아웃 존 거래 방식을 변화시키는 획기적인 MQL5 지표! 13년 이상의 거래 경험을 가진 숙련된 트레이더 팀이 개발한       퀀텀 브레이크아웃 PRO       혁신적이고 역동적인 브레이크아웃 존 전략으로 거래 여정을 새로운 차원으로 끌어올리도록 설계되었습니다. Quantum Breakout Indicator는 5개의 이익 목표 영역이 있는 브레이크아웃 영역의 신호 화살표와 브레이크아웃 상자를 기반으로 한 손절 제안을 제공합니다. 초보자 거래자와 전문 거래자 모두에게 적합합니다. Quantum EA 채널:       여기를 클릭하세요 중요한! 구매 후 설치 매뉴얼을 받으려면 개인 메시지를 보내주십시오. 추천: 기간: M15 통화쌍: GBPJPY, EURJPY, USDJPY,NZDUSD, XAUUSD 계정 유형: 스프레드가 매우 낮은 ECN, Raw 또는 Razor 브로커 시간: GMT +3 중개인 :
IX Power MT5
Daniel Stein
4.92 (12)
IX Power: 지수, 원자재, 암호화폐 및 외환 시장 통찰력을 발견하세요 개요 IX Power 는 지수, 원자재, 암호화폐 및 외환 시장의 강도를 분석할 수 있는 다목적 도구입니다. FX Power 는 모든 가용 통화 쌍 데이터를 사용하여 외환 쌍에 대해 가장 높은 정확도를 제공하는 반면, IX Power 는 기초 자산 시장 데이터에만 초점을 맞춥니다. 이로 인해 IX Power 는 비외환 시장에 이상적이며, 다중 쌍 분석이 필요하지 않은 간단한 외환 분석에도 신뢰할 수 있는 도구입니다. 모든 차트에서 매끄럽게 작동하며, 거래 결정을 향상시키기 위한 명확하고 실행 가능한 통찰력을 제공합니다. 1. IX Power가 트레이더에게 유용한 이유 다양한 시장 강도 분석 • IX Power 는 지수, 원자재, 암호화폐 및 외환 심볼의 강도를 계산하여 각 시장에 맞는 통찰력을 제공합니다. • US30, WTI, 금, 비트코인 또는 통화 쌍과 같은 자산을 모니터링하여 거래 기회를 발견
Transaction Speed MT5
Ivan Stefanov
5 (3)
이 지표는 시장에서 관심이 나타나는 영역 을 강조 표시한 후, 주문이 누적되는 영역 을 보여줍니다. 이는 **대규모 오더북(호가창)**처럼 작동합니다. 이것은 거대한 자금 을 위한 인디케이터입니다. 성능은 탁월하며, 시장에서 어떤 관심이 있든 반드시 포착할 수 있습니다 . (이것은 완전히 새로 작성되고 자동화된 버전 입니다 – 이제 수동 분석은 필요하지 않습니다.) **거래 속도(Transaction Speed)**는 새로운 개념의 인디케이터로, 시장에 대규모 주문이 언제, 어디에 쌓이는지를 보여주며 , 그 이점을 분석합니다. 매우 초기 단계에서 트렌드 전환 을 감지할 수 있습니다. FX 시장에서 흔히 사용하는 "거래량(volume)"은 오해입니다. 실제로는 시간당 가격 변화량 이므로, 올바른 용어는 거래 속도 입니다. 우리가 어떻게 사고하고, 행동하며, 분석하느냐 가 가장 중요합니다. 분석 패러다임의 전환 은 필수적입니다. 이 인디케이터는 외환 시장에서의 볼륨 개념을 논리적으로
Market Structure Order Block Dashboard MT5 는 MetaTrader 5용 MT5 인디케이터 로, 시장 구조 및 ICT / Smart Money Concepts에 기반합니다: HH/HL/LH/LL , BOS , ChoCH 뿐 아니라 Order Blocks , Fair Value Gaps (FVG) , 유동성 (EQH/EQL, sweeps), 세션 / Kill Zones , 그리고 Volume Profile 을 통합하여 콤팩트한 컨플루언스 대시보드를 제공합니다. 중요: 본 제품은 분석 도구 입니다. 자동 매매를 실행하지 않습니다( EA가 아님 ). 구매자 보너스 구매 후 제 스토어에서 보너스 인디케이터 2개 를 (선택하여) 무료로 받을 수 있습니다. 보너스 수령 방법: 1) 본 제품에 대한 솔직한 리뷰를 남겨주세요. 2) MQL5 메시지로 BONUS MSOB + 선택한 인디케이터 2개 이름 을 보내주세요. 주요 기능 시장 구조: HH/HL/LH/LL
Advanced Supply Demand MT5
Bernhard Schweigert
4.5 (14)
현재 33% 할인! 초보자나 전문 트레이더를 위한 최고의 솔루션! 이 보조지표는 우리가 다수의 독창적 기능과 새로운 공식을 통합한 독특하고 고품질이며 저렴한 거래 도구입니다. 이 업데이트를 통해 이중 시간대를 표시할 수 있습니다. 더 높은 TF를 표시할 수 있을 뿐만 아니라 차트 TF와 더 높은 TF 모두를 표시할 수 있습니다: 중첩 영역 표시. 모든 Supply Demand 트레이더들이 좋아할 것입니다. :) 중요한 정보 공개 Advanced Supply Demand의 잠재력을 극대화하려면 다음을 방문하십시오. https://www.mql5.com/ko/blogs/post/720245   진입 또는 목표의 명확한 트리거 포인트를 정확히 찾아냄으로 해서 거래가 어떻게 개선될지 상상해 보십시오. 새로운 알고리즘을 기반으로 매수자와 매도자 간의 잠재적인 불균형을 훨씬 더 쉽게 분간할 수 있습니다. 왜냐하면 가장 강한 공급영역과 가장 강한 수요 영역과 과거에 어떻게 진행 되었는지를(이전
제작자의 제품 더 보기
Alpha Wave Buy Sell Signal
Francois Phillipus Van Niekerk
Alpha Wave Indicator: Pure Precision! This is a tool that will take your trading to the next level. Believe me!! This advanced tool uses a Gaussian window to smooth price data, plotting green upper and red lower bands to identify key trends. With customizable bandwidth, multiplier, and lookback period, plus crossover arrows for clear signals, Alpha Wave helps you navigate the market with confidence. Perfect for traders seeking reliable, non-repainting insights, it can be used on multiple currenc
Power Pulse
Francois Phillipus Van Niekerk
5 (1)
The Digital Buy/Sell Power Indicator is an advanced, visually intuitive tool that monitors buying and selling pressure across timeframes (M1 to Monthly), displaying momentum on a 0-100 scale with glowing digital readouts. Equipped with a movable panel, timeframe toggle switches, and a weighted algorithm for accurate Buy/Sell/Neutral signals, it provides traders with precise, actionable market dynamics. All time frames can be used at once to give a better perspective of market direction. Lowerin
FREE
Aurex
Francois Phillipus Van Niekerk
Aurex EA is a sophisticated  GOLD(XAUUSD)  trading robot designed for Meta Trader 5, optimized for the M1 (1-minute) timeframe. It combines technical indicators like RSI and engulfing candle patterns with advanced risk management and a recovery strategy to execute trades. The EA features customizable trading sessions, a news filter to avoid high/medium-impact events, and a trailing stop system. Aurex has shown superior performance on live accounts compared to back testing, making it a versatile
The Alpha
Francois Phillipus Van Niekerk
The Alpha: Your Ultimate Trend-Tracking Powerhouse Dive into the markets with The Alpha , a dynamic MetaTrader 5 indicator that supercharges your trading with its core SuperTrend component. Built on the robust Average True Range (ATR), The Alpha delivers crystal-clear, color-coded signals to help traders of all levels conquer trends with precision and flair. How The Alpha’s  Works : ATR-Powered Precision : The Alpha uses the ATR (default period: 20) and a multiplier (default: 1.5) to calculate a
Gold Challenger
Francois Phillipus Van Niekerk
GOLD CHALLENGER EA Challenge The Market. Claim Your Victory. - Use VPS for uninterrupted EA functionality - Recommended time frame for best performance = *****DAily(D1)***** - Minimum account size to start = $50 - Recommended account size = $2000+ - .Set files available on request The Technology Gold Challenger EA uses a proprietary Price Memory Algorithm that does what traditional indicators cannot — it remembers how price has behaved and adapts to changing market conditions in real-tim
필터:
리뷰 없음
리뷰 답변