Vwap Matrix Price Levels Pro

VWAP Matrix Price Levels Pro: The Ultimate VWAP Indicator for MT5 with Dynamic Price Levels

Dominate the Market with the Perfect Confluence of Multiple VWAPs and Percentage-Based Price Projections. The Precision Tool for Day Traders and Swing Traders on MetaTrader 5.

The VWAP Matrix Price Levels Pro is an elite indicator for MetaTrader 5, designed for traders who demand precision and a superior market view. Elevate your technical analysis by combining, in a single tool, the institutional power of VWAP (Volume Weighted Average Price) with an innovative price level projection system.

This isn't just another VWAP indicator. It's a complete system that reveals the true liquidity structure and key decision points in the market, giving you a crucial competitive edge in your day trading and swing trading operations.

🔍 A New Dimension in Market Analysis with this MT5 Indicator

While most indicators are limited to simple averages or static levels, the VWAP Matrix Price Levels Pro provides a multidimensional view of order flow and volatility.

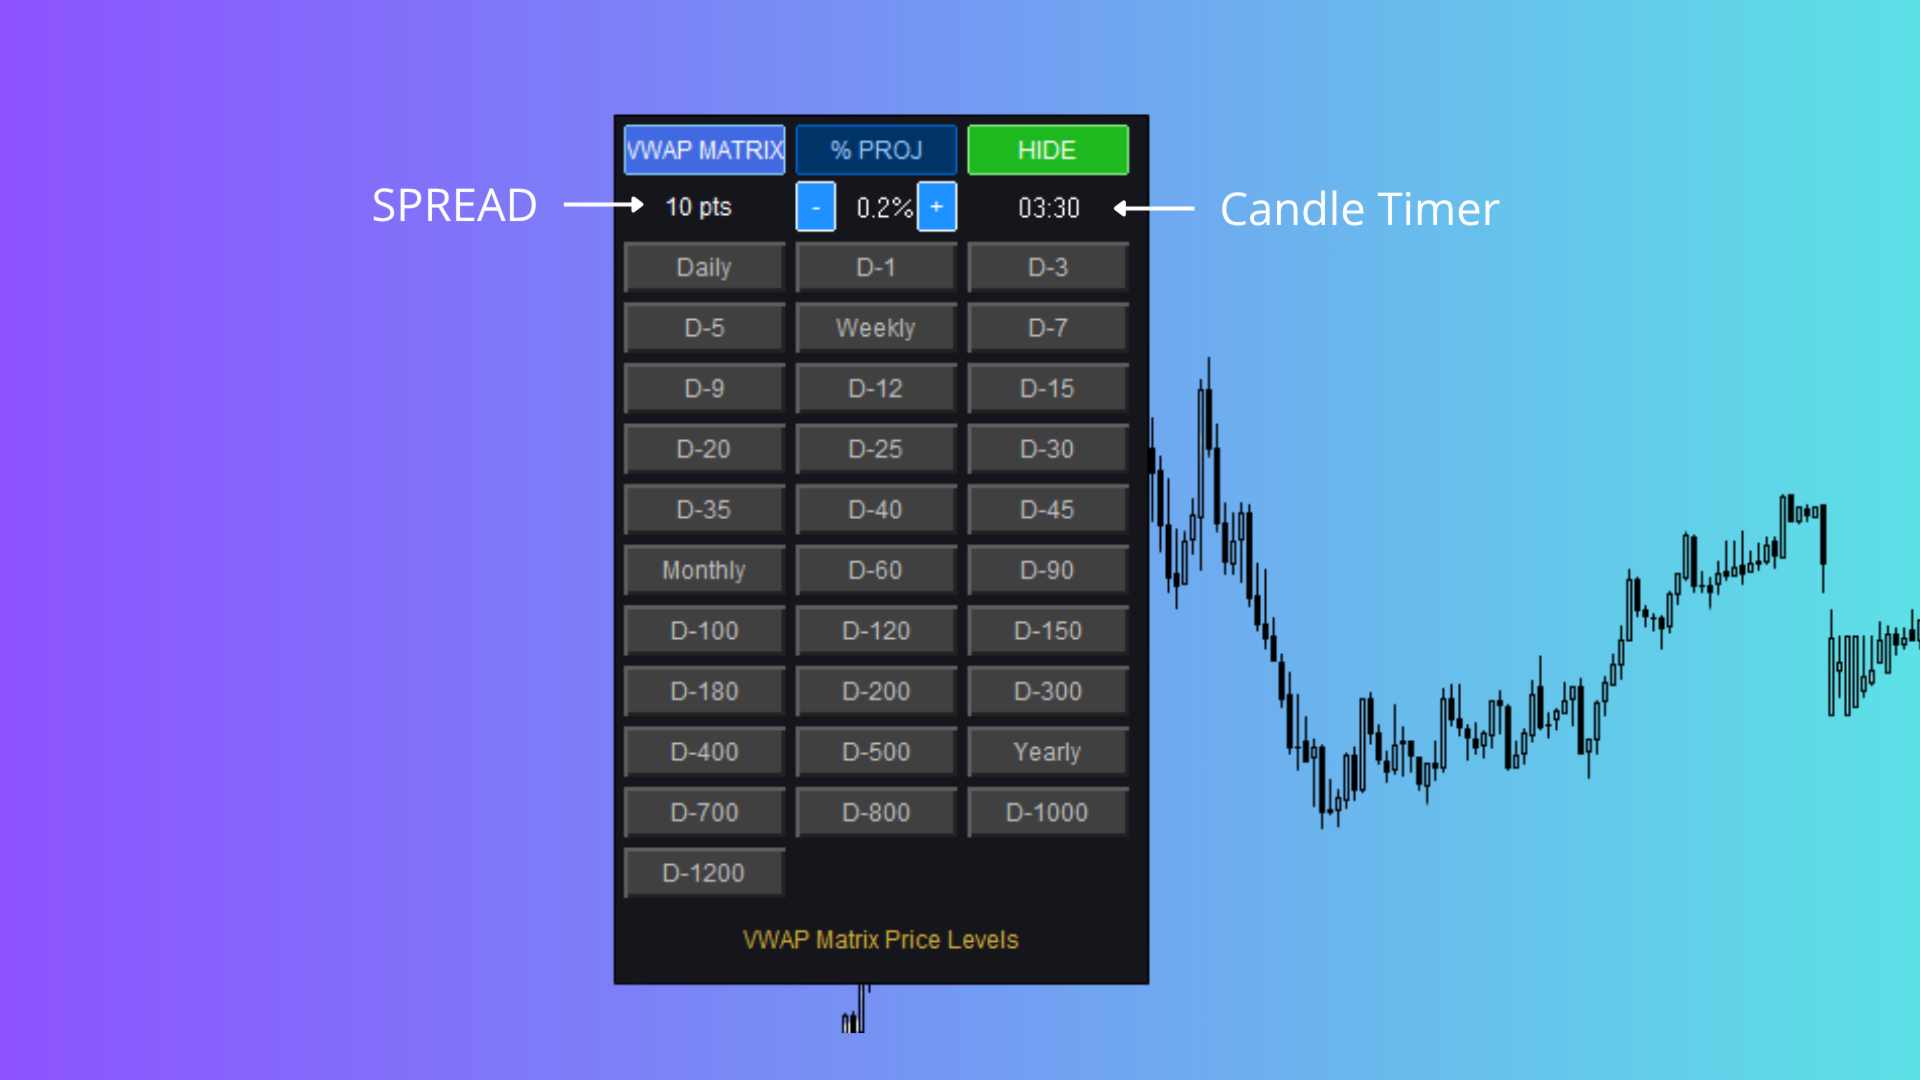
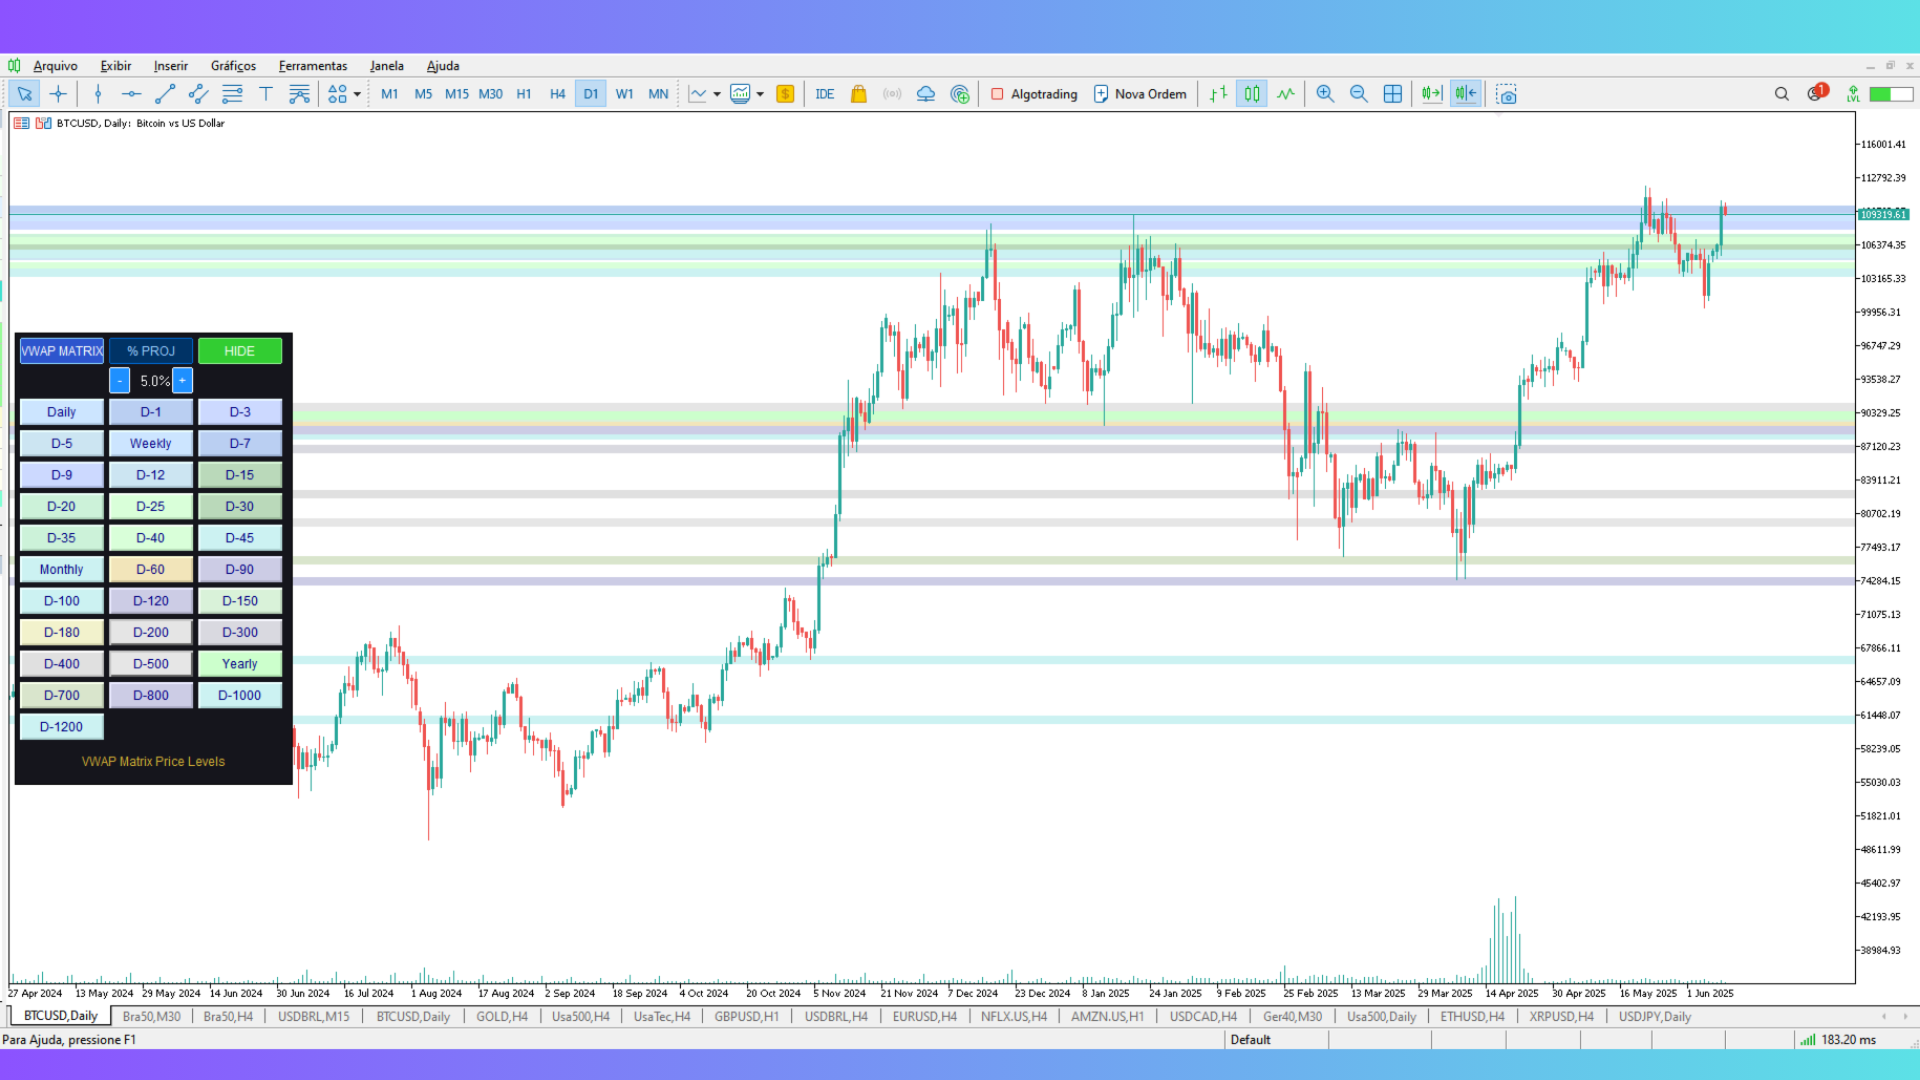
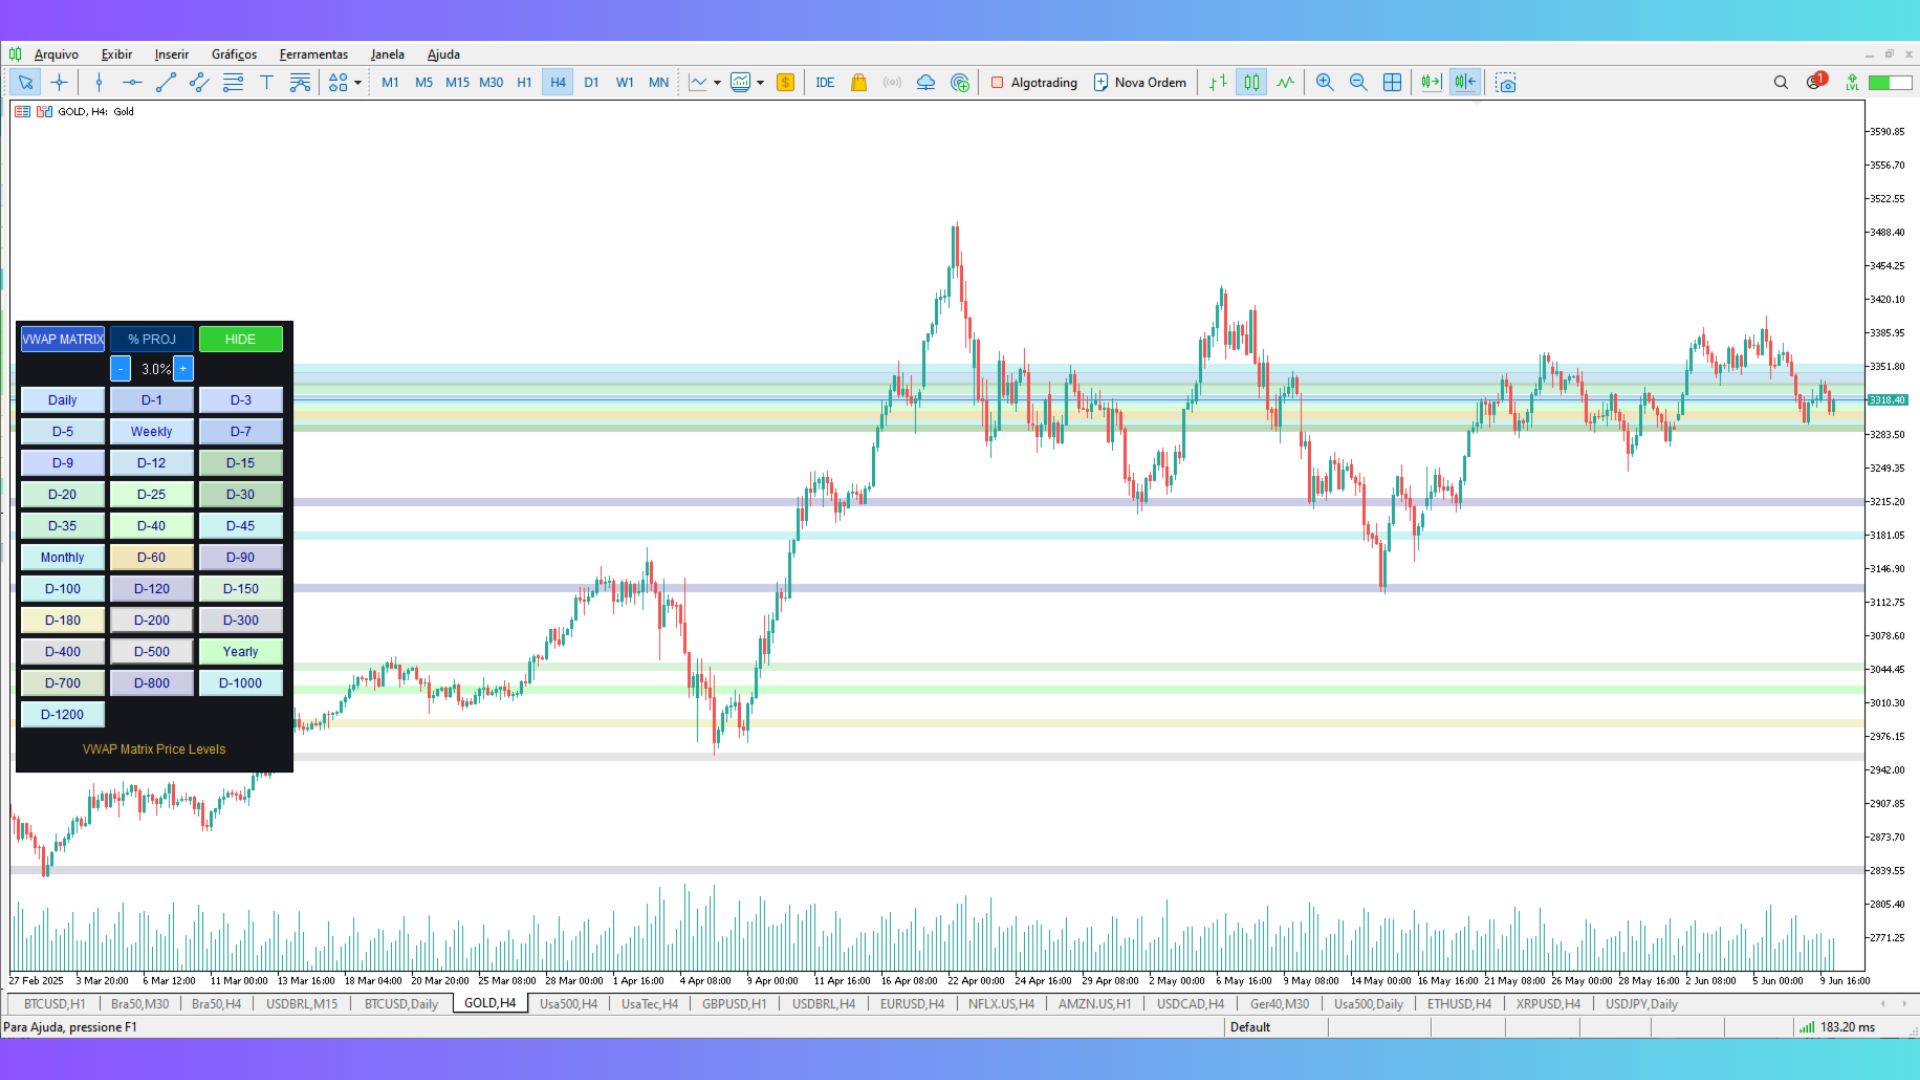
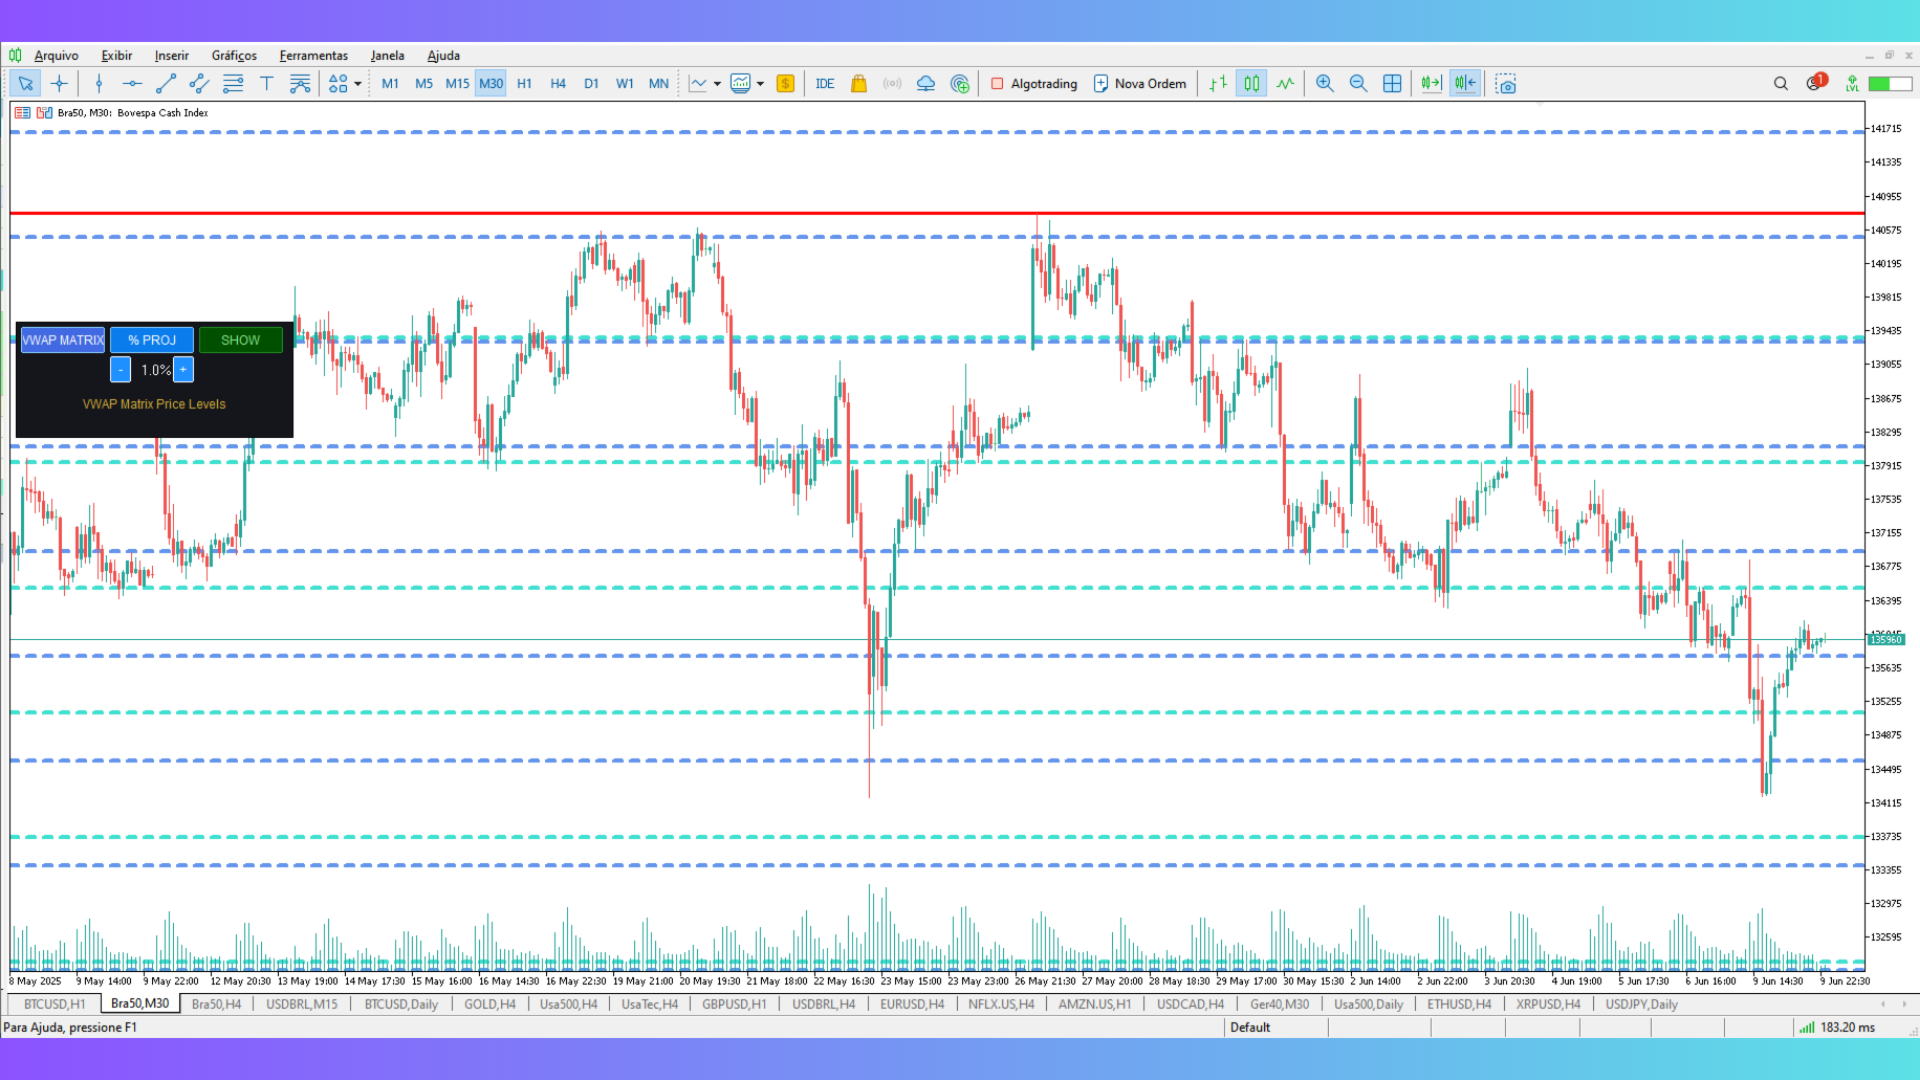
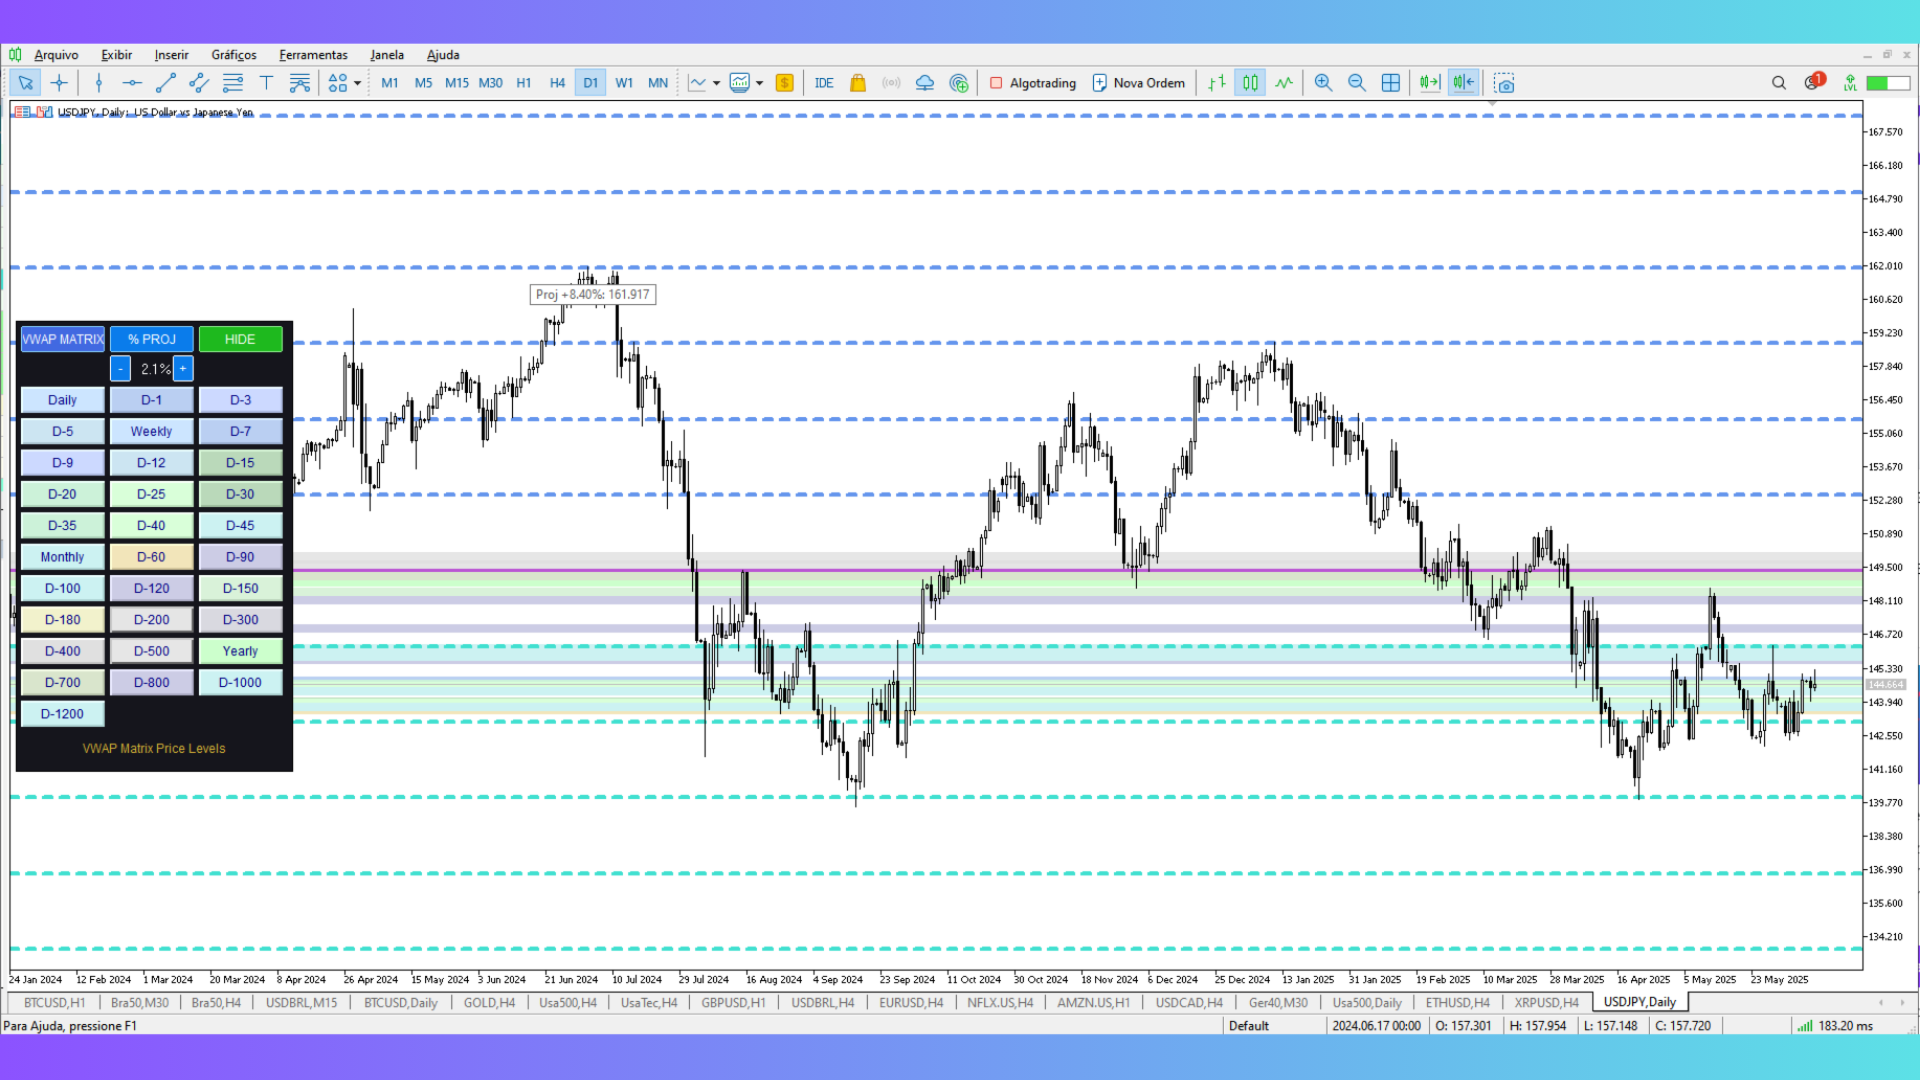
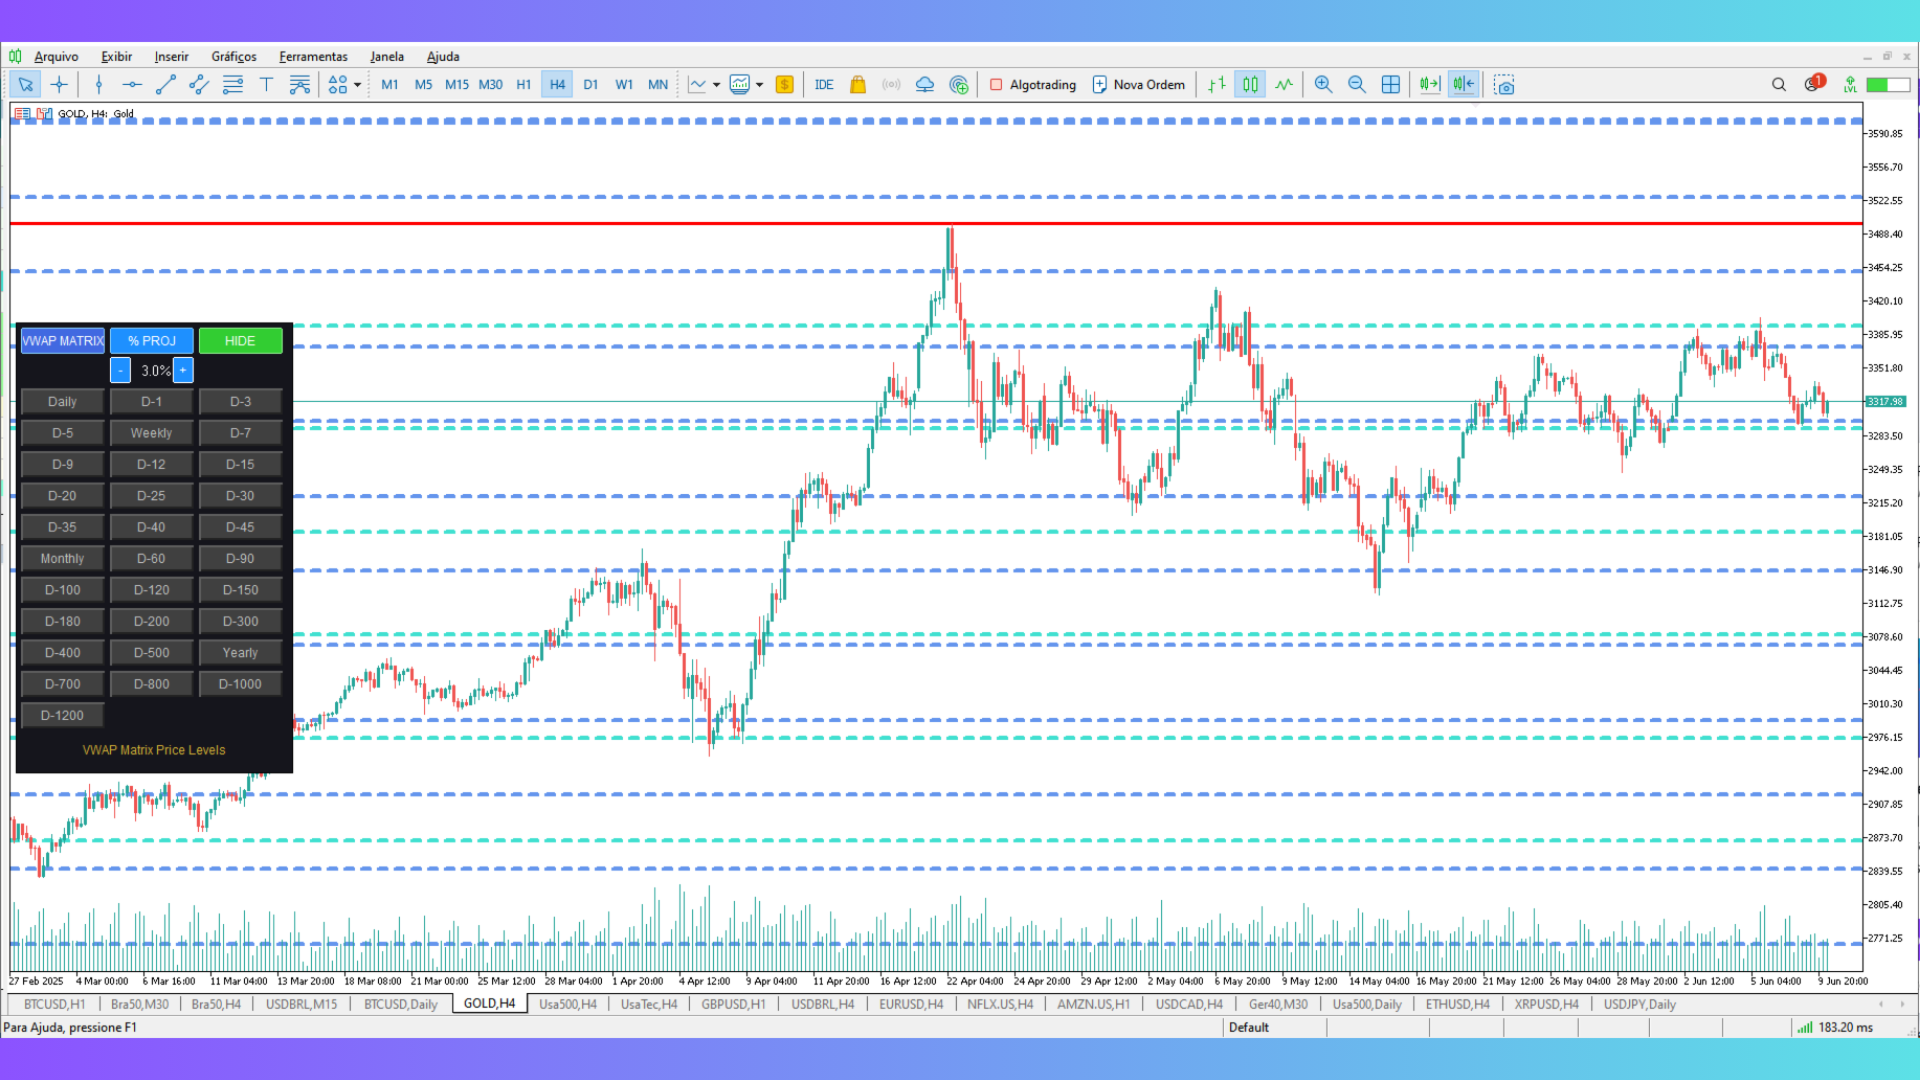
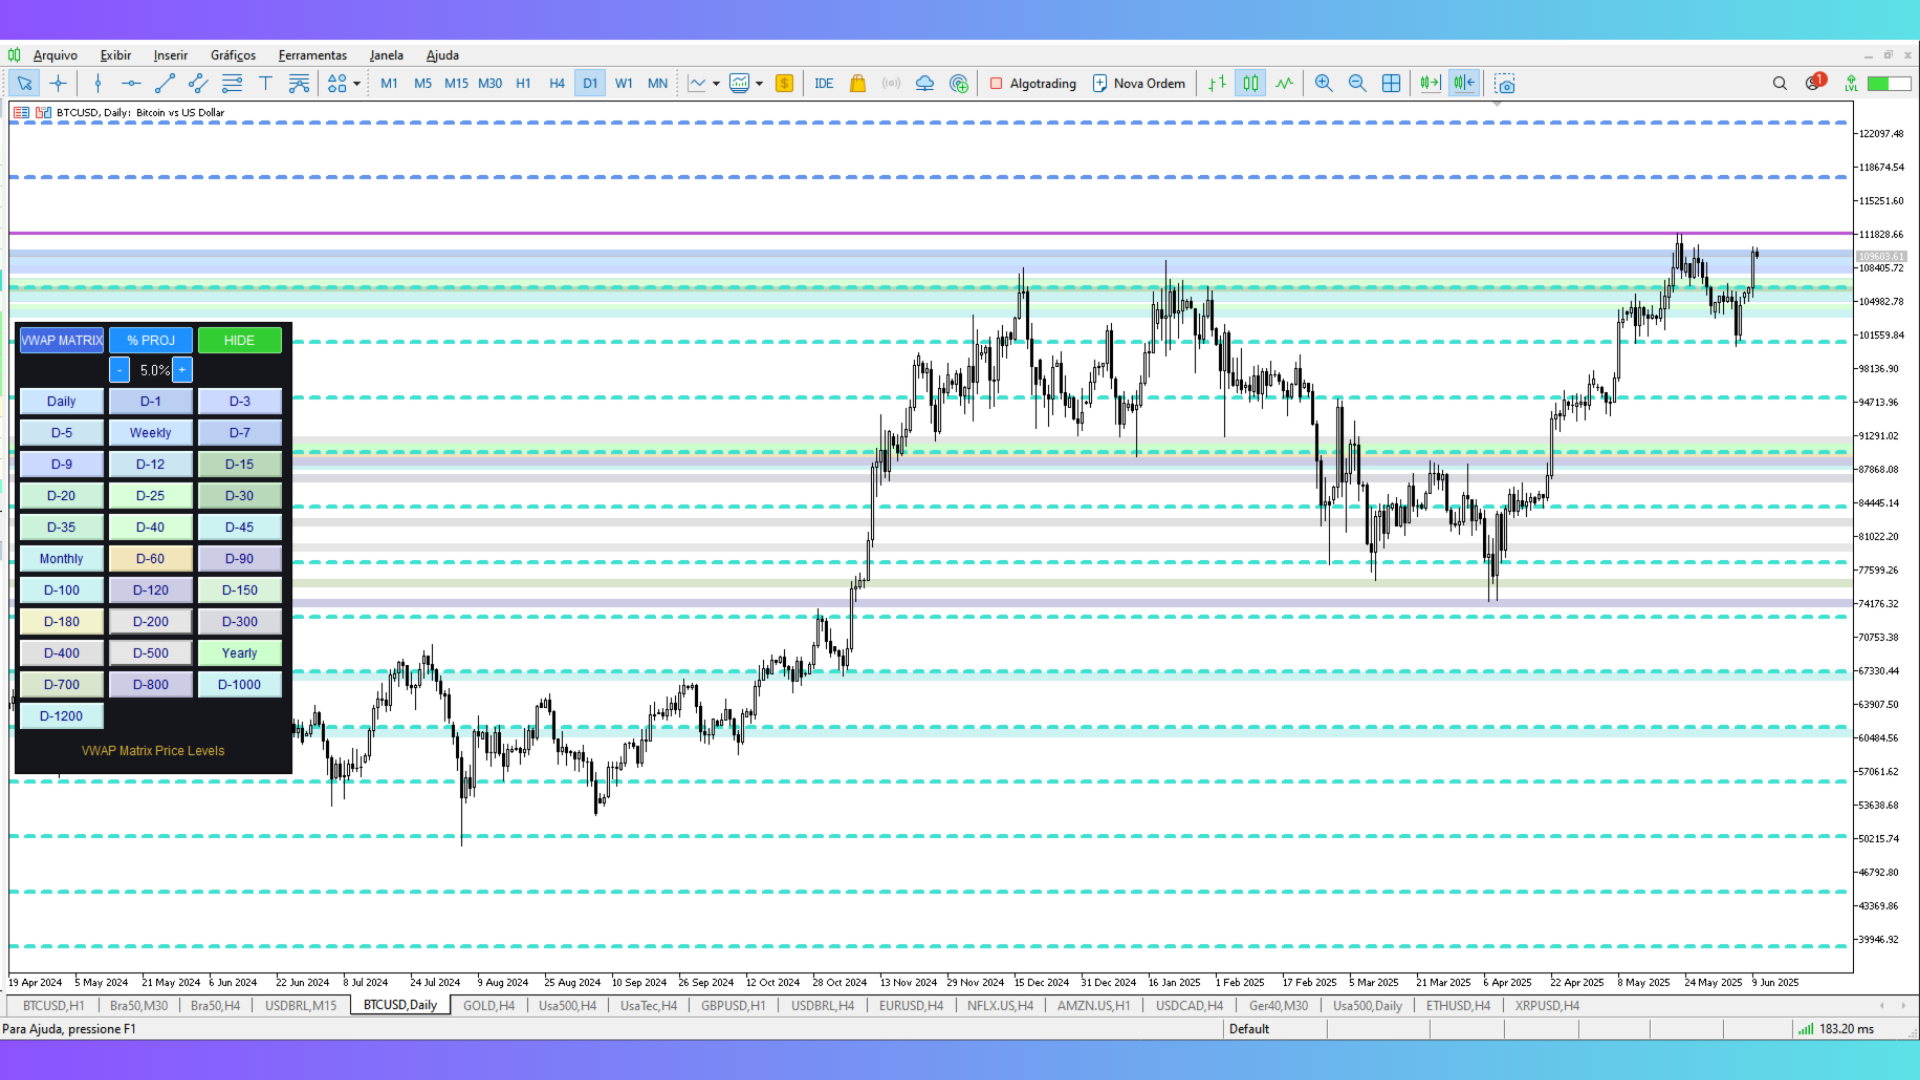
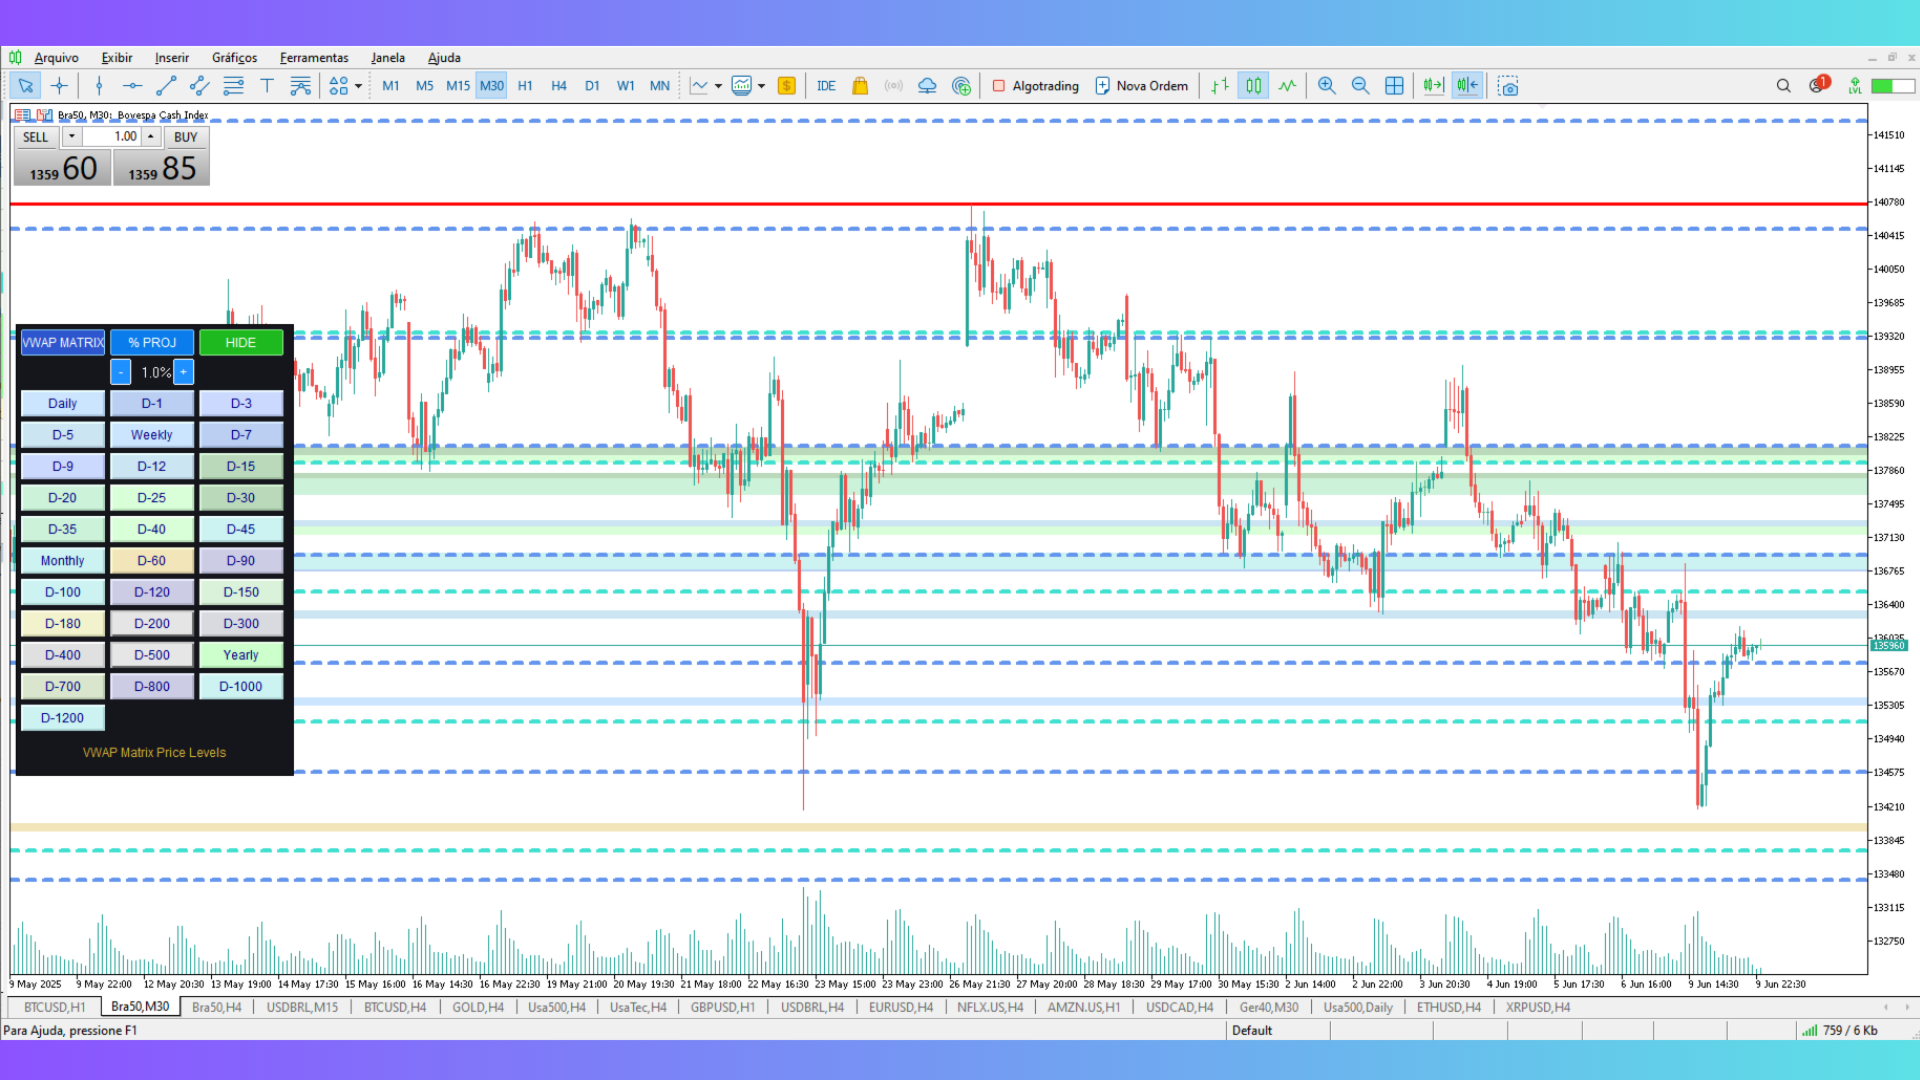
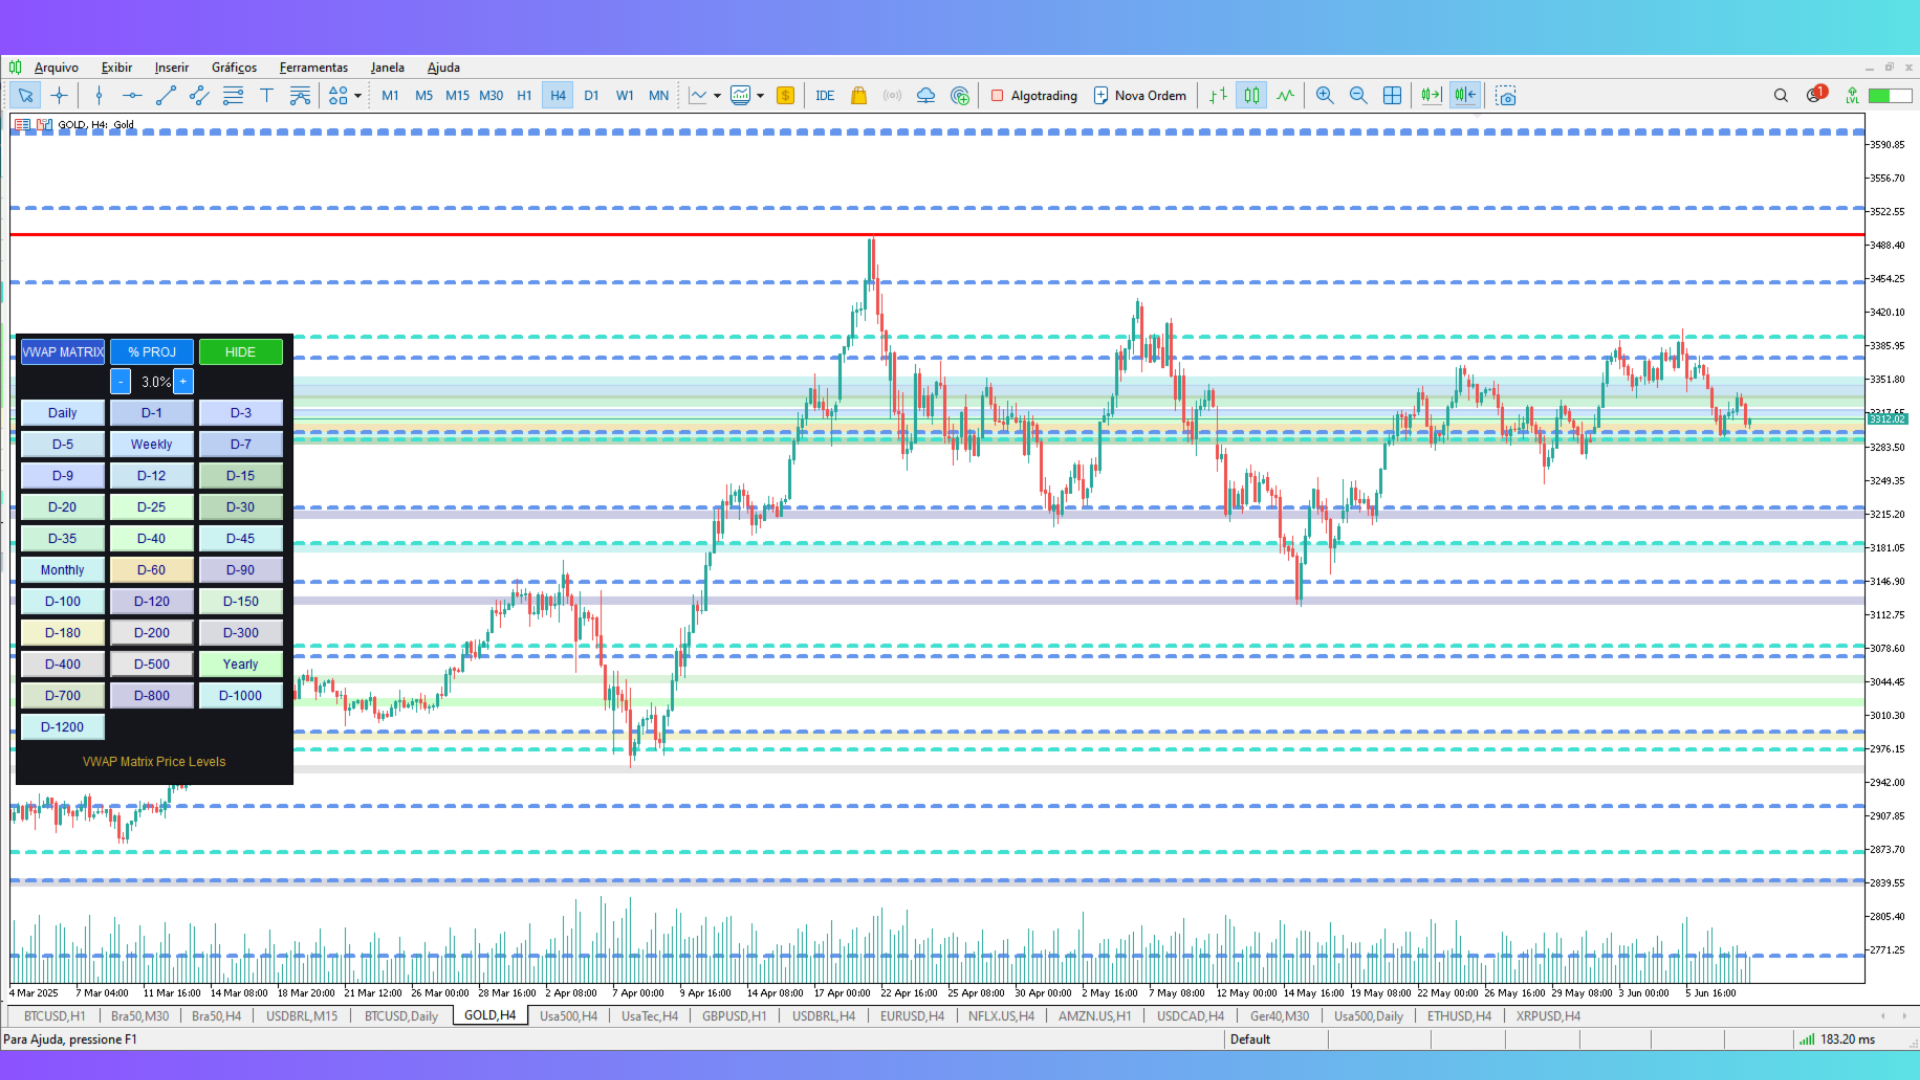
  • Complete VWAP Matrix: Simultaneously visualize multiple VWAP periods (Daily, Weekly, Monthly, Yearly, and a historical lookback of up to 1200 days). Identify macro and micro trends and see where the current price stands in relation to the "fair value" used by major players.

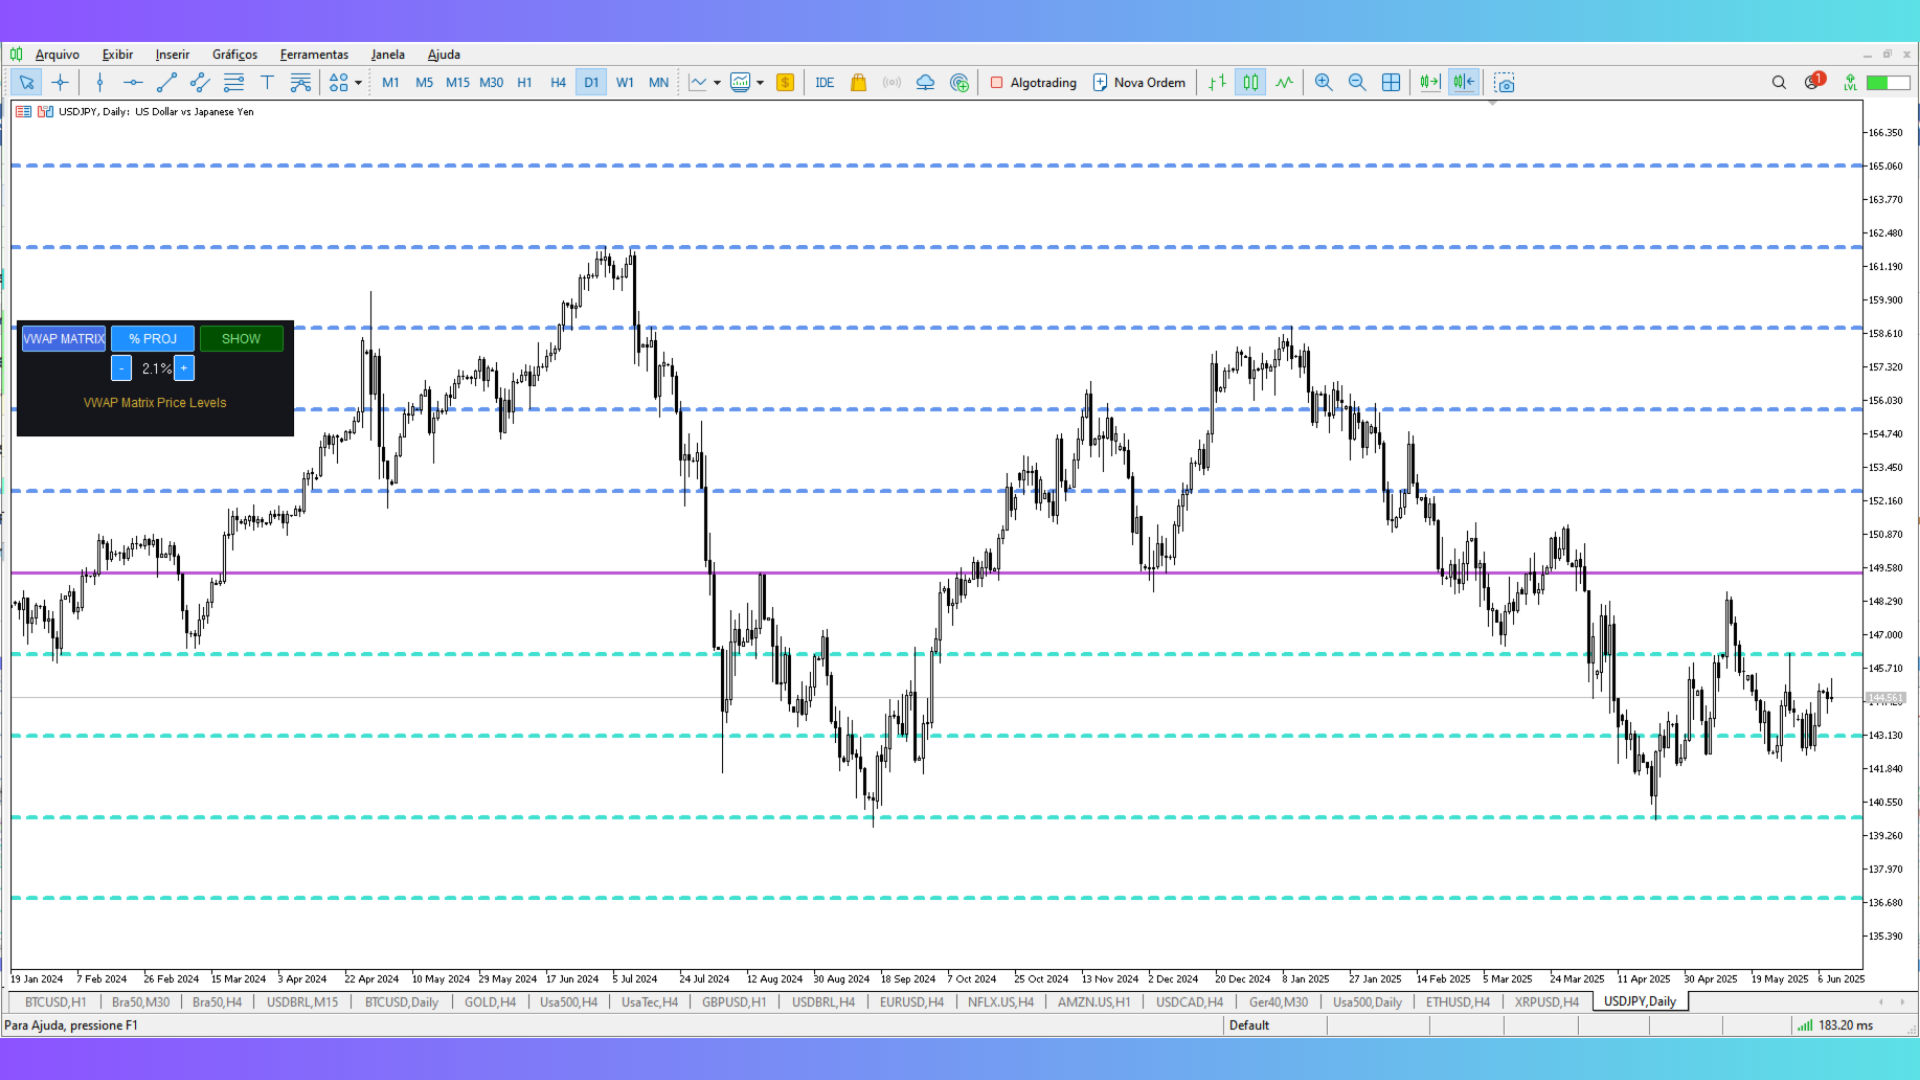
  • Dynamic and Percentage-Based Price Levels: Project support and resistance levels based on customizable percentage projections. Calculate from the high, low, close, or a manual reference price, completely independent of the VWAPs. Ideal for mapping an asset's frequency and volatility.

  • Visual Confluence System: With fully customizable colors and styles, instantly identify high-probability zones where VWAP levels and price projections intersect.

⚙️ Exclusive Features for the Professional Trader

  • 100% Interactive Interface: Adjust percentage levels directly on your MetaTrader 5 chart with intuitive visual controls.

  • Full Customization: Configure colors, styles, line thickness, and positioning to create a clean layout adapted to your trading system.

  • Flexible Calculation References: Choose the starting point for your projections (high, low, close, or a manual value) to adapt the indicator to any asset and strategy.

  • Multi-Asset Compatibility: Perfect for analyzing Forex, Stocks, Futures Contracts (e.g., E-mini S&P 500, Crude Oil), and other markets available on MT5.

💹 Competitive Advantages to Maximize Your Results

  • Map the Market Frequency: Understand the asset's typical percentage movement patterns to anticipate expansions and pullbacks with mathematical backing.

  • Clarity in Decision-Making: Eliminate subjectivity. Trade based on support and resistance zones validated by real volume (VWAP) and statistics (percentage levels).

  • Superior Risk Management: Define entry points, stop losses, and take profits with surgical precision, using levels the market respects.

  • Holistic and Integrated View: Combine the power of institutional volume with percentage-based volatility analysis for a complete understanding of the market context.

🎯 Ideal For:

  • Day Traders and Scalpers who need precise intraday price references.

  • Swing Traders looking for entry and exit points on daily and weekly charts.

  • Institutional and Volume Analysis Traders who use VWAP as a cornerstone of their strategies.

  • Systematic Technical Traders who want a robust tool to optimize their methods.

📊 Practical Applications in Your Daily Trading:

  • Identify Value Zones: Find the best buy and sell points at the confluence of VWAPs and price levels.

  • Set Profit Targets (Take Profit): Establish realistic and mathematically projected goals.

  • Anticipate Reversal Points: Recognize momentum exhaustion when the price reaches extreme percentage levels far from the VWAPs.

  • Confirm Trends: Validate the strength of a move when the price breaks and holds above or below multiple VWAP periods.

Transform Your Technical Analysis. Download the VWAP Matrix Price Levels Pro Now and Trade with the Precision the Market Demands!


추천 제품
White Weis Volume Ticks
Ricardo Almeida Branco
5 (4)
White Weis Volume This indicator shows the sum of the volume in each wave, bulish or bearish, as idealized by David Weis , but it brings an important addition , which is the marking of the bar with the highest volume of the wave (White Bar)! In coding the indicator, it was sought to optimize the code to require minimal processing during use and not to overload mt5. The indicator can be used for pre-trading analysis and study, where the trader analyzes possible points of support and resistance
Midas VWAP
Paulo Henrique Faquineli Garcia
4 (2)
Volume Weighted Average Price (VWAP) is a trading benchmark commonly used by Big Players that gives the average price a Symbol has traded throughout the day. It is based on both Volume and price. This indicator contains Daily VWAP and MIDAS' VWAP, which means you are able to anchor the beggining of MIDAS' calculations and, therefore you will be able to use this methodology to study price versus volume moves after anchor point. You will be able to anchor up to 3 HIGH MIDAS VWAP's and 3 LOW. Wish
FREE
VWAP Indicator
LUC JACOBUS A VERHEECKE
4.2 (25)
Volume Weighted Average Price (VWAP) The volume weighted average price (VWAP) is a  trading   benchmark  used by traders that gives the average price a security has traded at throughout the day, based on both volume and price. It is important because it provides traders with insight into both the trend and value of a security. This indicator VWAP V2 is free and is the manual version of the extended Easy VWAP indicator (30 Euro), where the date and time properties are automatically entered. With
FREE
Stackable VWAP
Flavio Javier Jarabeck
3.5 (4)
Volume Weighted Average Price (VWAP) is a trading benchmark commonly used by Big Players that gives the average price a Symbol has traded throughout the day. It is based on both Volume and price. Additionally we put in this indicator the MVWAP (Moving Volume Weighted Average Price). For those who do not know the usage and the importance od this indicator I recommend a great article about this subject at Investopedia ( https://www.investopedia.com/articles/trading/11/trading-with-vwap-mvwap.asp
FREE
VWAP and MVWAP
Flavio Javier Jarabeck
4.29 (7)
Volume Weighted Average Price (VWAP) is a trading benchmark commonly used by Big Players that gives the average price a Symbol has traded throughout the day. It is based on both Volume and price. Additionally we put in this indicator the MVWAP (Moving Volume Weighted Average Price). For those who do not know the usage and the importance od this indicator I recommend a great article about this subject at Investopedia ( https://www.investopedia.com/articles/trading/11/trading-with-vwap-mvwap.asp )
FREE
Weis Waves
Flavio Javier Jarabeck
2.83 (18)
The original author is David Weis, an expert in the Wyckoff Method. The Weis Wave is a modern adaptation of the 1930's Wyckoff Method, another expert in Tape Reading techniques and Chart Analysis. Weis Waves takes market volume and stacks it into waves according to price conditions giving the trader valuable insights about the market conditions. If you want to learn more about this subject you can find tons of videos in YouTube. Just look for "The Wickoff Method", "Weis Wave" and "Volume Spread
FREE
MIDAS Super VWAP
Flavio Javier Jarabeck
4.4 (10)
Imagine VWAP, MVWAP and MIDAS in one place... Well, you found it! Now you can track the movement of Big Players in various ways, as they in general pursue the benchmarks related to this measuring, gauging if they had good execution or poor execution on their orders. Traders and analysts use the VWAP to eliminate the noise that occurs throughout the day, so they can measure what prices buyers and sellers are really trading. VWAP gives traders insight into how a stock trades for that day and deter
FREE
Reversal Oscillator — Advanced Momentum Shift Detector Reversal Oscillator is a free indicator designed to highlight price zones that are statistically outside their normal movement patterns, helping traders anticipate potential turning points before they occur. Unlike traditional oscillators that react mainly to overbought/oversold conditions, this indicator applies third derivative analysis (the "acceleration of the acceleration" of price) calculated using two independent methods within a n
FREE
Wave Box Market Frenquency
Jean Jacques Huve Ribeiro
4.75 (4)
Totally linked to the result of a movement and the duration he had. Its height records how many ticks the asset walked during a given movement, its width shows us the duration that movement had. Its configuration must be in line with the Weis Wave Indicator configuration to observe the movement force and can indicate a possible accumulation or distribution of the movement;
FREE
Value Chart Candlesticks
Flavio Javier Jarabeck
4.69 (13)
The idea of a Value Chart indicator was presented in the very good book I read back in 2020 , " Dynamic Trading Indicators: Winning with Value Charts and Price Action Profile ", from the authors Mark Helweg and David Stendahl. The idea is simple and the result is pure genius: Present candlestick Price analysis in a detrended way! HOW TO READ THIS INDICATOR Look for Overbought and Oversold levels. Of course, you will need to test the settings a lot to find the "correct" one for your approach. It
FREE
Weis Waves(와이스 웨이브) 는 데이비드 와이스(David Weis)가 개발하고 리차드 와이코프(Richard Wyckoff)의 원리에 기반한 기술적 지표입니다. 전통적인 거래량이 캔들마다 표시되는 것과 달리, Weis Waves는 거래량을 상승 또는 하락 “파동”으로 누적하며, 가격 방향이 바뀔 때마다 계산을 새로 시작합니다. 이 방법은 트레이더가 시장 움직임의 실제 힘 을 명확하게 파악할 수 있게 해줍니다. 각 파동은 일련의 캔들을 지탱하는 거래량의 강도를 보여줍니다. 주요 특징: 거래량을 매수 및 매도 파동으로 그룹화. 지배적인 압력(매수세 또는 매도세)을 강조. 추세 지속 또는 잠재적 반전 을 식별하는 데 도움. 와이코프 방법론에 기반하며, 거래량 및 흐름 분석에 널리 사용됨. Weis Waves는 가격과 거래량의 균형을 평가하기 위해 많은 전문 트레이더들이 활용하며, 시장 역학에 대한 더 깊은 통찰을 제공합니다.
FREE
VisualVol EURUSD
Maxim Kuznetsov
The indicator highlights the points that a professional trader sees in ordinary indicators. VisualVol visually displays different volatility indicators on a single scale and a common align. Highlights the excess of volume indicators in color. At the same time, Tick and Real Volume, Actual range, ATR, candle size and return (open-close difference) can be displayed. Thanks to VisualVol, you will see the market periods and the right time for different trading operations. This version is intended f
FREE
VWAP Simple
Deibson Carvalho
4.24 (29)
The Volume Weighted Average Price is similar to a moving average, except volume is included to weight the average price over a period.    Volume-Weighted Average Price [VWAP] is a dynamic, weighted average designed to more accurately reflect  a security’s true average price over a given period . Mathematically, VWAP is the summation of money (i.e., Volume x Price) transacted divided by the total volume over any time horizon, typically from market open to market close. VWAP reflects the capitali
FREE
ADX consolidado
OTAVIO AGUIAR CAMPOS Aguiar
5 (3)
Mostra a média móvel quando ADX > 20 e pinta de verde ou vermelho quando os valores de ADX estão subindo indicando tendência. Quando o ADX é menor que 20 indica movimento lateral consolidado. O indicador não define pontos de entrada, somente mostra a média colorida quando a tendência está se fortalecendo. Faz parte do grupo de indicadores do Indicador Tavim.
FREE
Range Explosion 소개 Range Explosion은 시장 범위를 감지하고, 정확한 지지선과 저항선을 그리며, 돌파 기회를 정확하게 식별하는 강력하고 무료인 트레이딩 도구입니다. Break Out Explosion 프로젝트의 일부로서, 초보자와 전문가 모두에게 신뢰할 수 있는 고급 시각적 솔루션을 제공합니다. 추세선 돌파 개념에 관심이 있다면, 주요 추세 방향의 돌파를 감지하는 고급 도구를 확인해 보세요: https://www.mql5.com/en/market/product/152676 이 지표의 화살표를 기반으로 거래하는 EA를 원하시나요? 아래 링크를 통해 $30 에 직접 작업을 생성하시면 제가 만들어드리겠습니다: https://www.mql5.com/en/job/new?prefered=eeecad Break Out Explosion 프로젝트 의 최신 소식과 업데이트를 받으려면 이 채널을 구독하세요: https://www.mql5.com/en/channels/brea
FREE
Waves Sizer
Flavio Javier Jarabeck
3.86 (7)
Wyckoff fans, enjoy! Ideally to be used with the Weis Waves indicator, but it can be easily used alone, the Waves Sizer puts the range (in resulting Price movement) done by the Price on its market swings. You can control how accurate or loose will be the swings. This tool is very helpful for visually know how much the Price has traveled in your Timeframe. This way you can confront this level of effort with the resulting Volume, etc... Weis Waves indicator: https://www.mql5.com/en/market/produc
FREE
Weis Wave Double Side
Eduardo Da Costa Custodio Santos
The Weis Wave Bouble Side Indicator for MT5 is part of the toolkit (Wyckoff Academy Wave Market) The Weis Wave Bouble side Indicator for MT5 was created based on the already established Weis Wave created by David Weis. The Weis Wave Double Side indicator reads the market in waves as it was done by R. Wyckoff in 1900. It helps in the identification of effort x result, cause and effect, and Supply and demand Its differential is that it can be used below the zero axis, further improving plus operat
Aggression Volume
Flavio Javier Jarabeck
4.29 (17)
Aggression Volume Indicator is the kind of indicator that is rarely found in the MQL5 community because it is not based on the standard Volume data provided by the Metatrader 5 platform. It requires the scrutiny of all traffic Ticks requested on the platform... That said, Aggression Volume indicator requests all Tick Data from your Broker and processes it to build a very special version of a Volume Indicator, where Buyers and Sellers aggressions are plotted in a form of Histogram. Additionally,
FREE
DS RVOL: The Relative Volume Indicator for MT5 RVOL is a straightforward Relative Volume (RVOL) indicator for MetaTrader 5. It shows you how current volume compares to a historical average, providing a quick way to gauge the strength of a price move. How it Works Relative Volume is a simple ratio: R V O L = C u rre n t V o l u m e ​/ A v er a g e H i s t or i c a l V o l u m e RVOL > 1.0 : Volume is higher than usual. This suggests there's strong interest and potential for a sustained move. RVOL
FREE
Donchian Pro
Paulo Henrique Faquineli Garcia
5 (3)
The Donchian Channel Channels are among the most popular tools of technical analysis, as they visually convey to the analyst the limits within which most price movement tends to occur. Channel users know that valuable information can be obtained at any time, whether prices are in the central region of a band or close to one of the border lines. One of the best known techniques to explore these concepts is Bollinger Bands. However, John Bollinger was not the only one to research the application
FREE
Aggression Wave RSJ
JETINVEST
4.83 (6)
This indicator sums up the difference between the sells aggression and the buys aggression that occurred in each Candle, graphically plotting the waves of accumulation of the aggression volumes.   Through these waves an exponential average is calculated that indicates the direction of the business flow. Note: This indicator DOES NOT WORK for Brokers and/or Markets WITHOUT the type of aggression (BUY or SELL).   Be sure to try our Professional version with configurable features and alerts:  Agre
FREE
LT Weis Waves
Thiago Duarte
5 (11)
The Weis Wave first takes the market volume and then organizes it with the price into Wave charts. It is the only software that will present the true picture of the market before you. If anyone of you, has watched an intraday price movement then you must know that it unfolds in a series of selling as well as buying waves-a procedures tearing down and building up. Wave analysis is an integral part of the trading method. The indicator helps to deal with today’s volatile market. Moreover, it works
FREE
Necessary for traders: tools and indicators Waves automatically calculate indicators, channel trend trading Perfect trend-wave automatic calculation channel calculation , MT4 Perfect trend-wave automatic calculation channel calculation , MT5 Local Trading copying Easy And Fast Copy , MT4 Easy And Fast Copy , MT5 Local Trading copying For DEMO Easy And Fast Copy , MT4 DEMO Easy And Fast Copy , MT5 DEMO The homeopathic indicator is also called the CCI indicator. The CCI indicator was proposed
FREE
Midas is the acronym for Market Interpretation / Data Analysis System is a trade approach started in 1995 by technical analyst Paul Levine and later developed by Andrew Coles, PhD and David Hawkins. Learn more in the book MIDAS Technical Analysis: A VWAP Approach to Trading and Investing in Today's Markets , (I saw that it is possible buy via Amazon). The positive points in relation to the Midas-based indicators are the prediction of movement reversal points, the negative point is the subjectivi
VWAP Personnal Custom
Vincent Jose Proenca
VWAP_PC_MQL5 — a simple home-built VWAP indicator showing real-time volume-weighted price levels directly on your MT5 chart. TF: Works on all timeframes. Pair: Compatible with all symbols — Forex, indices, commodities, and stocks. Settings: Applied Price – price type used for VWAP calculation (Close, Typical, Weighted, etc.) Line Color / Width / Style – customize VWAP line appearance Session Reset – optional reset per day or continuous mode How it works (VWAP principle): VWAP (Volume Weighted
FREE
Weis Wave Double Side Alert
Eduardo Da Costa Custodio Santos
The Weis Wave Bouble Side Indicator for MT5 is part of the toolkit (Wyckoff Academy Wave Market) The Weis Wave Bouble side Indicator for MT5 was created based on the already established Weis Wave created by David Weis. The Weis Wave Double Side indicator reads the market in waves as R. Wyckoff did in 1900. It helps in the identification of effort x result, cause and effect, and Supply and demand Its differential is that it can be used below the zero axis and has a breakout alert showing Who is s
Easy VWAP
Luca Spinello
VWAP Indicator, the short form of Volume Weighted Average Price, is similar to a moving average but takes into consideration the tick volume of the candles. The indicator calculates the moving average multiplying the price of each candle for the tick volume in the candle. Said calculation weighs with more significance price where more transactions were made. Features: Visual styling customizable Period customizable Ease of use
FREE
Simple Weis Wave
Jean Jacques Huve Ribeiro
3.67 (3)
One of the best tools for analyzing volume, Weis Wave was idelized by David Weis, to facilitate the reading of directional flow. For the VSA method disciples it is an evolution of the practices created by Richard Wycoff, facilitating a predictive reading of the market, always seeking an accumulation and distribution of the negotiated contracts. Cumulative wave volume  Range of wave ( removed) Average Wave volume Ref "Tim Ord lectures" ( removed)
FREE
(Special New Year promotion - free price!) The indicator displays the actual 'Scale in points per bar' (identical to the manual setting in the Terminal, see screenshot) in the upper right corner of the chart. The displayed value changes INSTANTLY whenever the chart scale is changed! (This is very convenient when planning screenshots). In Settings: Change language (Russian/English), font size of the displayed text, text label offset coefficient from the graph corner, equally in X and Y directi
FREE
Cybertrade Keltner Channels
Emanuel Andriato
4.75 (4)
Cybertrade Keltner Channels - MT5 Created by Chester Keltner, this is a volatility indicator used by technical analysis. It is possible to follow the trend of financial asset prices and generate support and resistance patterns. In addition, envelopes are a way of tracking volatility in order to identify opportunities to buy and sell these assets. It works on periods longer than the period visible on the chart. All values ​​are available in the form of buffers to simplify possible automations.
FREE
이 제품의 구매자들이 또한 구매함
이 지표를 구매하면 제 프로페셔널 트레이드 매니저를 무료로 드립니다. 우선 이 거래 시스템이 리페인팅, 리드로잉 및 레이그 인디케이터가 아니라는 점을 강조하는 것이 중요합니다. 이는 수동 및 로봇 거래 모두에 이상적인 것으로 만듭니다. 온라인 강좌, 설명서 및 프리셋 다운로드. "스마트 트렌드 트레이딩 시스템 MT5"은 새로운 및 경험이 풍부한 트레이더를 위해 맞춤형으로 제작된 종합적인 거래 솔루션입니다. 10개 이상의 프리미엄 인디케이터를 결합하고 7개 이상의 견고한 거래 전략을 특징으로 하여 다양한 시장 조건에 대한 다목적 선택이 가능합니다. 트렌드 추종 전략: 효과적인 트렌드 추이를 타기 위한 정확한 진입 및 손절 관리를 제공합니다. 반전 전략: 잠재적인 트렌드 반전을 식별하여 트레이더가 범위 시장을 활용할 수 있게 합니다. 스캘핑 전략: 빠르고 정확한 데이 트레이딩 및 단기 거래를 위해 설계되었습니다. 안정성: 모든 인디케이터가 리페인팅, 리드로잉 및 레이그가 아니므로 신뢰
Divergence Bomber
Ihor Otkydach
4.99 (77)
이 지표를 구매하신 분께는 다음과 같은 혜택이 무료로 제공됩니다: 각 거래를 자동으로 관리하고, 손절/익절 수준을 설정하며, 전략 규칙에 따라 거래를 종료하는 전용 도우미 툴 "Bomber Utility" 다양한 자산에 맞게 지표를 설정할 수 있는 셋업 파일(Set Files) "최소 위험", "균형 잡힌 위험", "관망 전략" 모드로 설정 가능한 Bomber Utility의 셋업 파일 이 전략을 빠르게 설치, 설정, 시작할 수 있도록 돕는 단계별 영상 매뉴얼 주의: 위의 모든 보너스를 받기 위해서는 MQL5 개인 메시지 시스템을 통해 판매자에게 연락해 주세요. 독창적인 커스텀 지표인 “Divergence Bomber(다이버전스 봄버)”를 소개합니다. 이 지표는 MACD 다이버전스(괴리) 전략을 기반으로 한 올인원(All-in-One) 거래 시스템입니다. 이 기술 지표의 주요 목적은 가격과 MACD 지표 간의 다이버전스를 감지하고, **향후 가격이 어느 방향으로 움직일지를 알려주는
Gold Sniper Scalper Pro
Ich Khiem Nguyen
5 (4)
Gold Sniper Scalper Pro - MetaTrader 5 용 골드 (XAU/USD) 트레이딩 시스템 진지한 트레이더를 위한: 여러 시장 분석 요소를 결합한 구조화되고 데이터 중심적인 방법론으로 골드 거래에 접근하세요. 이 도구는 귀하의 골드 거래 분석을 지원하도록 제작되었습니다. 한정 가격 기회 이것은 가격이 오르기 전에 Gold Sniper Scalper Pro를 소유할 기회입니다. 제품 가격은 이후 10회 구매마다 $50씩 인상됩니다. 최종 가격: $498 분석적 우위를 정의하는 기능 Gold Sniper Scalper Pro는 깊은 통찰력과 명확한 통계적 이점을 제공하도록 설계된 포괄적인 도구 키트입니다: 시스템, 입력 사용자 지정 및 지표 사용 시 주의사항을 포함한 상세 지표 사용 가이드는 아래 MQL 게시물에 제시되어 있습니다. 해당 문서를 참조하십시오. Gold Sniper Scalper Pro - Gold (XAU/USD) Trading System on
Entry In The Zone and SMC Multi Timeframe 은 Smart Money Concepts(SMC)를 기반으로 개발된 실시간 시장 분석 도구입니다. 이 시스템은 트레이더가 시장 구조를 체계적으로 분석하고 전체적인 시장 방향을 더욱 명확하게 파악할 수 있도록 설계되었습니다. 시스템은 여러 시간대에서 반전 포인트(Reversal Points), 핵심 구역(Key Zones), 그리고 시장 구조(Market Structure)를 자동으로 분석하며, POI(Point of Interest), 노 리페인트(No Repaint) 신호, 자동 피보나치 레벨(Auto Fibonacci Levels)을 표시하여 되돌림(Pullback)과 반전 포인트를 정확하게 탐지할 수 있도록 돕습니다. 또한 실시간 신호와 알림을 통해 가격이 핵심 구역에 진입하거나 해당 구역에서 반전 신호가 발생하는 순간을 놓치지 않도록 보조합니다. 더불어 이 시스템은 인디케이터와 신호 시스템을 하나로
ARIPoint
Temirlan Kdyrkhan
1 (1)
ARIPoint is a powerful trading companion designed to generate high-probability entry signals with dynamic TP/SL/DP levels based on volatility. Built-in performance tracking shows win/loss stats, PP1/PP2 hits, and success rates all updated live. Key Features: Buy/Sell signals with adaptive volatility bands Real-time TP/SL/DP levels based on ATR Built-in MA Filter with optional ATR/StdDev volatility Performance stats panel (Success, Profit/Loss, PP1/PP2) Alerts via popup, sound, push, or email Cu
Atomic Analyst MT5
Issam Kassas
4.31 (26)
우선적으로 언급할 점은이 거래 지표가 다시 그리지 않고 지연되지 않으며 이를 통해 수동 및 로봇 거래 모두에 이상적이라는 점입니다. 사용자 매뉴얼: 설정, 입력 및 전략. Atomic Analyst는 가격의 강도와 모멘텀을 활용하여 시장에서 더 나은 이점을 찾는 PA Price Action Indicator입니다. 고급 필터를 장착하여 잡음과 거짓 신호를 제거하고 거래 잠재력을 높이는 데 도움이 됩니다. 복잡한 지표의 다중 레이어를 사용하여 Atomic Analyst는 차트를 스캔하고 복잡한 수학적 계산을 간단한 신호와 색상으로 변환하여 초보 트레이더가 이해하고 일관된 거래 결정을 내릴 수 있도록합니다. "Atomic Analyst"는 새로운 및 경험이 풍부한 트레이더를위한 종합적인 거래 솔루션입니다. 프리미엄 지표와 최고 수준의 기능을 하나의 거래 전략에 결합하여 모든 종류의 트레이더에 대한 다재다능한 선택지가되었습니다. 인트라데이 거래 및 스캘핑 전략 : 빠르고 정확한 일일
FX Power MT5 NG
Daniel Stein
5 (28)
FX Power: 통화 강세 분석으로 더 스마트한 거래 결정을 개요 FX Power 는 어떤 시장 상황에서도 주요 통화와 금의 실제 강세를 이해하기 위한 필수 도구입니다. 강한 통화를 매수하고 약한 통화를 매도함으로써 FX Power 는 거래 결정을 단순화하고 높은 확률의 기회를 발견합니다. 트렌드를 따르거나 극단적인 델타 값을 사용해 반전을 예측하고자 한다면, 이 도구는 귀하의 거래 스타일에 완벽히 적응합니다. 단순히 거래하지 말고, FX Power 로 더 스마트하게 거래하세요. 1. FX Power가 거래자에게 매우 유용한 이유 통화와 금의 실시간 강세 분석 • FX Power 는 주요 통화와 금의 상대적 강세를 계산하고 표시하여 시장 역학에 대한 명확한 통찰력을 제공합니다. • 어떤 자산이 앞서고 있고 어떤 자산이 뒤처지는지 모니터링하여 보다 현명한 거래 결정을 내릴 수 있습니다. 포괄적인 멀티 타임프레임 뷰 • 단기, 중기 및 장기 타임프레임에서 통화와 금의 강세를
Smart Stop Indicator – 차트 위에서 직접 작동하는 지능형 스톱로스 시스템 개요 Smart Stop Indicator는 감이나 추측이 아닌 명확하고 체계적인 방식으로 스톱로스를 설정하고 싶은 트레이더를 위한 맞춤형 솔루션입니다. 이 도구는 클래식 프라이스 액션 논리(고점, 저점 구조)와 현대적인 브레이크아웃 인식을 결합하여 실제로 가장 논리적인 다음 스톱 레벨을 정확히 식별합니다. 추세, 박스권, 빠른 브레이크아웃 상황 등 어떤 시장에서도 인디케이터는 최적의 SL 구역과 상태(“new”, “broken”, “valid”)를 차트에 직접 표시합니다. 새로운 기능으로 SL 거리의 %ADR 표시가 추가되었습니다. 핵심 기능 자동 시장구조 기반 스톱 설정 • 시장 구조와 실시간 가격 움직임을 기반으로 의미 있는 스톱로스 레벨을 자동으로 탐지합니다. 스마트 브레이크아웃 감지 • 빠른 방향 변화나 돌파 상황에서도 불필요한 조기 스톱 조정을 강요하지 않으며 유연하게 반응합
Game Changer Indicator mt5
Vasiliy Strukov
4.6 (5)
Game Changer는 모든 금융 상품에 사용하도록 설계된 혁신적인 추세 지표로, 메타트레이더를 강력한 추세 분석기로 탈바꿈시켜 줍니다. 이 지표는 재작성이나 지연 현상이 발생하지 않습니다. 모든 시간대에서 작동하며 추세 파악을 지원하고, 잠재적 반전 신호를 제공하며, 트레일링 스톱 메커니즘으로 활용되고, 신속한 시장 반응을 위한 실시간 알림을 제공합니다. 숙련된 투자자, 전문가, 또는 우위를 점하려는 초보자 등 누구나 이 도구를 통해 자신감과 원칙을 바탕으로, 그리고 근본적인 추세 역학에 대한 명확한 이해를 바탕으로 거래할 수 있습니다. 구매 후 바로 연락 주시면 개인 보너스를 드립니다! 강력한 지지선과 추세 스캐너 지표를 무료로 받으실 수 있습니다. 개인 메시지로 알려주세요 저는 텔레그램에서 EA나 특별 세트를 판매하지 않습니다. Mql5에서만 사용 가능하며, 세트 파일은 제 블로그에서만 볼 수 있습니다 . 사기꾼을 조심하시고 다른 사람에게서 세트를 구매하지 마세요 설정 추세
Trend Screener Pro MT5
STE S.S.COMPANY
4.84 (99)
트렌드 표시기, 트렌드 트레이딩 및 필터링을 위한 획기적인 고유 솔루션, 하나의 도구 안에 내장된 모든 중요한 트렌드 기능! Forex, 상품, 암호 화폐, 지수 및 주식과 같은 모든 기호/도구에 사용할 수 있는 100% 다시 칠하지 않는 다중 시간 프레임 및 다중 통화 표시기입니다. Trend Screener는 차트에 점이 있는 화살표 추세 신호를 제공하는 효율적인 지표 추세 추종 지표입니다. 추세 분석기 표시기에서 사용할 수 있는 기능: 1. 트렌드 스캐너. 2. 최대 이익 분석이 있는 추세선. 3. 추세 통화 강도 측정기. 4. 경고가 있는 추세 반전 점. 5. 경고가 있는 강력한 추세 점. 6. 추세 화살표 Trend Screener Indicator가 있는 일일 분석 예, 일일 신호 성능...등은 여기에서 찾을 수 있습니다. 여기를 클릭하십시오. LIMITED TIME OFFER : Trend Screener Indicator는 50$ 및 평생 동안만 사용할 수 있습니다.
SynaptixQuant Dominance Matrix
Devie Arevalo Montemayor
5 (1)
SynaptixQuant Dominance Matrix: Institutional-Grade Market State Extraction Engineered for traders who require a data-driven view of market behaviour beyond surface-level indicators. The Synaptix Quant (SQ) Dominance Matrix is not a conventional currency strength display. Behind its intentionally streamlined interface runs a sophisticated analytical architecture designed to quantify market conditions with precision. Every output is generated through layered signal processing built to identify d
Grabber System MT5
Ihor Otkydach
4.79 (19)
탁월한 기술적 지표인 Grabber를 소개합니다. 이 도구는 즉시 사용 가능한 “올인원(All-Inclusive)” 트레이딩 전략으로 작동합니다. 하나의 코드 안에 강력한 시장 기술 분석 도구, 매매 신호(화살표), 알림 기능, 푸시 알림이 통합되어 있습니다. 이 인디케이터를 구매하신 모든 분들께는 다음의 항목이 무료로 제공됩니다: Grabber 유틸리티: 오픈 포지션을 자동으로 관리하는 도구 단계별 영상 매뉴얼: 설치, 설정, 그리고 실제 거래 방법을 안내 맞춤형 세트 파일: 인디케이터를 빠르게 자동 설정하여 최고의 성과를 낼 수 있도록 도와줍니다 다른 전략은 이제 잊어버리세요! Grabber만이 여러분을 새로운 트레이딩의 정점으로 이끌어 줄 수 있습니다. Grabber 전략의 주요 특징: 거래 시간 프레임: M5부터 H4까지 거래 가능한 자산: 어떤 자산이든 사용 가능하지만, 제가 직접 테스트한 종목들을 추천드립니다 (GBPUSD, GBPCAD, GBPCHF, AUDCAD, AU
Quantum TrendPulse
Bogdan Ion Puscasu
5 (19)
SuperTrend   ,   RSI   ,   Stochastic   의 힘을 하나의 포괄적인 지표로 결합하여 트레이딩 잠재력을 극대화하는 궁극의 트레이딩 도구   인 Quantum TrendPulse를   소개합니다. 정밀성과 효율성을 추구하는 트레이더를 위해 설계된 이 지표는 시장 추세, 모멘텀 변화, 최적의 진입 및 종료 지점을 자신 있게 식별하는 데 도움이 됩니다. 주요 특징: SuperTrend 통합:   주요 시장 추세를 쉽게 따라가고 수익성의 물결을 타세요. RSI 정밀도:   매수 과다 및 매도 과다 수준을 감지하여 시장 반전 시점을 파악하는 데 적합하며 SuperTrend 필터로 사용 가능 확률적 정확도:   변동성이 큰 시장에서 숨겨진 기회를 찾기 위해 확률적 진동   을 활용하고 SuperTrend의 필터로 사용 다중 시간대 분석:   M5부터 H1 또는 H4까지 다양한 시간대에 걸쳐 시장을 최신 상태로 유지하세요. 맞춤형 알림:   맞춤형 거래 조건이 충족되면
- Real price is 80$ - 45% Discount (It is 45$ now) Contact me for extra bonus   indicator, instruction or any questions! - Lifetime update free - Non-repaint - Related product: Gann Gold EA - I just sell my products in Elif Kaya Profile, any other websites are stolen old versions, So no any new updates or support. Advantages of  M1 Scalper Pro  Profitability: M1 Scalper Pro is highly profitable with a strict exit strategy. Frequent Opportunities: M1 Scalper Pro  takes advantage of numerous smal
우선적으로, 이 거래 도구는 전문적인 거래에 이상적인 비-다시 그리기 및 지연되지 않는 지표입니다.  온라인 강좌, 사용자 매뉴얼 및 데모. 스마트 가격 액션 컨셉트 인디케이터는 신규 및 경험 많은 트레이더 모두에게 매우 강력한 도구입니다. Inner Circle Trader Analysis 및 Smart Money Concepts Trading Strategies와 같은 고급 거래 아이디어를 결합하여 20가지 이상의 유용한 지표를 하나로 결합합니다. 이 인디케이터는 스마트 머니 컨셉트에 중점을 두어 대형 기관의 거래 방식을 제공하고 이동을 예측하는 데 도움을 줍니다.  특히 유동성 분석에 뛰어나 기관이 어떻게 거래하는지 이해하는 데 도움을 줍니다. 시장 트렌드를 예측하고 가격 변동을 신중하게 분석하는 데 탁월합니다. 귀하의 거래를 기관 전략에 맞추어 시장의 동향에 대해 더 정확한 예측을 할 수 있습니다. 이 인디케이터는 시장 구조를 분석하고 중요한 주문 블록을 식별하고 다양
Trend indicator AI mt5
Ramil Minniakhmetov
5 (12)
트렌드 인공 지능 지표는 실행 가능한 진입 점 및 반전 경고와 추세 식별을 결합하여 상인의 시장 분석을 향상시킬 훌륭한 도구입니다. 이 표시기는 사용자가 자신감과 정밀도로 외환 시장의 복잡성을 탐색 할 수 있도록 지원합니다 기본 신호 외에도 트렌드 인공 지능 지표는 풀백 또는 되돌림 중에 발생하는 2 차 진입 점을 식별하여 거래자가 기존 트렌드 내에서 가격 수정을 활용할 수 있도록합니다. 중요한 장점: ·작동 4 및 5 *명확한 구매 또는 판매 신호 *다시 칠하지 않습니다 *모든 자산에서 작동 나는 전보 사기에 개 또는 세트를 판매하지 않도록주의. 모든 설정은 블로그에 여기에 무료.  중요! 지침 및 보너스를 얻기 위해 구입 후 즉시 저에게 연락! 진짜 가동 감시는 뿐 아니라 나의 다른 제품 여기에서 찾아낼 수 있습니다: https://www.mql5.com/en/users/mechanic/seller&nbsp ; 설정 및 입력: 모든 자산에 대해 기본 설정을 권
FX Volume MT5
Daniel Stein
4.79 (24)
FX Volume: 브로커 시각에서 바라보는 진짜 시장 심리 간단 요약 트레이딩 접근 방식을 한층 더 향상시키고 싶으신가요? FX Volume 는 소매 트레이더와 브로커의 포지션을 실시간으로 파악할 수 있게 해 줍니다. 이는 COT 같은 지연된 보고서보다 훨씬 빠릅니다. 꾸준한 수익을 추구하는 분이든, 시장에서 더 깊은 우위를 원하시는 분이든, FX Volume 을 통해 대규모 불균형을 찾아내고, 돌파 여부를 확인하며 리스크 관리를 정교화할 수 있습니다. 지금 시작해 보세요! 실제 거래량 데이터가 의사결정을 어떻게 혁신할 수 있는지 직접 경험해 보시기 바랍니다. 1. 트레이더에게 FX Volume이 매우 유익한 이유 탁월한 정확도를 지닌 조기 경보 신호 • 다른 사람들보다 훨씬 앞서, 각 통화쌍을 매수·매도하는 트레이더 수를 거의 실시간으로 파악할 수 있습니다. • FX Volume 은 여러 리테일 브로커에서 추출한 실제 거래량 데이터를 종합해 명확하고 편리한 형태로 제공하는
TPSproTREND PrO MT5
Roman Podpora
4.72 (18)
지금 TREND PRO를 구매하시면 또 다른 고급 트렌드 지표를 무료로 받으실 수 있습니다. 받으려면 개인 메시지를 작성하세요. VERSION MT4        —        ИНСТРУКЦИЯ RUS           —        INSTRUCTIONS  ENG 주요 기능: 렌더링 없이 정확한 입력 신호! 신호가 나타나면 관련성은 유지됩니다! 이는 신호를 제공한 후 변경하여 예금 자금 손실을 초래할 수 있는 다시 그리기 지표와의 중요한 차이점입니다. 이제 더 큰 확률과 정확도로 시장에 진입할 수 있습니다. 화살표가 나타난 후 목표에 도달(이익실현)하거나 반전 신호가 나타날 때까지 캔들을 색칠하는 기능도 있습니다. STOP LOSS / TAKE PROFIT 구역 표시 진입점 검색 시 시각적 명확성을 높이기 위해 시장 진입을 위한 최적 지점이 검색되는 BUY/SELL 영역을 초기에 표시하는 모듈을 만들었습니다. 정지 손실 수준 작업을 위한 추가 지능형 논리는 시간이 지남에
Entry Points Pro for MT5
Yury Orlov
4.47 (136)
다시 색을 칠하지 않고 거래에 진입할 수 있는 정확한 신호를 제공하는 MT5용 지표입니다. 외환, 암호화폐, 금속, 주식, 지수 등 모든 금융 자산에 적용할 수 있습니다. 매우 정확한 추정값을 제공하고 매수와 매도의 가장 좋은 시점을 알려줍니다. 하나의 시그널로 수익을 내는 지표의 예와 함께 비디오 (6:22)시청하십시오! 대부분의 거래자는 Entry Points Pro 지표의 도움으로 첫 거래 주 동안 트레이딩 결과를 개선합니다. 저희의   Telegram Group 을 구독하세요! Entry Points Pro 지표의 좋은점. 재도색이 없는 진입 신호 신호가 나타나고 확인되면(시그널 캔들이 완성된 경우) 신호는 더 이상 사라지지 않습니다. 여타 보조지표의 경우 신호를 표시한 다음 제거되기 때문에 큰 재정적 손실로 이어집니다. 오류 없는 거래 게시 알고리즘을 통해 트레이드(진입 또는 청산)를 할 이상적인 순간을 찾을 수 있으며, 이를 통해 이를 사용하는 모든 거래자의 성공률이
RelicusRoad Pro MT5
Relicus LLC
5 (24)
훌륭한 백테스트, 환상적인 숫자로 입증된 실제 계정 성능, 그리고 모든 곳에 퍼져 있는 통계를 자랑하는 트레이딩 지표를 얼마나 자주 구매하셨습니까? 하지만 사용 후에는 결국 계좌를 날려버리셨나요? 신호 자체만으로는 신뢰할 수 없습니다. 신호가 왜 처음 나타났는지 알아야 하며, 그것이 바로 RelicusRoad Pro가 가장 잘하는 일입니다! 사용자 매뉴얼 + 전략 + 교육 비디오 + VIP 액세스 전용 그룹 + 모바일 버전 사용 가능 시장을 보는 새로운 방법 RelicusRoad는 외환, 선물, 암호화폐, 주식 및 지수를 위한 세계에서 가장 강력하고 최고의 트레이딩 지표 로서, 트레이더가 계좌를 성장시키는 데 필요한 모든 정보와 도구를 제공합니다. 우리는 기술 분석 및 트레이딩 계획 을 제공하여 초보자 부터 고급 트레이더 까지 모든 트레이더가 성공할 수 있도록 돕습니다. 이것은 미래 시장을 예측 하는 데 충분한 정보를 제공하는 핵심 트레이딩 지표 입니다. 우리는 차트에서 의미 없
TrendLine PRO MT5
Evgenii Aksenov
4.67 (33)
The Trend Line PRO indicator is an independent trading strategy. It shows the trend change, the entry point to the transaction, as well as automatically calculates three levels of Take Profit and Stop Loss protection. Trend Line PRO is perfect for all Meta Trader symbols: currencies, metals, cryptocurrencies, stocks and indices. The indicator is used in trading on real accounts, which confirms the reliability of the strategy. Robots using   Trend Line PRO   and real Signals can be found here: 
Market Structure Patterns
Samuel Manoel De Souza
4.47 (19)
Available for   MT4   and   MT5 . Join the Market Structure Patterns channel to download materials available for study and/or additional informations. Related posts: Market Structure Patterns - Introdução Market Structure Patterns   is an indicator based on   smart money concepts   that displays   SMC/ICT   elements that can take your trading decisions to the next level. Take advantage of the   alerts ,   push notifications   and   email messages   to keep informed from when an element is form
Atbot
Zaha Feiz
4.62 (55)
AtBot: 작동 방식 및 사용 방법 ### 작동 방식 MT5 플랫폼용 "AtBot" 지표는 기술 분석 도구의 조합을 사용하여 매수 및 매도 신호를 생성합니다. 01:37 단순 이동 평균(SMA), 지수 이동 평균(EMA), 평균 진폭 범위(ATR) 지수를 통합하여 거래 기회를 식별합니다. 또한 Heikin Ashi 캔들을 사용하여 신호의 정확성을 향상시킬 수 있습니다. 구매 후 리뷰를 남기면 특별 보너스 선물을 받게 됩니다. ### 주요 기능: - 비재표시: 신호는 플로팅 후 변경되지 않습니다. - 비재작성: 신호는 일관되며 변경되지 않습니다. - 지연 없음: 지연 없이 시기적절한 신호를 제공합니다. - 다양한 시간대: 거래 전략에 맞게 모든 시간대에서 사용할 수 있습니다. ### 운영 단계: #### 입력 및 설정: - firstkey (TrendValue): 추세 감지의 민감도를 조정합니다. - Secondkey (SignalValue): 매수/매도 신호 생성의 민감도를 정의
Easy Buy Sell Signal Alert
Franck Martin
4.69 (13)
Easy Buy Sell is a market indicator for opening and closing positions. It becomes easy to track market entries with alerts. It indicates trend reversal points when a price reaches extreme values ​​and the most favorable time to enter the market. it is as effective as a Fibonacci to find a level but it uses different tools such as an algorithm based on ATR indicators and Stochastic Oscillator. You can modify these two parameters as you wish to adapt the settings to the desired period. It cannot
IX Power MT5
Daniel Stein
4.92 (12)
IX Power: 지수, 원자재, 암호화폐 및 외환 시장 통찰력을 발견하세요 개요 IX Power 는 지수, 원자재, 암호화폐 및 외환 시장의 강도를 분석할 수 있는 다목적 도구입니다. FX Power 는 모든 가용 통화 쌍 데이터를 사용하여 외환 쌍에 대해 가장 높은 정확도를 제공하는 반면, IX Power 는 기초 자산 시장 데이터에만 초점을 맞춥니다. 이로 인해 IX Power 는 비외환 시장에 이상적이며, 다중 쌍 분석이 필요하지 않은 간단한 외환 분석에도 신뢰할 수 있는 도구입니다. 모든 차트에서 매끄럽게 작동하며, 거래 결정을 향상시키기 위한 명확하고 실행 가능한 통찰력을 제공합니다. 1. IX Power가 트레이더에게 유용한 이유 다양한 시장 강도 분석 • IX Power 는 지수, 원자재, 암호화폐 및 외환 심볼의 강도를 계산하여 각 시장에 맞는 통찰력을 제공합니다. • US30, WTI, 금, 비트코인 또는 통화 쌍과 같은 자산을 모니터링하여 거래 기회를 발견
FX Levels MT5
Daniel Stein
5 (12)
FX Levels: 모든 시장을 위한 뛰어난 정확도의 지지와 저항 간단 요약 통화쌍, 지수, 주식, 원자재 등 어떤 시장이든 믿을 만한 지지·저항 레벨을 찾고 싶나요? FX Levels 는 전통적인 “Lighthouse” 기법과 첨단 동적 접근을 결합해, 거의 보편적인 정확성을 제공합니다. 실제 브로커 경험을 반영하고, 자동화된 일별 업데이트와 실시간 업데이트를 결합함으로써 FX Levels 는 가격 반전 포인트를 파악하고, 수익 목표를 설정하며, 자신 있게 트레이드를 관리할 수 있게 돕습니다. 지금 바로 시도해 보세요—정교한 지지/저항 분석이 어떻게 여러분의 트레이딩을 한 단계 끌어올릴 수 있는지 직접 확인하세요! 1. FX Levels가 트레이더에게 매우 유용한 이유 뛰어난 정확도의 지지·저항 존 • FX Levels 는 다양한 브로커 환경에서도 거의 동일한 존을 생성하도록 설계되어, 데이터 피드나 시간 설정 차이로 인한 불일치를 해소합니다. • 즉, 어떤 브로커를 사용하
Gold Entry Sniper
Tahir Mehmood
5 (1)
Gold Entry Sniper – 골드 스캘핑 & 스윙 트레이딩을 위한 전문 다중 시간 프레임 ATR 대시보드 Gold Entry Sniper 는 XAUUSD 및 기타 종목에 대해 정확한 매수/매도 신호 를 제공하는 고급 MetaTrader 5 지표입니다. ATR 트레일링 스톱 로직 과 다중 시간 프레임 분석 을 기반으로 설계되어 스캘핑과 스윙 트레이딩 모두에 적합합니다. 주요 기능 및 장점 다중 시간 프레임 분석 – M1, M5, M15 추세를 한눈에 확인. ATR 기반 트레일링 스톱 – 변동성에 따라 자동 조정. 전문 차트 대시보드 – 신호 상태, ATR 레벨, 회귀선, 매매 방향 표시. 명확한 매수/매도 마커 – 자동 화살표와 텍스트 라벨. 종료 알림 & 거래 관리 – 수익 보호를 위한 자동 종료 감지. 완전 사용자 설정 가능 – 대시보드 위치, 색상, ATR/회귀선 파라미터 조정. 골드(XAUUSD) 최적화 – M1~M15 스캘핑에 완벽, 외환/지수/암호화폐에도 적용 가능.
Quantum Trend Sniper
Bogdan Ion Puscasu
4.74 (53)
소개       Quantum Trend Sniper Indicator는   추세 반전을 식별하고 거래하는 방식을 변화시키는 획기적인 MQL5 지표입니다! 13년 이상의 거래 경험을 가진 숙련된 트레이더 팀이 개발한       Quantum Trend Sniper 표시기       매우 높은 정확도로 추세 반전을 식별하는 혁신적인 방법으로 거래 여정을 새로운 차원으로 끌어올리도록 설계되었습니다. ***Quantum Trend Sniper Indicator를 구입하면 Quantum Breakout Indicator를 무료로 받을 수 있습니다!*** Quantum Trend Sniper Indicator는 추세 반전을 식별하고 세 가지 이익실현 수준을 제안할 때 경고, 신호 화살표를 제공합니다. 초보자 거래자와 전문 거래자 모두에게 적합합니다. Quantum EA 채널:       여기를 클릭하세요 MT4 버전:       여기를 클릭하세요 추천: 기간:모든 기간.
Support And Resistance Screener는 하나의 지표 안에 여러 도구를 제공하는 MetaTrader에 대한 하나의 레벨 지표입니다. 사용 가능한 도구는 다음과 같습니다. 1. 시장 구조 스크리너. 2. 완고한 후퇴 영역. 3. 약세 후퇴 영역. 4. 일일 피벗 포인트 5. 주간 피벗 포인트 6. 월간 피벗 포인트 7. 고조파 패턴과 볼륨에 기반한 강력한 지지와 저항. 8. 은행 수준 구역. LIMITED TIME OFFER : HV 지원 및 저항 표시기는 50 $ 및 평생 동안만 사용할 수 있습니다. ( 원래 가격 125$ ) MQL5 블로그에 액세스하면 분석 예제와 함께 모든 프리미엄 지표를 찾을 수 있습니다. 여기를 클릭하십시오. 주요 특징들 고조파 및 볼륨 알고리즘을 기반으로 하는 강력한 지원 및 저항 영역. Harmonic 및 Volume 알고리즘을 기반으로 한 강세 및 약세 풀백 영역. 시장 구조 스크리너 일간, 주간 및 월간 피벗 포인트. 실제 거래의
지표는 가격과 오실레이터/지표 사이에 다이버전스가 발생하는 시점을 식별합니다. 그것은 규칙적인 발산과 숨겨진 발산을 모두 식별합니다. 가장 강력한 설정만 필터링할 수 있는 RSI 필터 옵션이 있습니다. 지표는 또한 Engulfing 대형, Donchian 채널 돌파 또는 가격이 이동 평균을 넘을 때까지 기다릴 수 있는 옵션을 제공합니다   (스크린샷 #3 참조)       거래 기회를 알리기 전에 다이버전스를 확인합니다. 고유한 규칙 및 기술과 결합하여 이 표시기를 사용하면 자신만의 강력한 시스템을 생성(또는 강화)할 수 있습니다. 특징 의 끝에서       제품의 블로그       지표에서 거래 신호를 검색하기 위해 iCustom() 함수를 사용하는 예제 EA(전문가 고문)의 소스 코드를 다운로드할 수 있습니다. EA가 완벽하게 작동하더라도 주요 목적은 코드를 사용하여 자신이 개발한 EA에 붙여넣는 것입니다.   내 제한된 시간을 감안할 때       하지만 프로그래밍 지원은 제
제작자의 제품 더 보기
Trader Panel Alpha X
Alvaro Garcia Batelli
Are you tired of the slow, clunky, and uninformative default order panel in MetaTrader 5? Discretionary trading demands speed, precision, and above all, clear information. Clicking through multiple menus, dragging stops one by one, and lacking a consolidated view of your risk are barriers that cost you time and, most importantly, money. Professional trading requires professional tools. Trader Panel Alpha X Pro is the definitive solution. It's not just another "order ticket"; it's a complete trad
FREE
Risk Matrix Trader PRO
Alvaro Garcia Batelli
5 (1)
Ever feel lost in a trade, unsure of your true risk exposure? Have emotional decisions and a lack of discipline cost you dearly? The line between consistent profit and a blown account is drawn by one thing: professional risk management. But calculating and monitoring that risk in real-time is stressful and complex. Introducing Risk Matrix, the definitive visual command center for MetaTrader 5, engineered to bring military-grade discipline and crystal-clear clarity to your trading. Risk Matrix is
FREE
Trader Panel Alpha
Alvaro Garcia Batelli
Transform Your Manual Trading with the Best Free Order Ticket for MT5! Tired of the default MetaTrader ticket—slow and short on information? Trader Panel Grid Alpha is a professional-grade order panel built to give discretionary traders speed, control, and clarity. This free tool isn’t just another ticket; it’s a command station that puts your most important actions and data right on the chart, letting you focus on what really matters: your analysis. FREE VERSION FEATURES Lightning-Fast Execut
FREE
Cloud Trend Martrix
Alvaro Garcia Batelli
Cloud Trend Matrix: The Trend Indicator That Adapts to the Market Tired of indicators that work well in strong trends but generate dozens of false signals in sideways markets? The Cloud Trend Matrix was designed to solve this exact problem. It's not just another trend follower; it's an intelligent system that reads market volatility and adapts its entry triggers to deliver signals with a higher probability of success. ️ The Concept: A Low-Latency Cloud Unlike traditional indicators, the Cloud T
FREE
필터:
리뷰 없음
리뷰 답변