Monitor para Gradiente Linear

HedgingMonitor: Visual Control for Hedging Operations

HedgingMonitor: Professional Order Visualization for MT5

HedgingMonitor is a professional indicator for MetaTrader 5 that displays detailed information about all your open and pending orders in an organized and customizable visual panel. Ideal for traders who use hedging strategies or manage multiple orders simultaneously.

Key Features:

  • Intuitive Visual Interface: View all your orders in a single panel, with color coding to quickly identify buy orders (green) and sell orders (red).

  • Price Organization: Orders are automatically displayed from highest to lowest price, allowing you to quickly visualize the distribution of your positions.

  • Detailed Display: For each order, see the type (Buy/Sell), price, volume, current profit, and Take Profit with distance in points.

  • Advanced Formatting: Clear visual separators, allowing you to quickly locate the most important information.

  • Custom Design: Adjust colors, font size, positioning, and other visual characteristics according to your preference.

  • Page Navigation: Support for viewing multiple orders with an integrated navigation system when you have more orders than fit on the screen.

  • Order Differentiation: Clear visual distinction between open orders (B/S) and pending orders (BP/SP).

  • Real-Time Updates: Continuous monitoring of the current status of orders with automatic updates.

Comprehensive Guide to HedgingMonitor: Detailed Functionality

Interface Overview

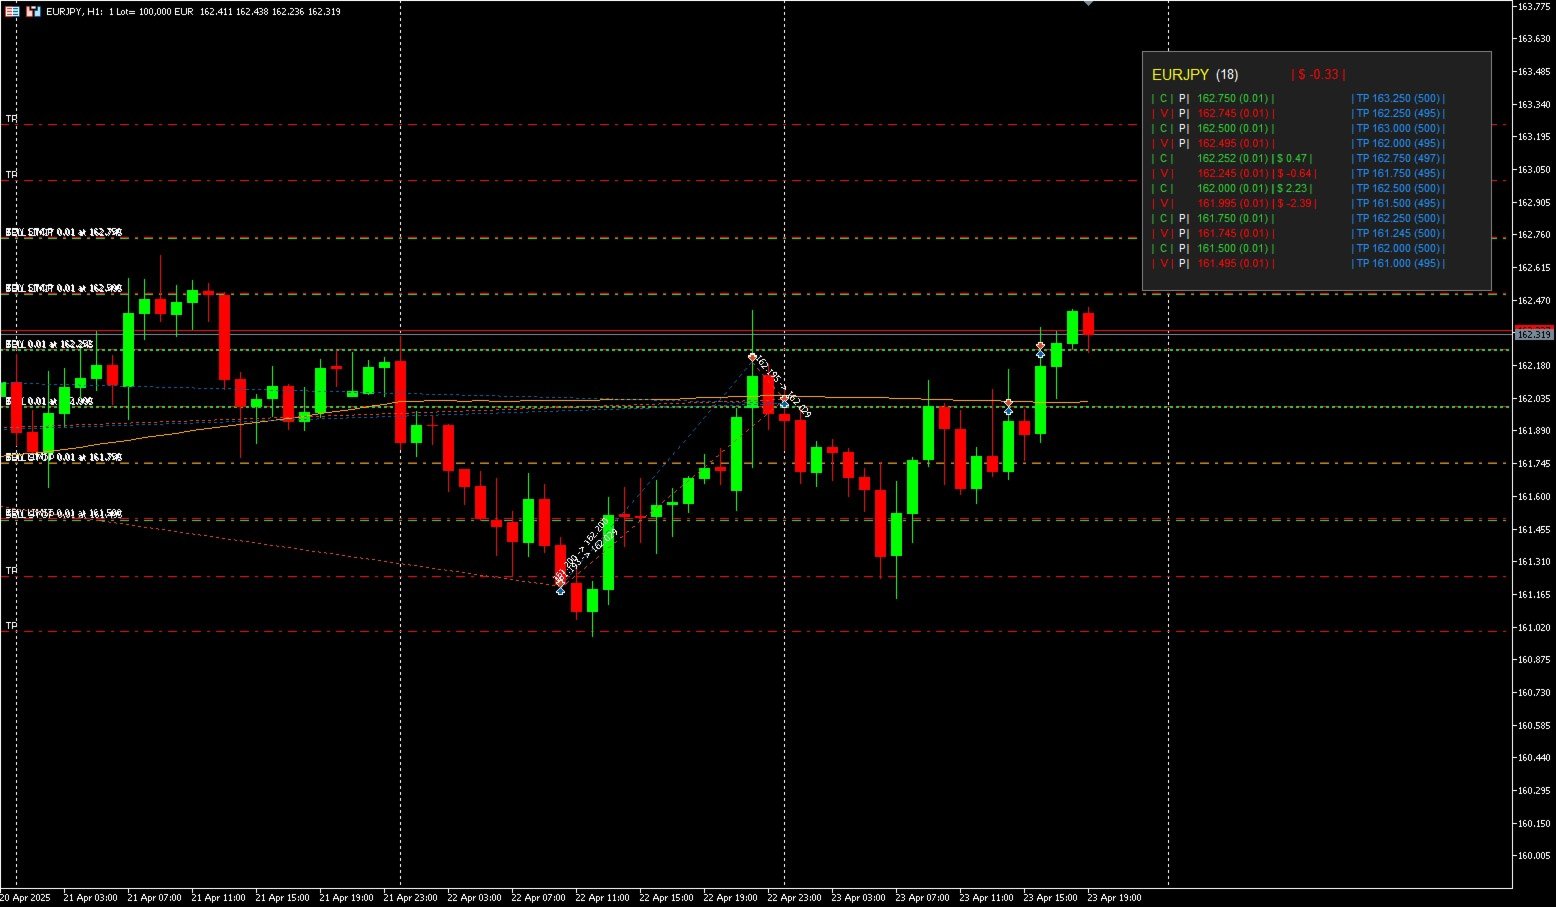
HedgingMonitor presents an elegant visual panel that appears directly on your MetaTrader 5 chart, displaying all your open positions and pending orders in an organized manner.

Detailed Functionality (from top to bottom)

Panel Header

  • Asset Name: Displayed in yellow and larger font, clearly shows the symbol being monitored (e.g., EURUSD).
  • Current Spread: Appears right after the asset name in parentheses (e.g., (2)), indicating the current spread in points.
  • Total Balance: Centered at the top of the panel, shows the total profit/loss of open positions in the format "| $ 135.65 |". Green color indicates profit, while red indicates loss.

Order List

All orders are organized by price, from highest to lowest, making it easy to visualize the distribution of your positions.

Display Format for Open Orders:

  • Order Type: "| B |" (Buy in green) or "| S |" (Sell in red) between vertical bars of the same color, for quick identification.
  • Price and Volume: Displayed in the color corresponding to the order (green for buy, red for sell) in the format "1.1050 (0.10) |" - where the first value is the entry price and the value in parentheses is the volume in lots.
  • Profit/Loss: Displayed in the format "| $ 2.35 |" in green for profit or red for loss. This field shows the current result of the position.
  • Take Profit: If configured, appears in blue in the format "| TP 1.1150 (100) |" - the first value is the TP price and the value in parentheses is the distance in points to the TP.

Display Format for Pending Orders:

  • Order Type: "| B | P |" (Buy Pending) or "| S | P |" - the main letter (B/S) in the corresponding color (green/red) and the letter P in white.
  • Price and Volume: Same format as open orders.
  • Central Field: Intentionally empty for pending orders (since they don't have current profit/loss).
  • Take Profit: Same format as open orders.

Navigation

If you have more orders than can be displayed at once (more than 18 by default):

  • Navigation Buttons: Buttons "|<|" and "|>|" allow you to navigate between order pages.
  • Page Indicator: Between the navigation buttons, shows the current page and the total (e.g., "1/3").

Color Coding and Motivations

  • Green (Buy): Used to quickly identify buy orders, following market convention.
  • Red (Sell): Used to quickly identify sell orders, following market convention.
  • Yellow (Symbol): Highlights the name of the asset being monitored.
  • Blue (Take Profit): Visually differentiates Take Profit information from the rest.
  • White (Letter P): Clearly highlights that the order is pending and has not yet been executed.

Customization

The indicator allows you to customize:

  • Colors for each element (text, background, buy, sell, TP)
  • Font size and font type
  • Panel positioning on the chart
  • Maximum number of visible lines

Practical Benefits

  • Visual Organization: Eliminates the need to switch between windows to check your positions.
  • Hedging Strategy Monitoring: Perfect for traders who maintain simultaneous buy and sell positions.
  • Risk Visualization: Price organization helps you quickly visualize the distribution of your exposures.
  • Take Profit Management: Clearly see the distance in points to your target, facilitating decisions about adjustments.
  • Focused Design: Shows only relevant information, without visual clutter.

This indicator is designed for traders who value clarity, organization, and efficiency in managing multiple positions, especially useful in complex hedging or grid strategies.


추천 제품
Utilities
Douglas Lucio De Araujo
Indicator with 3 features - Clock : Clock independent of the chart, counting continues even when the market is closed. - Template : After setting up a configuration in any graphic, be it color patterns, indicators, zoom ... The configuration will be copied to all active graphics. - TimeFrame : Set the TimeFrame on a chart, and with just one click all the active charts will be changed to the same TimeFrame.
Timeless Charts
Samuel Manoel De Souza
5 (1)
Timeless Charts is an advanced charting solution designed for professional traders seeking for custom charts / custom timeframes , including seconds charts / seconds timeframe, renko charts / renko bars, cluster charts / footprint charts and advanced tools present in most of the popular platforms. Unlike traditional offline charts or simplistic custom indicators, this solution constructs fully custom bars with true timestamp accuracy , down to miliseconds, allowing for a powerful and precise tr
VWAP Ultimate Pro MT5 – Anchored VWAP | Session VWAP | Dynamic Bands & Smart Alerts Elevate Your Trading Edge with the Ultimate Institutional-Grade VWAP Indicator WHY PROFESSIONAL TRADERS CHOOSE VWAP ULTIMATE PRO? VWAP (Volume-Weighted Average Price) is widely used by institutions and professional traders to estimate fair market value and intraday bias. VWAP Ultimate Pro MT5 brings this power to retail traders with an all-in-one indicator, combining multi-mode VWAP, interactive anchored VWAP,
MACD Level Alert MT5
Prafull Manohar Nikam
This is a simple arrow system based on MACD indicators Main/Base line and MACD Levels. It gives you alerts when MACD's Main Line crosses above/below certain level. Which type of alerts available? 1. It paints on chart Up/Down Arrows. 2. Popup message and sound alert in trading terminal window. 3. Push notification or Alert on your android and ios mobile phones (requires MT4 or MT5 app installed!)
Multi TF Trend Dashboard
Watcharapon Sangkaew
Multi-TF Trend Dashboard Short Description / Slogan: See the entire market trend in a single glance! A simple, clean, and powerful dashboard for every trader. Full Description: (1. For Free Distribution) Hello MQL5 Community, I am excited to share the Multi-TF Trend Dashboard , a tool I developed to simplify trend analysis. This indicator is offered completely free as a contribution to this amazing community. (2. Indicator's Functionality) Are you tired of constantly switching between timeframe
FREE
Sinaleiro Trader
Renato Takahashi
O Sinaleiro Trader é o robô de daytrade que usa multiníveis de acordo com a abertura do dia. Assim, a cada rompimento dos níveis, o robô emite ordens de compra ou venda, de acordo com a tendência. Os stops podem ser fixos ou dinâmicos de acordo com os níveis. É possível configurar a distância do sinaleiro, bem como horários de trades e dias da semana. Alterar o parâmetro BR1 para BR.
Combo Pro Alarma 2 en 1
Adriana Nicole Tapia Flores
Includes: 2 indicators + 2 Level 1 PDF books + 3+ hours of video course + 1 risk‑management template + 1 month VIP signals channel access This combo is part of our 3‑Level Book Set , designed to guide you step by step from the fundamentals to advanced trading. Perfect for anyone who wants to start strong with professional tools from day one. Explore all paths. Choose your journey. Build your strategy. What’s included in this Combo? 1. Indicators (single .ex5 file) MonthlyWeeklyDaily Previous Hi
# Wave Trend Oscillator (WTO) User Guide ## Overview Wave Trend Oscillator is a powerful technical analysis tool used to analyze price momentum and trend direction. It visualizes market conditions using two main lines (WT1 and WT2) and a histogram. ## Components 1. **WT1 (Green Line)**: Main trend indicator 2. **WT2 (Red Line)**: Signal line 3. **Histogram (Blue)**: Shows the difference between WT1 and WT2 4. **Arrows**: Mark crossover points    - Green Arrow: WT1 crosses above WT2 (Buy signa
KT Displaced Moving Averages MT5
KEENBASE SOFTWARE SOLUTIONS
KT DMA is a modified and advanced version of the classic Displaced Moving Averages with buy/sell crossover alerts and a Multi-Timeframe scanner that shows DMA's direction across each real-time time frame. A Displaced Moving Average is a simple moving average that moves ahead or backward in a time frame (either short-term or long-term). It also allows you to predict price movement more accurately. Features Depicts the trend direction using the alignment of three moving averages. Buy/Sell signals
PAX BDB Trade Chaos system of Bill Williams   (Bearish/Bullish divergent bar). One of the signals of the "Trade Chaos" system of Bill Williams. (First wiseman) When bar moving away from the  "Alligator" indicator and there is divergence on the Awesome Oscillator indicator, it shows a potential point of movement change. It is based on the opening/closing of the bar, the position relative to the previous ones, the Alligator and AO. When trading, the entrance is at the breakthrough of the bar(short
OrderHelper script is super easy and trader friendly to use. It would boost your trading experience. Because it is designed to open one to multiple orders quickly with just one click. Besides using the OrderHelper script, traders can define various parameters for open orders such as the symbol, order type, lot size, stoploss, takeprofit and more. Basically, with this script traders can manage their open orders more efficiently and save their trading time. OrderHelper manages: Open the number of
AutoSignals Trend
Aurelio Miguel Machado Da Silva
The indicator tracks the trend in 5 different chart times for the same asset, based on 6 signals for each chart time. The main objective of the indicator is to show us the majority trend of the financial asset in which it was placed. The system transmits the information of the trends in several graphic times, in this way the user is able to have a broad view of the movement of the asset, this type of tool makes the user have a higher hit rate by helping the operator to execute orders in favor o
RSImaxmin
Carlos Andrés Moya Erazo
4.5 (10)
The indicator shows when there are overprice and divergences on the RSI. In addition, it has configurable alerts, dynamic overprice levels and a special “RSI cleaner” function. The indicator that automatically calculates the premium rates! RSImaxmin is an indicator based on the Relative Strength Index (RSI) oscillator that effectively identifies changes in price trends as it reflects the relative strength of bullish movements compared to bearish movements. It is widely used by traders to measur
MA7 Galega MT5
Andrey Minaev
Description of work The MA7 Galega indicator is based on the standard Moving Average indicator. Shows a puncture of the moving average. Detailed information about the MA7 Galega indicator. Indicator settings General settings: Period ; Method ; Apply to ; Consider the direction of the candle . Message settings: Send message to the terminal (Alert) – permission to send messages to the terminal using the Alert function; Send message to the mobile terminal (Push) – permission to send messages to t
Trend Battle
Osmar Santiago
5 (1)
Trend Battle Indicator Overview The Trend Battle Indicator is a professional technical analysis tool that reveals the battle between buyers (Bulls) and sellers (Bears) in the market through a comprehensive dashboard. Using an intuitive visual interface, the indicator offers a unique perspective on market power dynamics by analyzing the last twenty bars to provide precise insights into momentum and directional strength. Additionally, the panel provides automatic real-time updates for bars in for
이 다중 시간 프레임 및 다중 기호 표시기는 핀 막대, 아침/저녁 별, 인글핑, 핀셋, 쓰리 라인 스트라이크, 내부 막대 및 페넌트 및 삼각형을 스캔합니다.   지표는 단일 차트 모드에서도 사용할 수 있습니다. 이 옵션에 대한 자세한 내용은 제품의       블로그   .       고유한 규칙 및 기술과 결합하여 이 표시기를 사용하면 자신만의 강력한 시스템을 생성(또는 강화)할 수 있습니다. 특징 Market Watch 창에 표시되는 모든 기호를 동시에 모니터링할 수 있습니다. 하나의 차트에만 지표를 적용하고 전체 시장을 즉시 모니터링하십시오. M1에서 MN까지 모든 시간대를 모니터링하고 패턴이 식별되면 실시간 경고(팝업, 푸시 또는 메일)를 보냅니다. RSI 및 볼린저 밴드를 핀 바, 아침/저녁 별   , 인글프잉 및 핀셋 형성   에 대한 필터로 사용하여 잠재적 반전을 적절하게 식별할 수 있습니다. 이동 평균을 주요 추세 필터로 사용하고 ADX를 변동성 필터로 사용할 수 있습니
Defense Line
Silvio Marcos Garcia
Indicator that determines very accurately "future" where BUYERS and SELLERS will defend their positions. DOES NOT use moving averages, Fibonacci or any other underlying indicators. SIMPLE AND EFFICIENT !! In these defense regions "DEFENSE LINE" is the best region for decision making to buy / sell. 1- Place the indicator on the chart 2 - Move the Vertical lines to the period to be analyzed 3 - The Defense Line will be drawn automatically 4 - To erase the Defense Line, press the "R" key
Elliott Wave Helper
Siarhei Vashchylka
4.92 (13)
Elliott Wave Helper - a panel for making elliott wave and technical analysis. Includes all known wave patterns, support and resistance levels, trend lines and cluster zones. Manual (Be sure to read before purchasing) | Version for MT4 Advantages 1. Making wave analysis and technical analysis in a few clicks 2. All Elliott wave patterns available, including triangle and combinations 3. All nine wave display styles, including a special circle font 4. E lements of technical analysis : trend lines,
Simple MACD Expert
Abraao Moreira
3 (1)
Estratégia de negociação MACD O cálculo do MACD é executado uma vez a cada tick, e são considerados para fim de cálculo os três últimos resultados, para analisar o cruzamento da linha de zero, ou seja quando o último resultado for maior que 0 e o antepenúltimo não então há um cruzamento para cima e analogamente para baixo, quando um cruzamento é constatado o estado de uma variável de controle é alterado de "false" para "true", permitindo o abertura de uma posição caso a média de sinal também cru
FREE
Range Exhaustion MT5
Robert Gerald Wood
범위 소진은 가격이 현재 기간의 예상 범위를 충족하거나 초과할 때 발생합니다. 이 수준에서 가격은 기간 초반에 비해 모멘텀을 잃기 시작하므로 새로운 포지션을 취하지 않도록 하는 것이 좋습니다. 이 지표는 일별, 주별 및 월별 기간에 대한 수준을 표시하여 차트에서 이러한 일이 발생할 가능성이 있는 위치를 보여줍니다. 이러한 고갈 수준을 초과하는 가격을 보면 움직임의 모멘텀이 매우 강하고 더 높은 기간 수준으로 향하고 있음을 알 수 있습니다. 지표는 기본 설정에 따라 ATR(Average True Range) 또는 ADR(Average Range) 계산을 사용할 수 있습니다. 기본적으로 우리는 Forex 차트에서 더 잘 작동하는 ATR을 사용하지만 ADR은 주식 기반 지수 및 기호에서 우위를 점합니다. 표시기에는 아래에 설명된 여러 그리기 모드가 있어 필요에 맞게 조정할 수 있습니다. 설정 계산 모드 레벨 계산을 위해 ATR(AverageTrueRange) 또는 ADR(AverageD
This easy to setup indicator shows you the market volumes in a different way, with support and resistance as showed. You can setup: - Backdays volume to show - Heiken Ashi candle view It works for every kind of graph and every kind of period. The program shows the volumes based on the number of candles displayed in the chart: the more candles the more volumes. Enjoy this very useful indicator. Please feel free to message me to report any kind of improvements! :D
Tenha a boleta do ProfitChart no seu Metatrader! ........................ Agora é possível ter a boleta do profit no seu Metatrader. Envie ordens de compra e venda, acompanhe o mercado e simule estratégias em momentos de mobilidade, diretamente do seu Metatrader5. Gestão de riscos e otimização de lucros são dois princípios básicos de qualquer operação bem-sucedida. Nesse sentido, utilize as ferramentas de  STOPMOVEL, TRAILING STOP, STOPGAIN E ORDENS PARCIAIS DE SAÍDA.       Funcionalidades do
KT Absolute Strength MT5
KEENBASE SOFTWARE SOLUTIONS
KT Absolute Strength measures and plots the absolute strength of the instrument's price action in a histogram form. It combines the moving average and histogram for a meaningful illustration. It supports two modes for the histogram calculation, i.e., it can be calculated using RSI and Stochastic both. However, for more dynamic analysis, RSI mode is always preferred. Buy Entry When the Absolute Strength histogram turns green and also it's higher than the previous red column. Sell Entry When th
Checkpoints
Tatiana Savkevych
The Checkpoints indicator implements an advanced algorithm for visualizing the market trend. The main application of the indicator is to generate buy and sell signals. Determining the market trend is an important task for traders. Probably, almost every trader has dreamed of non-lagging MAs at least once. I have embodied this dream in my indicator. With this indicator, you can predict future values.  The indicator is designed to determine either a trend or short-term buy or sell signals. The
Tabajara Ogro
JETINVEST
4.75 (12)
Setup Tabajara was created by a Brazilian trader known as  "The OGRO of Wall Street" . The idea of this setup is to indicate to the trader the current trend of prices and  the type of operation should be looked for in the graph. Operation It does this through the relation of the closing price position and the     of 20 periods, by painting the candles in 4 possible colors : Green -> Price rising in upward trend (Search entry points for PURCHASE) Black -> Price correcting in Bullish Trend (Sear
FREE
MA7 Aster MT5
Andrey Minaev
Description of work The MA7 Aster indicator is based on the standard Moving Average indicator. Shows the price deviation from the moving average. Detailed information about the MA7 Aster indicator. Indicator settings General settings: Period ; Method ; Apply to ; Minimum distance – minimum distance from the moving average to the closing price of the candle. Message settings: Send message to the terminal (Alert) – permission to send messages to the terminal using the Alert function; Send messag
PRECISION ENTRY MASTER INDICATOR Get In At The Perfect Price - Every Single Time ENTER THE MARKET AT THE MOST PROFITABLE MOMENTS Tired of buying the top and selling the bottom? Discover the SECRET to entering trades at the EXACT perfect timing - where institutional money flows and retail traders get liquidated. This isn't just another indicator... it's your gateway to professional-level entry precision. PERFECT ENTRIES = MAXIMUM PROFITS PINPOINT MARKET REVERSALS Catch the EXACT mom
ADR Pro
Oleksandr Myrhorodskyi
ADR Pro — Auto Adaptive Daily Range & Volatility Indicator (ATR + ADR + Alerts) Auto Adaptation. All Markets. No Guesswork . Enhance your trading decisions with precise ADR levels — for Forex, Crypto, Stocks, Indices, Metals, Energy, Commodities, and ETFs. Easy Setup Professional Features Lifetime Free Updates ADR Pro is your personal "volatility compass" that shows the real daily range boundaries for any asset. Forget manual calculations and constant parameter adjustments — the indicator
Anchored VWAP with Alerts
Alexandre Silva Diniz
앵커 VWAP(Anchored VWAP) 앵커 VWAP는 기존 VWAP의 변형으로, 거래 세션 시작이나 고정된 시간 간격이 아닌 특정 시점(앵커)에서 지표 계산을 시작합니다. 이는 주요 뉴스, 트렌드 시작, 지지선 또는 저항선 돌파와 같은 기술적 이벤트와 같은 특정 사건부터의 가격과 거래량 간의 관계를 평가하려는 트레이더에게 유용할 수 있습니다. 이 지표는 외환, 주식 및 지수에서 사용 가능합니다. 동일한 차트에 여러 인스턴스를 추가하고 각 VWAP의 앵커 지점을 클릭 한 번으로 수정할 수 있습니다. 가격이 VWAP에 도달할 때 알림을 활성화하십시오. VWAP는 "자성"을 가지고 있습니다: 캔들 위에 마우스를 올리면 HIGH로, 중앙에 두면 TYPICAL로, 캔들 아래에 두면 LOW로 자동 설정됩니다.
FREE
스토캐스틱 멀티커런시 스캐너 대시보드 MT5 는 스토캐스틱 오실레이터를 사용하여 여러 통화 쌍과 시간 프레임을 모니터링하도록 설계된 강력한 도구입니다. 심볼과 시간 프레임(M1에서 MN1까지)을 기준으로 신호를 정리하는 그리드 형식으로 제공됩니다. 트레이더는 전략에 맞게 특정 시간 프레임을 활성화하거나 비활성화할 수 있습니다. MT4 버전은 여기에서 확인할 수 있습니다: Stochastic Oscillator Multicurrency Scanner MT4 자세한 문서는 여기에서 클릭하세요: 문서 이 도구는 다음 스토캐스틱 전략을 기반으로 신호를 표시합니다: 과매수/과매도 전략: 스토캐스틱이 과매수(상위 레벨 초과) 또는 과매도(하위 레벨 미만) 구역에 진입하거나 벗어날 때 신호가 생성되어 잠재적인 반전을 나타냅니다. 역레벨 전략: 스토캐스틱이 사용자 정의 또는 자동 계산된 상위 또는 하위 레벨을 역방향으로 교차할 때 신호가 트리거되어 모멘텀의 변화를 시사합니다. 크로스오버 전략: 스
이 제품의 구매자들이 또한 구매함
이 지표를 구매하면 제 프로페셔널 트레이드 매니저를 무료로 드립니다. 우선 이 거래 시스템이 리페인팅, 리드로잉 및 레이그 인디케이터가 아니라는 점을 강조하는 것이 중요합니다. 이는 수동 및 로봇 거래 모두에 이상적인 것으로 만듭니다. 온라인 강좌, 설명서 및 프리셋 다운로드. "스마트 트렌드 트레이딩 시스템 MT5"은 새로운 및 경험이 풍부한 트레이더를 위해 맞춤형으로 제작된 종합적인 거래 솔루션입니다. 10개 이상의 프리미엄 인디케이터를 결합하고 7개 이상의 견고한 거래 전략을 특징으로 하여 다양한 시장 조건에 대한 다목적 선택이 가능합니다. 트렌드 추종 전략: 효과적인 트렌드 추이를 타기 위한 정확한 진입 및 손절 관리를 제공합니다. 반전 전략: 잠재적인 트렌드 반전을 식별하여 트레이더가 범위 시장을 활용할 수 있게 합니다. 스캘핑 전략: 빠르고 정확한 데이 트레이딩 및 단기 거래를 위해 설계되었습니다. 안정성: 모든 인디케이터가 리페인팅, 리드로잉 및 레이그가 아니므로 신뢰
Power Candles MT5
Daniel Stein
5 (5)
Power Candles – 모든 시장을 위한 강도 기반 진입 신호 Power Candles 는 Stein Investments의 검증된 강도 분석을 가격 차트에 직접 제공합니다. 가격 움직임에만 반응하는 대신, 각 캔들은 실제 시장 강도를 기준으로 색상화되어 모멘텀 형성, 강도 가속, 명확한 추세 전환을 즉시 파악할 수 있습니다. 모든 시장을 위한 단일 로직 Power Candles는 모든 거래 심볼 에서 자동으로 작동합니다. 현재 심볼이 Forex인지 비-Forex 시장인지 자동으로 감지하여 내부적으로 적절한 강도 모델을 적용합니다. Forex 및 Gold 는 FX Power Delta 값을 사용합니다 (절대값 범위 최대 100) 지수, 크립토 및 CFD 는 IX Power Strength 값을 사용합니다 (절대값 범위 최대 50) 필요한 강도 계산은 Power Candles에 완전히 내장되어 있습니다. 캔들 색상이나 신호 로직을 위해 추가 인디케이터는 필요하지 않습니다. 가격
Divergence Bomber
Ihor Otkydach
4.9 (80)
이 지표를 구매하신 분께는 다음과 같은 혜택이 무료로 제공됩니다: 각 거래를 자동으로 관리하고, 손절/익절 수준을 설정하며, 전략 규칙에 따라 거래를 종료하는 전용 도우미 툴 "Bomber Utility" 다양한 자산에 맞게 지표를 설정할 수 있는 셋업 파일(Set Files) "최소 위험", "균형 잡힌 위험", "관망 전략" 모드로 설정 가능한 Bomber Utility의 셋업 파일 이 전략을 빠르게 설치, 설정, 시작할 수 있도록 돕는 단계별 영상 매뉴얼 주의: 위의 모든 보너스를 받기 위해서는 MQL5 개인 메시지 시스템을 통해 판매자에게 연락해 주세요. 독창적인 커스텀 지표인 “Divergence Bomber(다이버전스 봄버)”를 소개합니다. 이 지표는 MACD 다이버전스(괴리) 전략을 기반으로 한 올인원(All-in-One) 거래 시스템입니다. 이 기술 지표의 주요 목적은 가격과 MACD 지표 간의 다이버전스를 감지하고, **향후 가격이 어느 방향으로 움직일지를 알려주는
SuperScalp Pro
Van Minh Nguyen
5 (1)
SuperScalp Pro – 고급 다중 필터 스캘핑 인디케이터 시스템 SuperScalp Pro는 클래식 Supertrend와 여러 지능형 확인 필터를 결합한 고급 스캘핑 인디케이터 시스템입니다. 해당 인디케이터는 M1부터 H4까지 모든 타임프레임에서 효율적으로 작동하며, 특히 XAUUSD, BTCUSD 및 주요 외환 통화쌍에 적합합니다. 독립형 시스템으로 사용하거나 기존 거래 전략에 유연하게 통합할 수 있습니다. 이 인디케이터는 11개 이상의 필터를 통합하며, 빠른/느린 EMA, 추세 판별용 3개의 EMA, EMA 기울기(EMA slope), RSI, ADX, 거래량(Volume), VWAP, 볼린저 밴드 돌파(Bollinger Bands Breakout) 및 MACD 다이버전스 필터 등을 포함합니다. 스마트 캔들 필터는 캔들 종가를 확인하여 약한 신호를 제거하고, 3 EMA와 MACD 다이버전스 필터를 결합한 추세 인식 메커니즘은 더 높은 승률의 신호를 선별하는 데 도움을 줍니
Entry In The Zone and SMC Multi Timeframe 은 Smart Money Concepts(SMC)를 기반으로 개발된 실시간 시장 분석 도구입니다. 이 시스템은 트레이더가 시장 구조를 체계적으로 분석하고 전체적인 시장 방향을 더욱 명확하게 파악할 수 있도록 설계되었습니다. 시스템은 여러 시간대에서 반전 포인트(Reversal Points), 핵심 구역(Key Zones), 그리고 시장 구조(Market Structure)를 자동으로 분석하며, POI(Point of Interest), 노 리페인트(No Repaint) 신호, 자동 피보나치 레벨(Auto Fibonacci Levels)을 표시하여 되돌림(Pullback)과 반전 포인트를 정확하게 탐지할 수 있도록 돕습니다. 또한 실시간 신호와 알림을 통해 가격이 핵심 구역에 진입하거나 해당 구역에서 반전 신호가 발생하는 순간을 놓치지 않도록 보조합니다. 더불어 이 시스템은 인디케이터와 신호 시스템을 하나로
Atomic Analyst MT5
Issam Kassas
4.19 (27)
우선적으로 언급할 점은이 거래 지표가 다시 그리지 않고 지연되지 않으며 이를 통해 수동 및 로봇 거래 모두에 이상적이라는 점입니다. 사용자 매뉴얼: 설정, 입력 및 전략. Atomic Analyst는 가격의 강도와 모멘텀을 활용하여 시장에서 더 나은 이점을 찾는 PA Price Action Indicator입니다. 고급 필터를 장착하여 잡음과 거짓 신호를 제거하고 거래 잠재력을 높이는 데 도움이 됩니다. 복잡한 지표의 다중 레이어를 사용하여 Atomic Analyst는 차트를 스캔하고 복잡한 수학적 계산을 간단한 신호와 색상으로 변환하여 초보 트레이더가 이해하고 일관된 거래 결정을 내릴 수 있도록합니다. "Atomic Analyst"는 새로운 및 경험이 풍부한 트레이더를위한 종합적인 거래 솔루션입니다. 프리미엄 지표와 최고 수준의 기능을 하나의 거래 전략에 결합하여 모든 종류의 트레이더에 대한 다재다능한 선택지가되었습니다. 인트라데이 거래 및 스캘핑 전략 : 빠르고 정확한 일일
FX Power MT5 NG
Daniel Stein
5 (30)
FX Power: 통화 강세 분석으로 더 스마트한 거래 결정을 개요 FX Power 는 어떤 시장 상황에서도 주요 통화와 금의 실제 강세를 이해하기 위한 필수 도구입니다. 강한 통화를 매수하고 약한 통화를 매도함으로써 FX Power 는 거래 결정을 단순화하고 높은 확률의 기회를 발견합니다. 트렌드를 따르거나 극단적인 델타 값을 사용해 반전을 예측하고자 한다면, 이 도구는 귀하의 거래 스타일에 완벽히 적응합니다. 단순히 거래하지 말고, FX Power 로 더 스마트하게 거래하세요. 1. FX Power가 거래자에게 매우 유용한 이유 통화와 금의 실시간 강세 분석 • FX Power 는 주요 통화와 금의 상대적 강세를 계산하고 표시하여 시장 역학에 대한 명확한 통찰력을 제공합니다. • 어떤 자산이 앞서고 있고 어떤 자산이 뒤처지는지 모니터링하여 보다 현명한 거래 결정을 내릴 수 있습니다. 포괄적인 멀티 타임프레임 뷰 • 단기, 중기 및 장기 타임프레임에서 통화와 금의 강세를
Azimuth Pro
Ottaviano De Cicco
5 (1)
LAUNCH PROMO Azimuth Pro price is initially set at 299$ for the first 100 buyers. Final price will be 499$ . THE DIFFERENCE BETWEEN RETAIL AND INSTITUTIONAL ENTRIES ISN'T THE INDICATOR — IT'S THE LOCATION. Most traders enter at arbitrary price levels, chasing momentum or reacting to lagging signals. Institutions wait for price to reach structured levels where supply and demand actually shift. Azimuth Pro maps these levels automatically: swing-anchored VWAP, multi-timeframe structure lines, an
Game Changer Indicator mt5
Vasiliy Strukov
4.21 (14)
Game Changer는 모든 금융 상품에 사용하도록 설계된 혁신적인 추세 지표로, 메타트레이더를 강력한 추세 분석기로 탈바꿈시켜 줍니다. 이 지표는 재작성이나 지연 현상이 발생하지 않습니다. 모든 시간대에서 작동하며 추세 파악을 지원하고, 잠재적 반전 신호를 제공하며, 트레일링 스톱 메커니즘으로 활용되고, 신속한 시장 반응을 위한 실시간 알림을 제공합니다. 숙련된 투자자, 전문가, 또는 우위를 점하려는 초보자 등 누구나 이 도구를 통해 자신감과 원칙을 바탕으로, 그리고 근본적인 추세 역학에 대한 명확한 이해를 바탕으로 거래할 수 있습니다. 구매 후 바로 연락 주시면 개인 보너스를 드립니다! 강력한 지지선과 추세 스캐너 지표를 무료로 받으실 수 있습니다. 개인 메시지로 알려주세요 저는 텔레그램에서 EA나 특별 세트를 판매하지 않습니다. Mql5에서만 사용 가능하며, 세트 파일은 제 블로그에서만 볼 수 있습니다 . 사기꾼을 조심하시고 다른 사람에게서 세트를 구매하지 마세요 설정 추세
Super Signal – Skyblade Edition 전문가용 노리페인트 / 노래그 트렌드 신호 시스템, 뛰어난 승률 제공 | MT4 / MT5용 1분, 5분, 15분과 같은 낮은 타임프레임에서 가장 좋은 성능을 보입니다. 핵심 기능: Super Signal – Skyblade Edition은 추세 매매를 위해 설계된 스마트 신호 시스템입니다. 이 시스템은 다중 필터 로직을 활용하여, 명확한 방향성과 실질적인 모멘텀이 수반된 고품질 추세만을 감지합니다. 이 시스템은   고점 또는 저점을 예측하지 않으며 , 다음 세 가지 조건이 모두 충족될 때만 신호를 발생시킵니다: 명확한 추세 방향 강화되는 모멘텀 건전한 변동성 구조 또한, 시장 세션 기반의 유동성 분석을 통해 신호의 신뢰성과 타이밍을 더욱 향상시킵니다. 신호 특성: 모든 화살표 신호는 100% 리페인트 없음 / 지연 없음 신호가 한 번 발생하면 고정되며, 깜빡이거나 사라지지 않음 차트 상의 시각적 화살표, 정보 패널, 팝업
Smart Stop Indicator – 차트 위에서 직접 작동하는 지능형 스톱로스 시스템 개요 Smart Stop Indicator는 감이나 추측이 아닌 명확하고 체계적인 방식으로 스톱로스를 설정하고 싶은 트레이더를 위한 맞춤형 솔루션입니다. 이 도구는 클래식 프라이스 액션 논리(고점, 저점 구조)와 현대적인 브레이크아웃 인식을 결합하여 실제로 가장 논리적인 다음 스톱 레벨을 정확히 식별합니다. 추세, 박스권, 빠른 브레이크아웃 상황 등 어떤 시장에서도 인디케이터는 최적의 SL 구역과 상태(“new”, “broken”, “valid”)를 차트에 직접 표시합니다. 새로운 기능으로 SL 거리의 %ADR 표시가 추가되었습니다. 핵심 기능 자동 시장구조 기반 스톱 설정 • 시장 구조와 실시간 가격 움직임을 기반으로 의미 있는 스톱로스 레벨을 자동으로 탐지합니다. 스마트 브레이크아웃 감지 • 빠른 방향 변화나 돌파 상황에서도 불필요한 조기 스톱 조정을 강요하지 않으며 유연하게 반응합
Berma Bands
Muhammad Elbermawi
5 (7)
Berma Bands(BBs) 지표는 시장 동향을 파악하고 이를 활용하려는 트레이더에게 귀중한 도구입니다. 가격과 BBs 간의 관계를 분석함으로써 트레이더는 시장이 추세 단계인지 범위 단계인지를 분별할 수 있습니다. 자세한 내용을 알아보려면 [ Berma Home Blog ]를 방문하세요. 버마 밴드는 세 개의 뚜렷한 선으로 구성되어 있습니다. 어퍼 버마 밴드, 미들 버마 밴드, 로어 버마 밴드입니다. 이 선들은 가격 주위에 그려져 전체 추세에 대한 가격 움직임을 시각적으로 표현합니다. 이 밴드들 사이의 거리는 변동성과 잠재적인 추세 반전에 대한 통찰력을 제공할 수 있습니다. 버마 밴드 라인이 각각에서 분리될 때, 그것은 종종 시장이 횡보 또는 범위 이동 기간에 접어들고 있음을 시사합니다. 이는 명확한 방향 편향이 없음을 나타냅니다. 트레이더는 이러한 기간 동안 추세를 파악하기 어려울 수 있으며 더 명확한 추세가 나타날 때까지 기다릴 수 있습니다. 버마 밴드 라인이 단일 라인으로
Trend Screener Pro MT5
STE S.S.COMPANY
4.84 (100)
트렌드 표시기, 트렌드 트레이딩 및 필터링을 위한 획기적인 고유 솔루션, 하나의 도구 안에 내장된 모든 중요한 트렌드 기능! Forex, 상품, 암호 화폐, 지수 및 주식과 같은 모든 기호/도구에 사용할 수 있는 100% 다시 칠하지 않는 다중 시간 프레임 및 다중 통화 표시기입니다. Trend Screener는 차트에 점이 있는 화살표 추세 신호를 제공하는 효율적인 지표 추세 추종 지표입니다. 추세 분석기 표시기에서 사용할 수 있는 기능: 1. 트렌드 스캐너. 2. 최대 이익 분석이 있는 추세선. 3. 추세 통화 강도 측정기. 4. 경고가 있는 추세 반전 점. 5. 경고가 있는 강력한 추세 점. 6. 추세 화살표 Trend Screener Indicator가 있는 일일 분석 예, 일일 신호 성능...등은 여기에서 찾을 수 있습니다. 여기를 클릭하십시오. LIMITED TIME OFFER : Trend Screener Indicator는 50$ 및 평생 동안만 사용할 수 있습니다.
Trend Forecaster
Alexey Minkov
5 (7)
The Trend Forecaster indicator utilizes a unique proprietary algorithm to determine entry points for a breakout trading strategy. The indicator identifies price clusters, analyzes price movement near levels, and provides a signal when the price breaks through a level. The Trend Forecaster indicator is suitable for all financial assets, including currencies (Forex), metals, stocks, indices, and cryptocurrencies. You can also adjust the indicator to work on any time frames, although it is recommen
Gold Sniper Scalper Pro
Ich Khiem Nguyen
3.5 (8)
Gold Sniper Scalper Pro는 MetaTrader 5용 전문 지표로, 트레이더가 진입 지점을 식별하고 리스크를 효과적으로 관리할 수 있도록 지원하기 위해 설계되었습니다. 이 지표는 시그널 감지 시스템, 자동 Entry/SL/TP 관리, 거래량 분석 및 실시간 성과 통계를 포함하는 포괄적인 분석 도구 세트를 제공합니다. 시스템 이해를 위한 사용자 가이드   |   기타 언어 사용자 가이드 주요 기능 시그널 감지 시스템 지표는 Price Action 분석 및 시장 구조를 기반으로 잠재적 진입 지점을 자동으로 감지합니다. 거래 기회 감지 시: - BUY 화살표(녹색) 또는 SELL 화살표(빨간색)가 차트에 표시됩니다 - 캔들이 색상으로 표시되어 시그널 영역을 식별합니다 - Entry/SL/TP 레벨이 자동으로 계산됩니다 시그널은 가격이 Entry 레벨에 도달할 때만 활성화되어, 시장에서 확인되지 않은 시그널을 필터링합니다. 지능형 Entry/SL/TP 관리 - Ent
AriX
Temirlan Kdyrkhan
1 (4)
AriX Indicator for MT5 A powerful trend-following and signal-evaluation tool AriX is a custom MT5 indicator that combines Moving Averages and ATR-based risk/reward logic to generate clear buy/sell signals. It visualizes dynamic SL/TP levels, evaluates past trade outcomes, and displays win/loss statistics in a clean on-chart panel. Key features include: Buy/Sell signals based on MA crossovers ATR-based SL/TP1/TP2/TP3 levels with visual lines and labels Signal outcome tracking with real-time stat
우선적으로, 이 거래 도구는 전문적인 거래에 이상적인 비-다시 그리기 및 지연되지 않는 지표입니다.  온라인 강좌, 사용자 매뉴얼 및 데모. 스마트 가격 액션 컨셉트 인디케이터는 신규 및 경험 많은 트레이더 모두에게 매우 강력한 도구입니다. Inner Circle Trader Analysis 및 Smart Money Concepts Trading Strategies와 같은 고급 거래 아이디어를 결합하여 20가지 이상의 유용한 지표를 하나로 결합합니다. 이 인디케이터는 스마트 머니 컨셉트에 중점을 두어 대형 기관의 거래 방식을 제공하고 이동을 예측하는 데 도움을 줍니다.  특히 유동성 분석에 뛰어나 기관이 어떻게 거래하는지 이해하는 데 도움을 줍니다. 시장 트렌드를 예측하고 가격 변동을 신중하게 분석하는 데 탁월합니다. 귀하의 거래를 기관 전략에 맞추어 시장의 동향에 대해 더 정확한 예측을 할 수 있습니다. 이 인디케이터는 시장 구조를 분석하고 중요한 주문 블록을 식별하고 다양
Advanced Supply Demand MT5
Bernhard Schweigert
4.5 (14)
현재 33% 할인! 초보자나 전문 트레이더를 위한 최고의 솔루션! 이 보조지표는 우리가 다수의 독창적 기능과 새로운 공식을 통합한 독특하고 고품질이며 저렴한 거래 도구입니다. 이 업데이트를 통해 이중 시간대를 표시할 수 있습니다. 더 높은 TF를 표시할 수 있을 뿐만 아니라 차트 TF와 더 높은 TF 모두를 표시할 수 있습니다: 중첩 영역 표시. 모든 Supply Demand 트레이더들이 좋아할 것입니다. :) 중요한 정보 공개 Advanced Supply Demand의 잠재력을 극대화하려면 다음을 방문하십시오. https://www.mql5.com/ko/blogs/post/720245   진입 또는 목표의 명확한 트리거 포인트를 정확히 찾아냄으로 해서 거래가 어떻게 개선될지 상상해 보십시오. 새로운 알고리즘을 기반으로 매수자와 매도자 간의 잠재적인 불균형을 훨씬 더 쉽게 분간할 수 있습니다. 왜냐하면 가장 강한 공급영역과 가장 강한 수요 영역과 과거에 어떻게 진행 되었는지를(이전
ARICoins
Temirlan Kdyrkhan
ARICoin is a powerful trading companion designed to generate high-probability entry signals with dynamic TP/SL/DP levels based on volatility. Built-in performance tracking shows win/loss stats, PP1/PP2 hits, and success rates all updated live. Key Features: Buy/Sell signals with adaptive volatility bands Real-time TP/SL/DP levels based on ATR Built-in MA Filter with optional ATR/StdDev volatility Performance stats panel (Success, Profit/Loss, PP1/PP2) Alerts via popup, sound, push, or email Cust
FX Levels MT5
Daniel Stein
5 (12)
FX Levels: 모든 시장을 위한 뛰어난 정확도의 지지와 저항 간단 요약 통화쌍, 지수, 주식, 원자재 등 어떤 시장이든 믿을 만한 지지·저항 레벨을 찾고 싶나요? FX Levels 는 전통적인 “Lighthouse” 기법과 첨단 동적 접근을 결합해, 거의 보편적인 정확성을 제공합니다. 실제 브로커 경험을 반영하고, 자동화된 일별 업데이트와 실시간 업데이트를 결합함으로써 FX Levels 는 가격 반전 포인트를 파악하고, 수익 목표를 설정하며, 자신 있게 트레이드를 관리할 수 있게 돕습니다. 지금 바로 시도해 보세요—정교한 지지/저항 분석이 어떻게 여러분의 트레이딩을 한 단계 끌어올릴 수 있는지 직접 확인하세요! 1. FX Levels가 트레이더에게 매우 유용한 이유 뛰어난 정확도의 지지·저항 존 • FX Levels 는 다양한 브로커 환경에서도 거의 동일한 존을 생성하도록 설계되어, 데이터 피드나 시간 설정 차이로 인한 불일치를 해소합니다. • 즉, 어떤 브로커를 사용하
ARIScalping
Temirlan Kdyrkhan
ARIScalp is a powerful trading companion designed to generate high-probability entry signals with dynamic TP/SL/DP levels based on volatility. Built-in performance tracking shows win/loss stats, PP1/PP2 hits, and success rates all updated live. Key Features: Buy/Sell signals with adaptive volatility bands Real-time TP/SL/DP levels based on ATR Built-in MA Filter with optional ATR/StdDev volatility Performance stats panel (Success, Profit/Loss, PP1/PP2) Alerts via popup, sound, push, or email Cus
TPSproTREND PrO MT5
Roman Podpora
4.74 (19)
TPSproTrend PRO는 시장이 실제로 방향을 바꾸는 순간을 포착하여 움직임의 시작점에서 진입점을 형성합니다. 가격이 움직이기 시작할 때 시장에 진입해야 하며, 이미 가격 변동이 일어난 후에 진입해서는 안 됩니다.   (지표)       신호를 다시 그리지 않고 진입점, 손절매, 이익실현을 자동으로 표시하여 거래를 명확하고 시각적이며 체계적으로 만들어줍니다. 설명서 (러시아어)   -   MT4 버전 주요 장점 신호 재표시 없이 신호가 표시됩니다.   모든 신호는 고정되어 있습니다. 화살표가 나타나면 -       그것은 더 이상 변하거나 사라지지 않을 것입니다. 잘못된 신호의 위험 없이 안정적인 데이터를 기반으로 거래 결정을 내릴 수 있습니다. 바로 사용 가능한 매수/매도 진입점 이 지표는 거래 진입에 가장 적합한 시점을 자동으로 판단하여 차트에 화살표로 표시합니다. 추측이나 주관적인 분석이 아닌, 명확한 신호만 있습니다. 자동 손절매 및 이익실현 영역 신호 직후에 다음
PZ Swing Trading MT5
PZ TRADING SLU
5 (5)
Protect against whipsaws: revolutionize your swing trading approach Swing Trading is the first indicator designed to detect swings in the direction of the trend and possible reversal swings. It uses the baseline swing trading approach, widely described in trading literature. The indicator studies several price and time vectors to track the aggregate trend direction and detects situations in which the market is oversold or overbought and ready to correct. [ Installation Guide | Update Guide | Tro
M1 Scalper Pro MT5
Elif Kaya
4.64 (11)
- Real price is 80$ - 45% Discount (It is 45$ now) Contact me for extra bonus   indicator, instruction or any questions! - Lifetime update free - Non-repaint - Related product: Gann Gold EA - I just sell my products in Elif Kaya Profile, any other websites are stolen old versions, So no any new updates or support. Advantages of  M1 Scalper Pro  Profitability: M1 Scalper Pro is highly profitable with a strict exit strategy. Frequent Opportunities: M1 Scalper Pro  takes advantage of numerous smal
무료 AUX 인디케이터와 EA 지원을 받으세요 직접 다운로드 — 여기를 클릭 [ D.I.C.E ] The DICE Indicator  Divergence in Chaos Environment는 엘리엇 파동 이론과 트레이딩 카오스 기법을 함께 사용하는 트레이더를 위해 설계된 MT5 전문 도구입니다. 가격 움직임의 숨겨진 및 일반 다이버전스를 감지하며, 빌 윌리엄스가 설명한 혼돈 시장 환경과 동기화됩니다. 주요 특징 엘리엇 파동 정렬 다이버전스: 파동 구조에 조화된 강세 및 약세 다이버전스를 탐지하여 파동 카운팅 정확도를 높입니다. 카오스 기법 통합: AO(오썸 오실레이터) 및 시장 구조 원칙과 일치하도록 설계되었습니다. 다중 타임프레임 스캐닝: 다양한 시간 프레임에서 다이버전스를 분석하여 모멘텀 변화와 추세 소진을 확인합니다. 시각적 알림 및 객체: 명확한 화살표, 선, 표시로 빠른 인식 가능. 적응형 시장 판독: 혼돈 시장 조건에 자동으로 조정되어 노이즈를 필터링하고 유효한 셋업만
Grabber System MT5
Ihor Otkydach
4.82 (22)
탁월한 기술적 지표인 Grabber를 소개합니다. 이 도구는 즉시 사용 가능한 “올인원(All-Inclusive)” 트레이딩 전략으로 작동합니다. 하나의 코드 안에 강력한 시장 기술 분석 도구, 매매 신호(화살표), 알림 기능, 푸시 알림이 통합되어 있습니다. 이 인디케이터를 구매하신 모든 분들께는 다음의 항목이 무료로 제공됩니다: Grabber 유틸리티: 오픈 포지션을 자동으로 관리하는 도구 단계별 영상 매뉴얼: 설치, 설정, 그리고 실제 거래 방법을 안내 맞춤형 세트 파일: 인디케이터를 빠르게 자동 설정하여 최고의 성과를 낼 수 있도록 도와줍니다 다른 전략은 이제 잊어버리세요! Grabber만이 여러분을 새로운 트레이딩의 정점으로 이끌어 줄 수 있습니다. Grabber 전략의 주요 특징: 거래 시간 프레임: M5부터 H4까지 거래 가능한 자산: 어떤 자산이든 사용 가능하지만, 제가 직접 테스트한 종목들을 추천드립니다 (GBPUSD, GBPCAD, GBPCHF, AUDCAD, AU
Trend indicator AI mt5
Ramil Minniakhmetov
5 (13)
트렌드 인공 지능 지표는 실행 가능한 진입 점 및 반전 경고와 추세 식별을 결합하여 상인의 시장 분석을 향상시킬 훌륭한 도구입니다. 이 표시기는 사용자가 자신감과 정밀도로 외환 시장의 복잡성을 탐색 할 수 있도록 지원합니다 기본 신호 외에도 트렌드 인공 지능 지표는 풀백 또는 되돌림 중에 발생하는 2 차 진입 점을 식별하여 거래자가 기존 트렌드 내에서 가격 수정을 활용할 수 있도록합니다. 중요한 장점: ·작동 4 및 5 *명확한 구매 또는 판매 신호 *다시 칠하지 않습니다 *모든 자산에서 작동 나는 전보 사기에 개 또는 세트를 판매하지 않도록주의. 모든 설정은 블로그에 여기에 무료.  중요! 지침 및 보너스를 얻기 위해 구입 후 즉시 저에게 연락! 진짜 가동 감시는 뿐 아니라 나의 다른 제품 여기에서 찾아낼 수 있습니다: https://www.mql5.com/en/users/mechanic/seller&nbsp ; 설정 및 입력: 모든 자산에 대해 기본 설정을 권
IX Power MT5
Daniel Stein
4.92 (12)
IX Power: 지수, 원자재, 암호화폐 및 외환 시장 통찰력을 발견하세요 개요 IX Power 는 지수, 원자재, 암호화폐 및 외환 시장의 강도를 분석할 수 있는 다목적 도구입니다. FX Power 는 모든 가용 통화 쌍 데이터를 사용하여 외환 쌍에 대해 가장 높은 정확도를 제공하는 반면, IX Power 는 기초 자산 시장 데이터에만 초점을 맞춥니다. 이로 인해 IX Power 는 비외환 시장에 이상적이며, 다중 쌍 분석이 필요하지 않은 간단한 외환 분석에도 신뢰할 수 있는 도구입니다. 모든 차트에서 매끄럽게 작동하며, 거래 결정을 향상시키기 위한 명확하고 실행 가능한 통찰력을 제공합니다. 1. IX Power가 트레이더에게 유용한 이유 다양한 시장 강도 분석 • IX Power 는 지수, 원자재, 암호화폐 및 외환 심볼의 강도를 계산하여 각 시장에 맞는 통찰력을 제공합니다. • US30, WTI, 금, 비트코인 또는 통화 쌍과 같은 자산을 모니터링하여 거래 기회를 발견
FX Dynamic MT5
Daniel Stein
5 (5)
FX Dynamic: 맞춤형 ATR 분석으로 변동성과 트렌드를 파악하세요 개요 FX Dynamic 는 Average True Range(ATR) 계산을 활용하여 트레이더에게 일간 및 일중 변동성에 대한 뛰어난 인사이트를 제공하는 강력한 도구입니다. 80%, 100%, 130%와 같은 명확한 변동성 임계값을 설정함으로써 시장이 평소 범위를 초과할 때 빠르게 경고를 받고, 유망한 수익 기회를 재빨리 식별할 수 있습니다. FX Dynamic 는 브로커의 시간대를 인식하거나 수동으로 조정할 수 있으며, 변동성 측정 기준을 일관되게 유지하며, MetaTrader 플랫폼과 완벽하게 연동되어 실시간 분석을 지원합니다. 1. FX Dynamic이 트레이더에게 매우 유용한 이유 실시간 ATR 인사이트 • 하루 및 일중 변동성을 한눈에 모니터링하세요. ATR의 80%, 100%, 130% 임계값이 도달 또는 초과되면, 시장의 중요한 지점에 있음을 알 수 있습니다. • 변동성이 완전히 폭발하기
Spike Detector XTREEM
Nervada Emeule Adams
5 (1)
Spike Detector XTREEM – Boom, Crash 및 Pain/Gain 시장을 위한 정밀 스파이크 감지 Spike Detector XTREEM은 빠르게 변하는 합성 지수 시장에 전문 수준의 스파이크 분석을 제공합니다. 모든 가격 변동에 반응하는 대신, 이 지표는 지능형 필터링을 통해 실제 스파이크 형성을 식별하여, 모멘텀이 중요한 순간에 자신 있게 거래에 진입할 수 있도록 합니다. 이 지표를 구매하면 Histogram Trend 지표를 무료 로 드립니다! 합성 지수 전용 단일 로직 Spike Detector XTREEM은 다음 시장의 고유한 특성에 맞게 특별히 설계되었습니다: Boom 및 Crash 지수 (모든 변형) Weltrade Pain & Gain 시장 이 지표는 심볼의 행동 패턴에 자동으로 적응하며, 시장의 노이즈를 걸러내고 통계적으로 유의미한 스파이크 형성만을 집중적으로 표시합니다. 수동 조정이 필요하지 않습니다. 신호 과부하 대신 스마트 필터링 모든 잠재
필터:
리뷰 없음
리뷰 답변