Predator Aurora Trading System

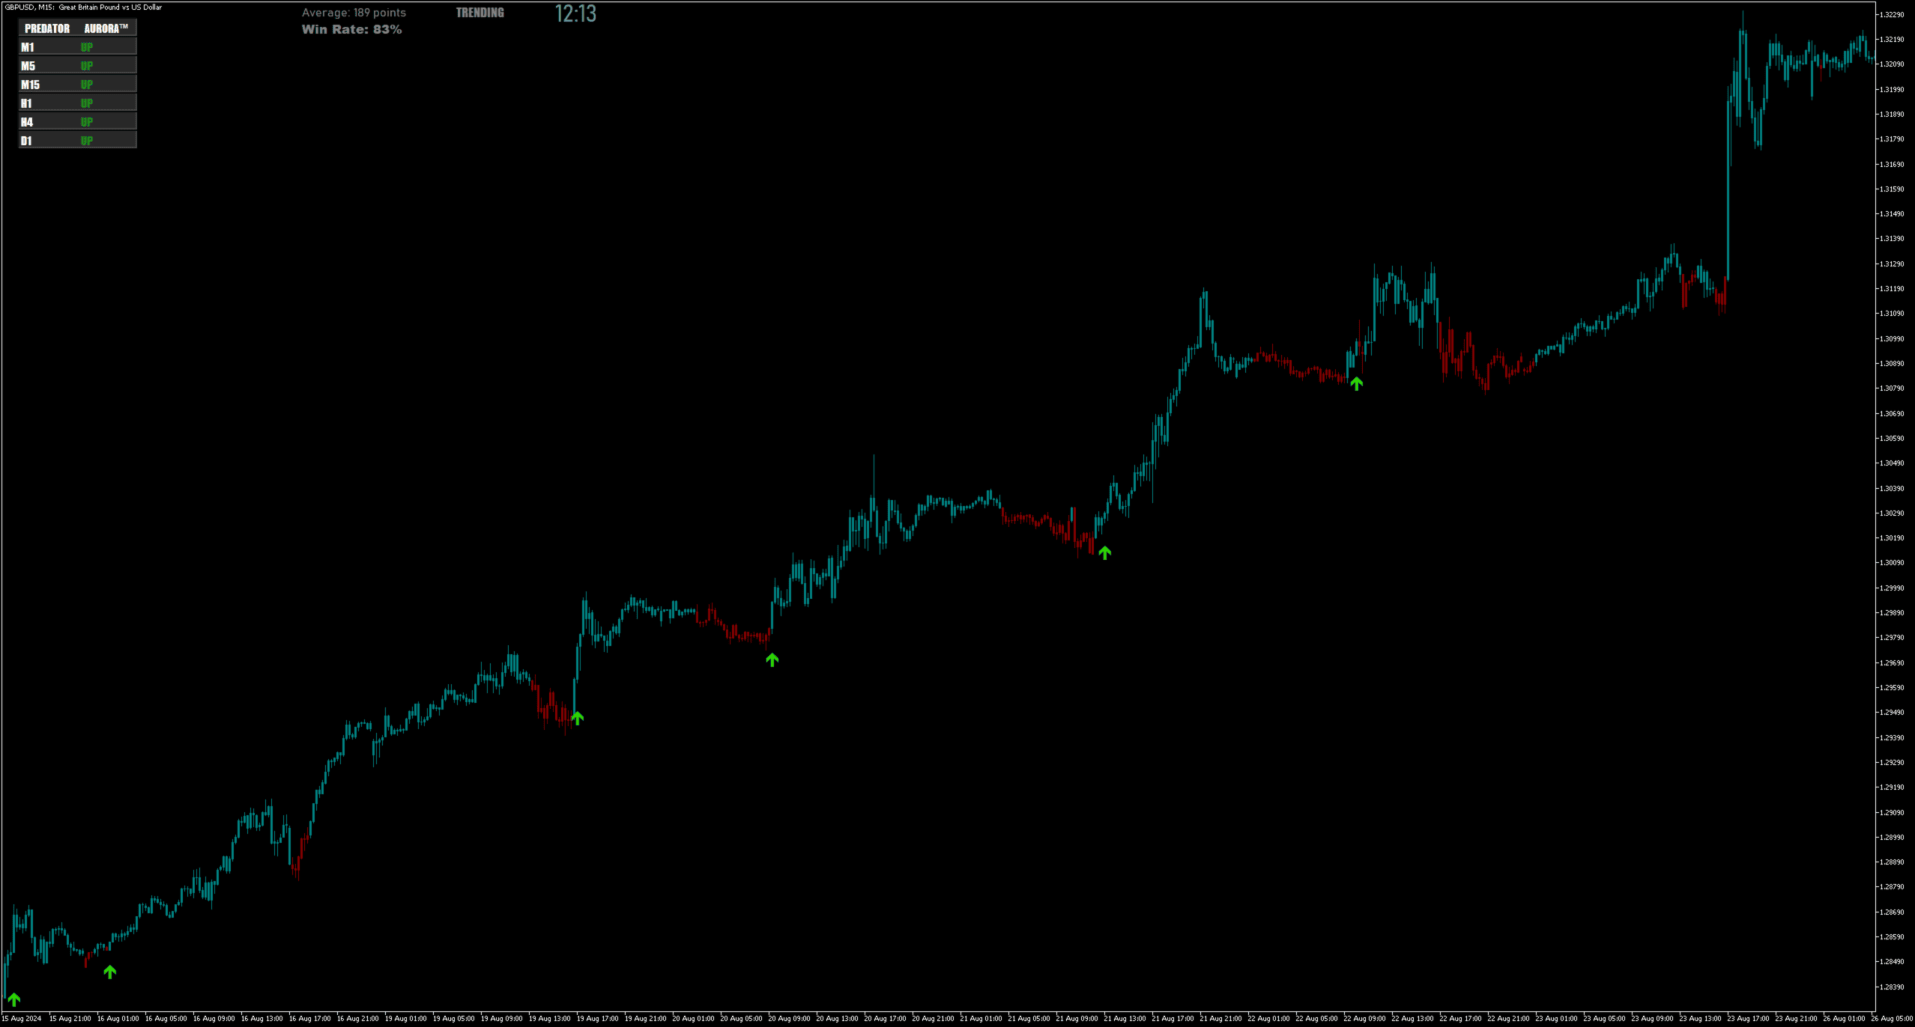
시장에 숨겨진 진정한 패턴을 발견하세요. PREDATOR AURORA™ 트레이딩 시스템과 함께 하세요 — 하이브리드 트레이딩 지표의 최종 보스. 다른 사람들이 보지 못하는 것을 보세요! PREDATOR AURORA™ 트레이딩 시스템은 평범함의 그림자에서 움츠러들기를 거부하는 사람들을 위해 설계된 강력한 도구입니다. 이것은 단순한 또 다른 지표가 아닙니다; 이것은 당신의 치트 코드입니다; 당신의 불공정한 이점이며, 시장의 움직임을 치명적인 정확도로 추적하는 정교한 하이브리드 헌팅 시스템입니다. 오직 가장 강한 자만이 생존하는 정글에서, 자연에서 가장 강력한 포식자에게 영감을 받은 PREDATOR AURORA™는 변화하는 시장 조건에 원활하게 적응하는 고급 적응 알고리즘을 사용합니다. 그림자 속에 숨어 있는 포식자처럼, 시장의 소음을 뚫고 다른 사람들이 결코 발견하지 못할 높은 확률의 거래 기회를 드러냅니다. 주요 특징:
  • 적응형 헌팅 메커니즘: 시장 변동성에 즉시 조정되어 무자비한 효율성으로 모든 거래 환경을 지배할 수 있게 합니다.
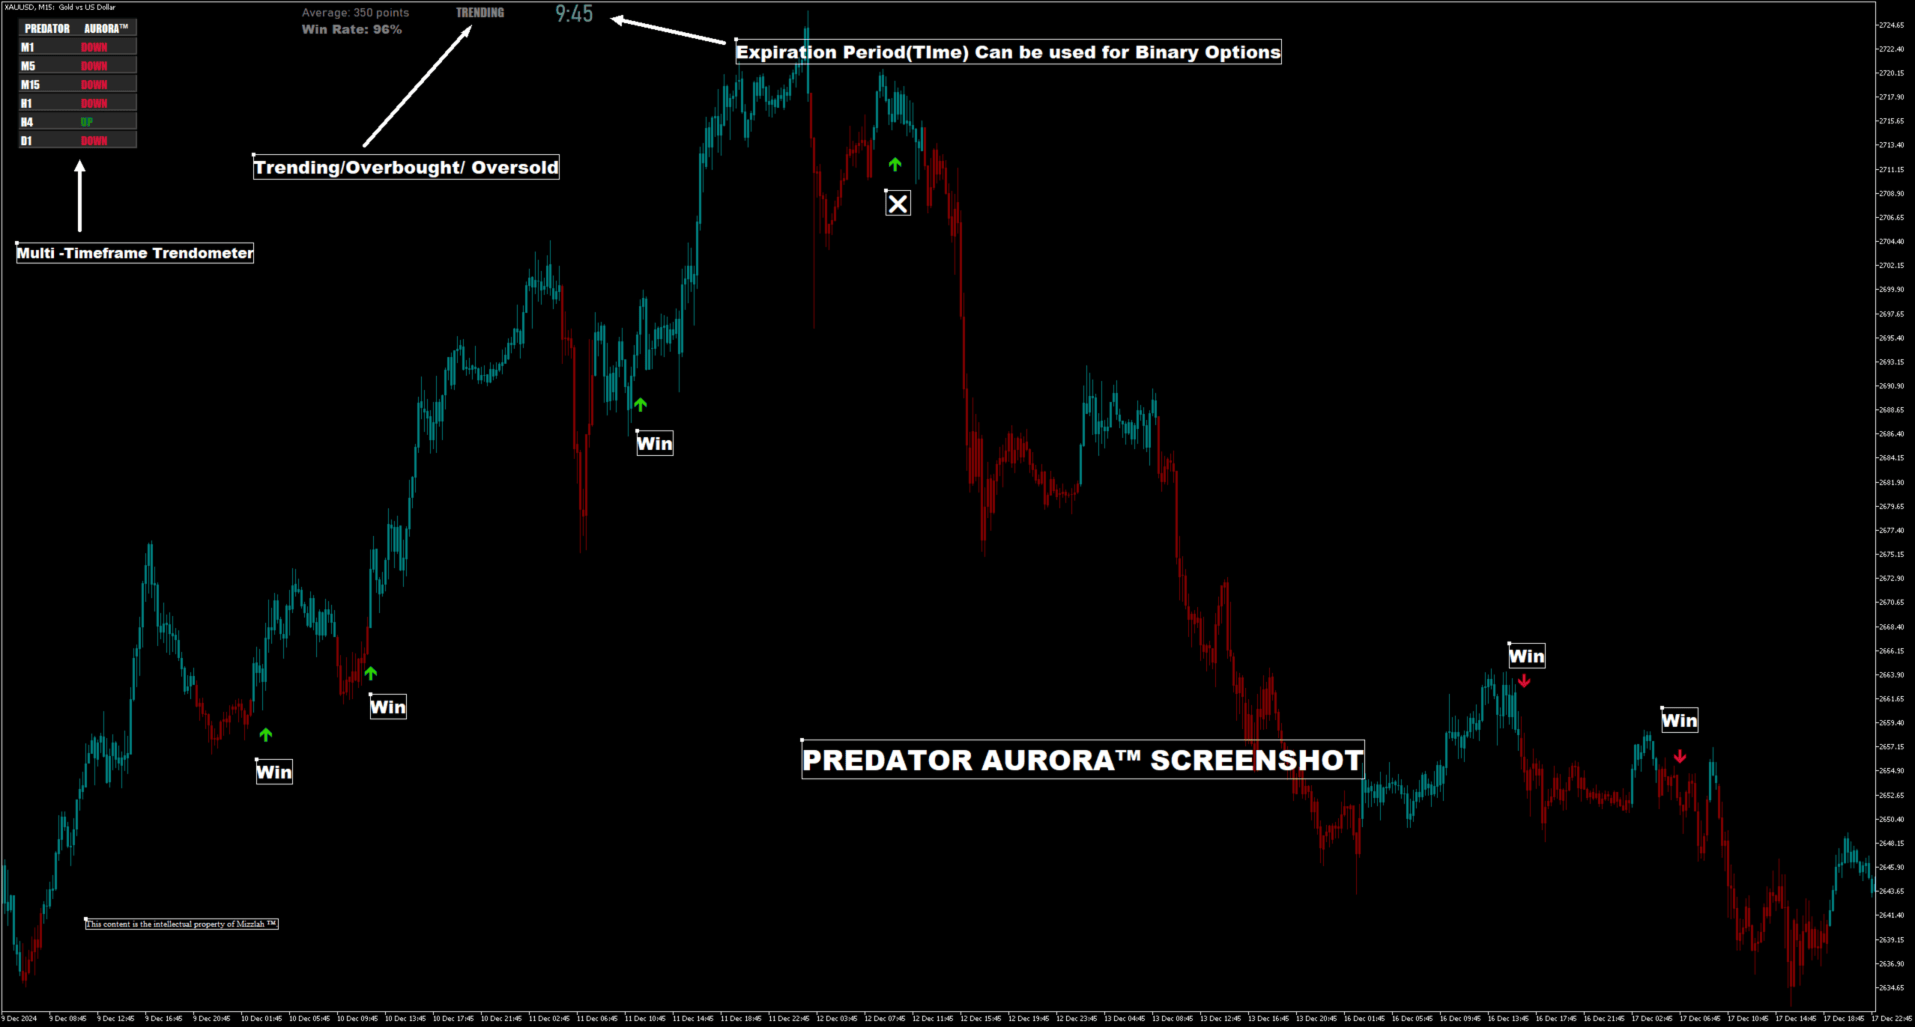
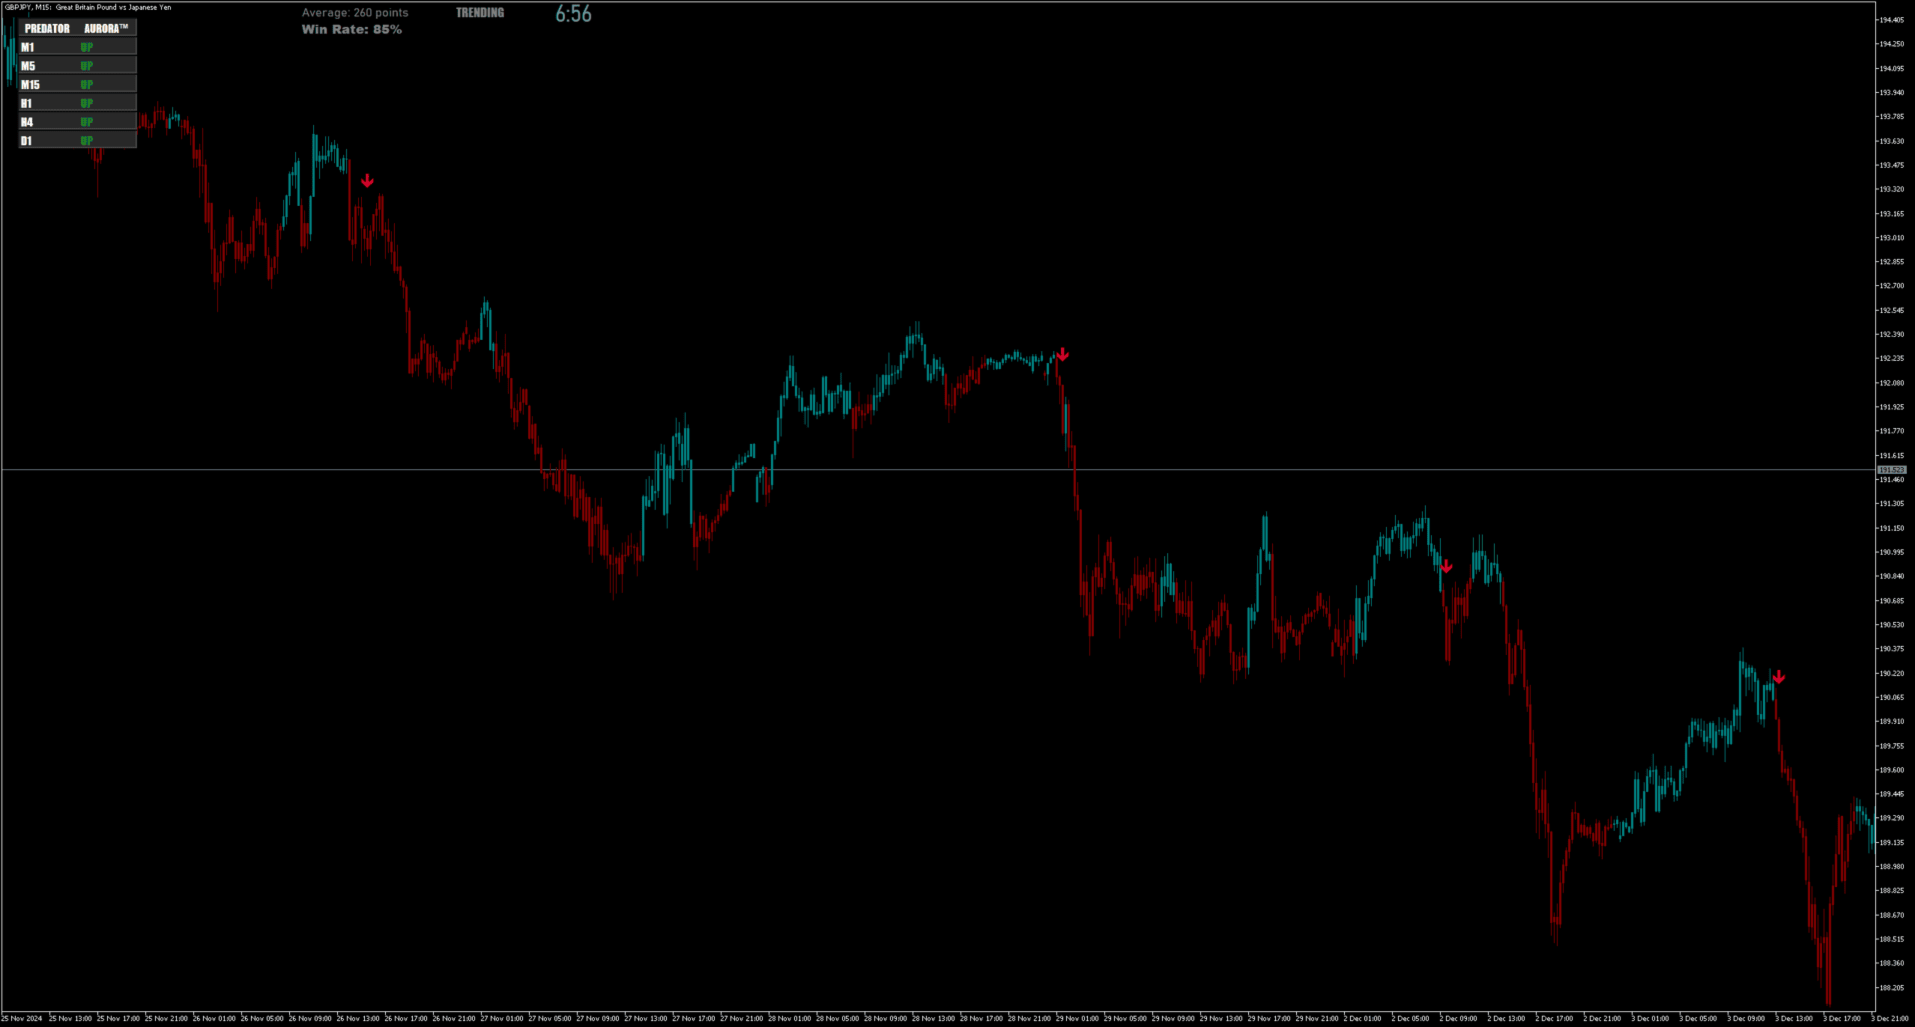
  • 다중 시간대 분석: 6개의 시간대(M1에서 D1까지)에 걸쳐 시장의 포괄적인 개요를 제공하여 일반적인 분석의 한계를 초월하는 통찰력을 제공합니다.
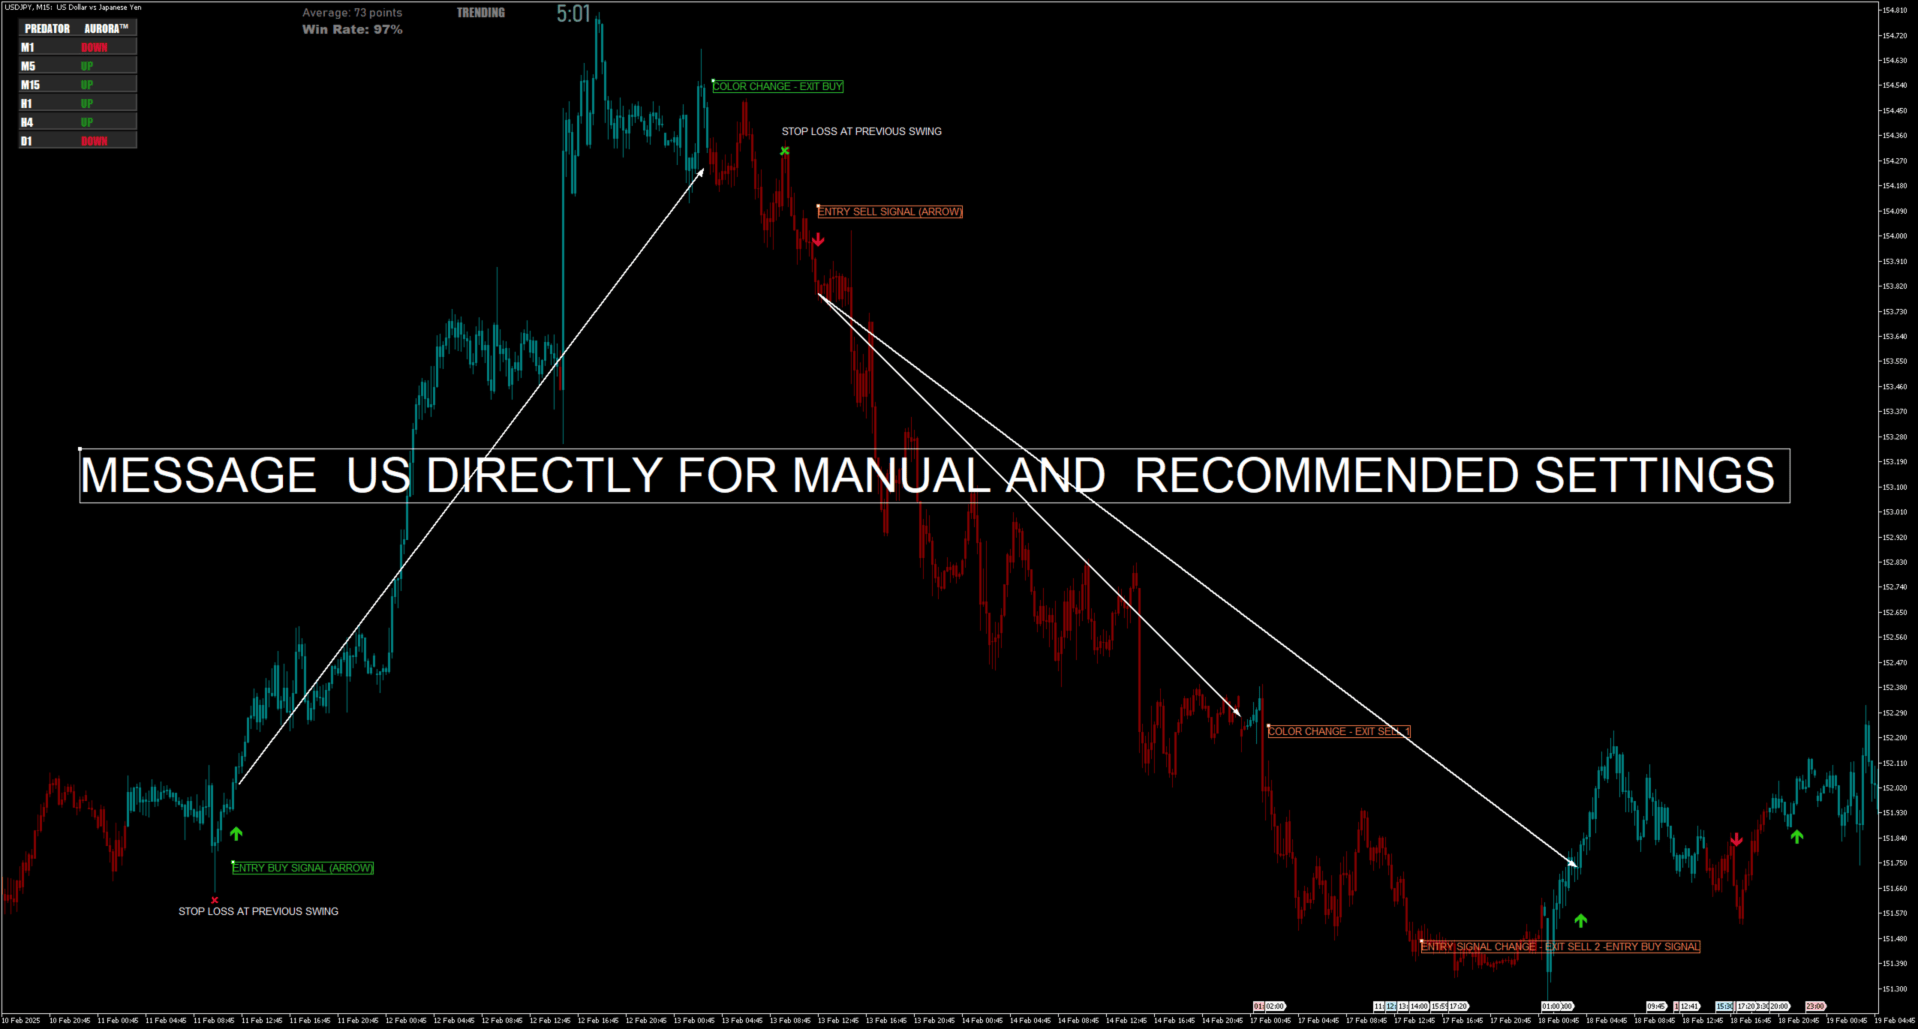
  • 동적 상태 인식: 직관적인 색상 코드 신호를 통해 실시간으로 시장 상태를 식별하고, 당신의 모든 움직임을 안내합니다.
  • 성과 추적 및 결과 시뮬레이션: 설정의 성공을 측정하고 예측하기 위한 내장 신호 추적 알고리즘이 있어 각 거래를 계산된 정복으로 변환합니다.
  • 변동성 기반 프리셋: 다양한 시장 조건에 맞춰 세심하게 설계된 세 가지 프리셋 중에서 선택하여 기회가 올 때 단호하게 행동할 수 있도록 합니다.
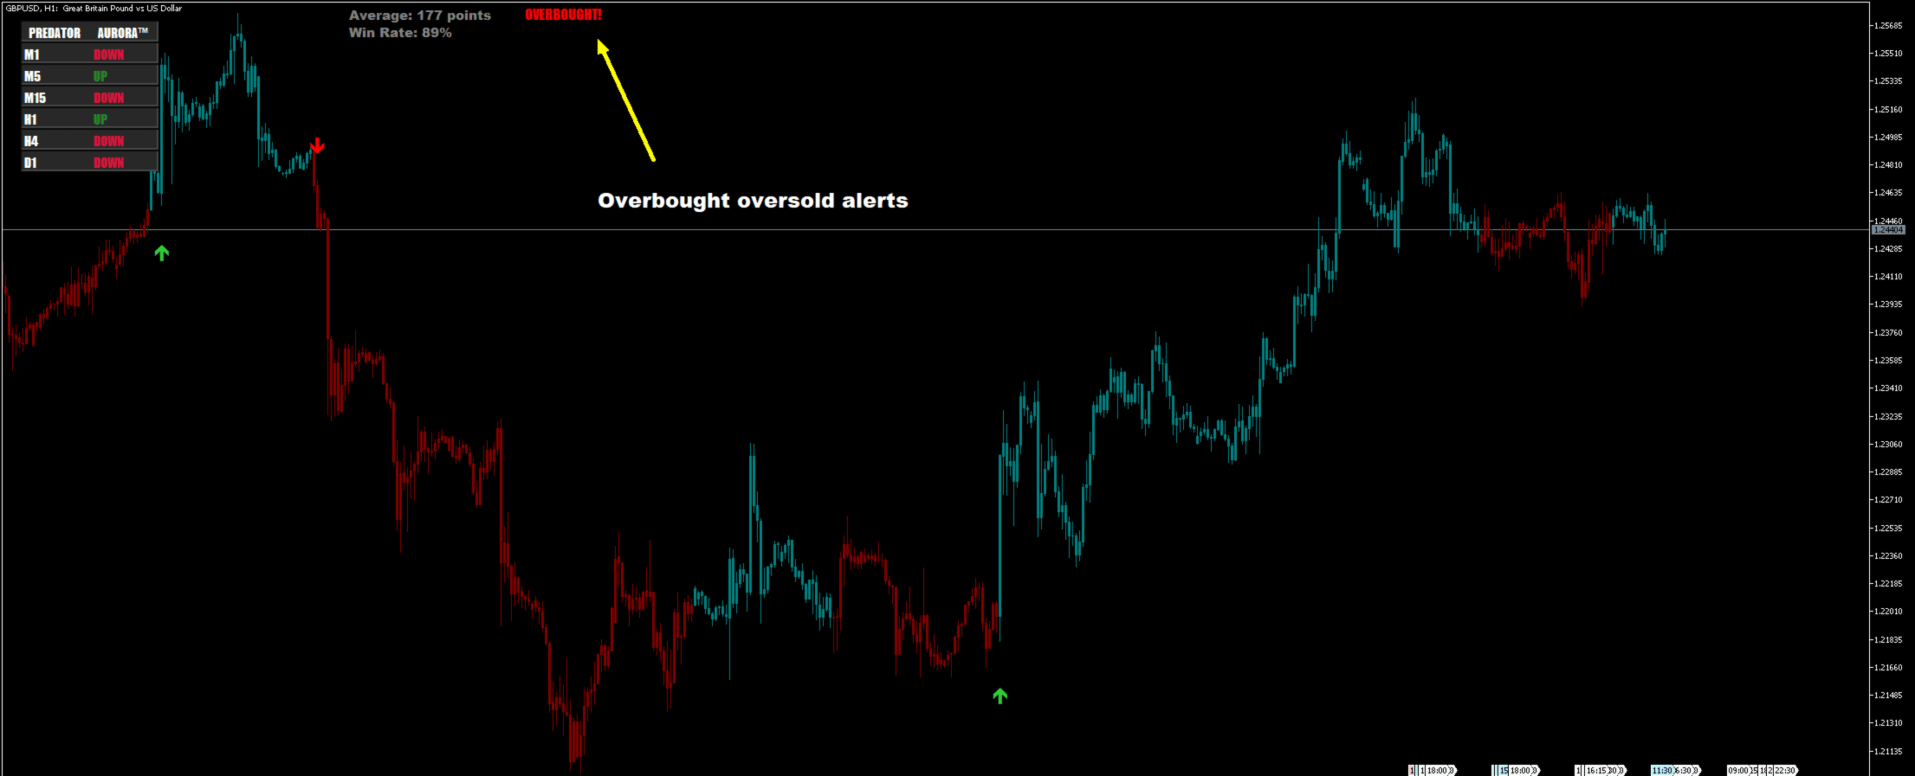
  • 신호 알림: 중요한 신호 및 시장 이벤트에 대한 푸시 알림을 휴대폰이나 태블릿 등으로 직접 받아볼 수 있어 항상 앞서 나가고 통제력을 유지할 수 있습니다.
  • 고급 시장 상태 감지: 군사급 정확도로 과매수 및 과매도 상태를 감지하여 기회가 사라지기 전에 빠르게 잡을 수 있도록 합니다.

 이 지표에 권장되는 시간 프레임: M5, M15, M30, H1, H4. 구매 후, 지침, 최적화된 설정 및 설명서를 보려면 저에게 직접 메시지를 보내주세요.

트렌드 추종 전략, 스마트 머니 개념(SMC), ICT 개념, 마스터 패턴 개념, 돌파 전략, 반전 전략, 와이코프 도식, 차트 패턴, 하모닉 패턴, 간 개념, 엘리엇 파동 개념, 주문 흐름 공급 수요, 바이너리 옵션 등 여러 기술과 호환됩니다. 혁신적인 AURORA™ 기술을 활용하여 이 시스템은 여러 독점 알고리즘을 통합하여 강력한 도구로 만들어지며, 트렌드 시장과 횡보 시장 모두에서 뛰어난 성능을 발휘합니다. 정교한 비 재표시 색상 코딩 시스템은 선명한 신호를 제공하여 확고한 자신감으로 거래를 실행할 수 있도록 합니다. 혼란스러운 1분 차트를 스캘핑하든 장기 포지션을 위해 함정을 설치하든 PREDATOR AURORA™는 당신의 독특한 거래 스타일에 완벽하게 적응합니다. 이것은 단순한 지표가 아닙니다; 금융 우위를 위한 끊임없는 전투에서 당신의 궁극적인 무기입니다. 전통적인 분석을 초월한 엘리트 트레이더들의 대열에 합류하고 PREDATOR AURORA™ SYSTEM과 함께 하이브리드 트레이딩의 미래로 대담하게 나아가세요! 오늘 당신의 무기를 업그레이드하여 우위를 강화하고 시장 함정을 피하세요 — 약점에는 여지를 남기지 마세요!


추천 제품
Godfather mt5
Ivan Simonika
The intelligent algorithm of the Godfather indicator accurately determines the trend, filters out market noise and generates entry and exit levels. The indicator will help in finding entry points when analyzing the price chart. The program first receives a "snapshot" of the graph, then analyzes it. The results are reported to the trader in the form of signals. The main purpose of this indicator is to determine the moments of entries and exits from transactions, so the indicator displays only th
Impulse fractals indicator - is counter-trend oriented complex market fractal pattern.  Market creates bull/bear impulse, trend starts, fractals on impulsed wave are an agressive pullback signals. Buy arrow is plotted when market is bearish and it's impulse showed up-side fractal, and sell arrow is plotted when market is bullish and it's impulse showed dn-side fractal. Main indicator's adjustable inputs : impulsePeriod - main period of impulse histogram  filterPeriod  - smoothes impulse accordi
Manyal trading system, CovEchoTrend Robot, focuses on reliability and flexibility. By employing statistical analysis methods to study the relationships between the base indicator and market patterns, the system enables a deeper understanding of market processes. Intelligent pattern analysis: The application of statistical data processing helps identify key trend reversal points more accurately, signaling significant market shifts. Informed decision-making is based on the intersection of indicato
Urgently mt5
Tatiana Savkevych
The Urgently indicator is designed to quickly determine the situation in the market, reflect the state of the market and signal profitable levels for opening trades. Market conditions change quickly enough, requiring constant calibration of trading strategies. Recommended for use in conjunction with any of the oscillators. The Urgently forex market trend indicator shows the trend direction and entry points. It smooths out price fluctuations when generating a signal by averaging the data and the
Stop Blowing Prop Firm Accounts. Start Trading With a Clear SOP. Your prop firm account keeps getting blown again and again? Still haven’t found an indicator or technique that delivers consistent profits and helps you pass challenge accounts ? Tired of repeating challenges and wishing you could finally get funded and start withdrawing? Don’t worry — I’m a real funded prop firm trader and full-time trader . This is the same entry-box indicator I personally use to get funded on large accounts, to
General Description In the simplest terms this is a contrarian intra-day scalping system. Built to try and let correct trades run as far as possible and flip the trade when indicated. The indicator looks at historical daily trading ranges to lay out levels at which it takes long and short positions based on the statistical levels. The indicator is built around index futures, mainly around S&P and the DOW but can be used an any futures contract mainly using AMP Futures to trade. The indicator is
Introduction This indicator detects volume spread patterns for buy and sell opportunity. The patterns include demand and supply patterns. You might use each pattern for trading. However, these patterns are best used to detect the demand zone (=accumulation area) and supply zone (=distribution area). Demand pattern indicates generally potential buying opportunity. Supply pattern indicates generally potential selling opportunity. These are the underlying patterns rather than direct price action. T
Full Description Overview Drawdown Controller Calculator Indicator is an advanced professional risk-management tool for MetaTrader 5 , specially designed for traders who use multiple running trades, pending orders, grid systems, and martingale strategies . This indicator allows you to see the future drawdown in advance — not only for currently running trades, but also for all pending orders combined , assuming they get triggered step by step. Instead of guessing or hoping, you will know ex
FREE
" Easy Trend Scalper MT5 " 지표는 추세 방향 내에서 스캘핑 거래를 위해 설계되었습니다. 표시기의 작동 원리. 이 지표는 시장이 어느 방향으로 움직이는지를 판단합니다. 빨간색 큰 화살표는 강세 방향을 나타냅니다. 파란색 큰 화살표 - 하락 방향을 나타냅니다. 강세 또는 약세 추세 내에서는 작은 화살표 형태로 스캘핑 신호를 생성하는 알고리즘이 있습니다. 주황색 화살표는 구매를 위한 신호입니다. 파란색 - 판매를 위한 신호입니다. 모든 거래 수단 및 모든 기간에서 사용할 수 있습니다. 추세 방향 변화와 진입 신호가 나타날 때 여러 유형의 알림을 제공합니다. 다시 그리지 않고도 작동하며 2~5개 캔들의 가격 방향을 예측할 수 있습니다. 화살표 형성 모드는 현재 캔들 또는 캔들 마감 시 수동으로 변경할 수 있습니다. 두 가지 경우에는 다음 캔들이 시작되어도 이전 캔들의 화살표는 다시 그려지지 않습니다. 원하는 도구에 맞게 구성해야 하는 매개변수도 수동으로 변경할
PipLabs  Engulfing   Market Shift PipLabs  Engulfing Market Shift is a beginner-friendly indicator designed to simplify market direction. It combines engulfing candle patterns market structure shifts, and smart filters (trend, momentum, and volatility) to highlight when buyers or sellers may be taking control. Instead of complex analysis, it delivers clear, plain-English guidance such as: Buy Bias Sell Bias Wait Perfect for novice and professional traders alike   looking for clarity, confidence
XFlow
Maxim Kuznetsov
XFlow shows an expanding price channel that helps determine the trend and the moments of its reversal. It is also used when accompanying transactions to set take profit/stop loss and averages. It has practically no parameters and is very easy to use - just specify an important moment in the history for you and the indicator will calculate the price channel. DISPLAYED LINES ROTATE - a thick solid line. The center of the general price rotation. The price makes wide cyclical movements around the
[ MT4 Version ]  [ Kill Zones ]  [ SMT Divergences ] How to trade using Order Blocks:  Click here User Interface Performance:  During testing in the strategy tester, the UI may experience lag. Rest assured, this issue is specific to the testing environment and does not affect the indicator's performance in live trading. Elevate your trading strategy with the  Order Blocks ICT Multi TF  indicator, a cutting-edge tool designed to enhance your trading decisions through advanced order block analysis
Antique Trend
Nadiya Mirosh
The Antique Trend Indicator is a revolutionary trend trading and filtering solution with all the important features of a trend tool built into one tool! The Antique Trend indicator is good for any trader, suitable for any trader both for Forex and binary options. There is no need to configure anything, everything has been perfected by time and experience, it works great during flats and trends. The Antique Trend indicator is a tool for technical analysis of financial markets, reflecting curren
This indicator is a zero-lag indicator and displays  strength of trend change . True Trend  Oscillator Pro works best in combination with True Trend Moving Average Pro that displays exact trend as is. Oscillator value is exact price change in given direction of the trend. True Trend Moving Average Pro: https://www.mql5.com/en/market/product/103586 If you set PERIOD input parameter to 1 this indicator becomes a sharpshooter for binary options. Developers can use True Trend Oscillator in Exper
FREE
Visual Range Directional Force Indicator
AL MOOSAWI ABDULLAH JAFFER BAQER
Range Directional Force Indicator – Designed for You to Optimize! The Range Directional Force Indicator is a cutting-edge tool designed to empower traders by visualizing market dynamics and directional strength. Built to offer insights into market trends and reversals, this indicator is an invaluable asset for traders seeking precision in their strategies. However, it is important to note that this indicator is not optimized, leaving room for you to tailor it to your unique trading preferences.
Chart Replay Indicator MT5 Overview Chart Replay Indicator is a chart replay and training tool for MetaTrader that allows users to replay historical market data bar by bar directly on the chart. It is designed for manual backtesting, strategy training, and market behavior analysis without relying on future price information. Candles are displayed progressively to reproduce the flow of historical data. This indicator does not provide trading signals and does not execute or manage trades. Key Feat
Scalping PullBack Signal
Quang Huy Quach
5 (1)
1. Overview The Scalping PullBack Signal indicator is a powerful technical analysis tool designed to help traders identify scalping opportunities based on potential pullback and reversal signals. This tool is particularly useful on lower timeframes (below 15 minutes) but can also be applied on higher timeframes for longer-term trades. This indicator integrates several key analytical components, providing a comprehensive view of trends and potential entry/exit points, helping you make quick and e
FREE
All 11 indicators quickly turn off and turn on quickly! Set of indicators: 2 indicators "TREND"   : - fast = line 4 colors - slow = dots 4 colors The coloring of the indicators depends on the direction of the trend and the RSI indicator: 1) uptrend and RSI<50% 2) uptrend and RSI>50% 3) downtrend RSI<50% 4) downtrend RSI   >   50% Set indicator periods for each timeframe: M5 M10 M15 M30 H1 H2 H4 H6 H12 D1 W1 MN Do not enter trades if at least 1 of the indicators is horizontal. For a trade,
Trader Panel Alpha X
Alvaro Garcia Batelli
Are you tired of the slow, clunky, and uninformative default order panel in MetaTrader 5? Discretionary trading demands speed, precision, and above all, clear information. Clicking through multiple menus, dragging stops one by one, and lacking a consolidated view of your risk are barriers that cost you time and, most importantly, money. Professional trading requires professional tools. Trader Panel Alpha X Pro is the definitive solution. It's not just another "order ticket"; it's a complete trad
FREE
Follow The Line MT5
Oliver Gideon Amofa Appiah
4.6 (35)
This indicator obeys the popular maxim that: "THE TREND IS YOUR FRIEND" It paints a GREEN line for BUY and also paints a RED line for SELL. (you can change the colors). It gives alarms and alerts of all kinds. IT DOES NOT REPAINT and can be used for all currency pairs and timeframes. Yes, as easy and simple as that. Even a newbie can use it to make great and reliable trades. NB: For best results, get my other premium indicators for more powerful and reliable signals. Get them here: https://www.m
FREE
CChart
Rong Bin Su
Overview In the fast-paced world of forex and financial markets, quick reactions and precise decision-making are crucial. However, the standard MetaTrader 5 terminal only supports a minimum of 1-minute charts, limiting traders' sensitivity to market fluctuations. To address this issue, we introduce the Second-Level Chart Candlestick Indicator , allowing you to effortlessly view and analyze market dynamics from 1 second to 30 seconds on a sub-chart. Key Features Support for Multiple Second-Level
Donchian Breakout And Rsi
Mattia Impicciatore
4.5 (2)
개요 이 지표는 클래식 돈치안 채널(Donchian Channel) 의 향상된 버전으로, 실전 트레이딩을 위한 다양한 기능이 추가되었습니다. 표준 세 개의 선(상단, 하단, 중앙선) 외에도 브레이크아웃 을 감지하여 차트에 화살표로 시각적으로 표시하며, 차트를 깔끔하게 보기 위해 현재 추세 방향의 반대 라인만 표시 합니다. 지표 기능: 시각적 신호 : 브레이크아웃 시 컬러 화살표 표시 자동 알림 : 팝업, 푸시 알림, 이메일 RSI 필터 : 시장의 상대 강도를 기반으로 신호 검증 사용자 맞춤 설정 : 색상, 선 두께, 화살표 코드, RSI 임계값 등 동작 원리 돈치안 채널은 다음을 계산합니다: 상단선 : 최근 N개의 종가 완료 캔들에서 가장 높은 고가 하단선 : 최근 N개의 종가 완료 캔들에서 가장 낮은 저가 중앙선 : 고가와 저가의 평균값 상방 브레이크아웃 은 종가가 상단선을 돌파할 때 발생하며, 하방 브레이크아웃 은 종가가 하단선 아래로 내려갈 때 발생합니다. 이 지표는: 세 개의
FREE
Shadow Pulse Indicator
Anastasia Danilova
Shadow Pulse 개요 Shadow Pulse는 평균 회귀 방법을 기반으로 반전 지점을 식별하는 전문 지표입니다. 지능형 다단계 필터링 시스템을 사용하여 매우 정확한 매수 및 매도 신호를 생성합니다. 거래 전략 이 지표는 M1부터 H4까지 모든 시간대에서 작동하도록 설계되었으며 금(XAUUSD) 스캘핑에서 뛰어난 결과를 보여줍니다. 낮은 기간의 공격적인 거래와 높은 시간대의 중기 포지션 모두에 효과적으로 적용할 수 있습니다. 가격 충격 소진 순간을 식별한 후 반등 시 포지션에 진입하는 원리로 작동합니다. 시스템은 주요 수준에 대한 가격 과도 확장의 임계 영역을 식별하고 반전 움직임을 확인할 때만 신호를 형성합니다. 화살표는 닫힌 바에만 나타나며 절대 다시 그려지지 않습니다. 이는 절대적인 신호 안정성을 보장하고 모든 기간에 걸쳐 지표의 과거 성과를 객관적으로 평가할 수 있게 합니다. • 바 아래의 파란색 화살표 — 롱 포지션 개시 신호(매수) • 바 위의 빨간색 화살표 — 숏
SPECIAL LAUNCH OFFER: $30 (1-Month Rent) Limited time offer to build our community and gather feedback! AmbM GOLD Institutional Scalper A high-precision M5 algorithm for XAUUSD (Gold) , engineered to trade exclusively at Institutional Liquidity Levels ($5/$10 psychological marks). PERFORMANCE DATA (BUY ONLY) • Win Rate: 87.09%. • Safe Growth: +$4,113 profit on $10k (13.75% Max Drawdown). • Extreme Stress Test: Successfully generated +$22,997 in a 5-year stress test (2020-2026), proving
MT5용 Crypto_Forex 지표 "HTF 이동평균 교차" - MT5용 강력한 HTF 이동평균 교차 지표로 거래 방식을 업그레이드하세요. HTF는 더 높은 시간대를 의미합니다. - 이 지표는 가격 변동이 있는 추세 트레이더에게 매우 유용합니다. - 더 높은 시간대의 빠르고 느린 이동평균을 현재 차트에 추가할 수 있습니다. 이는 전문적인 방법입니다. - HTF 이동평균 교차는 모바일 및 PC 알림 기능을 내장하고 있습니다. - 이 지표는 낮은 위험으로 상당한 수익을 얻을 수 있는 기회를 제공합니다. .......................................................................... 여기를 클릭하여 고품질 트레이딩 로봇과 지표를 확인하세요! 이 제품은 MQL5 웹사이트에서만 제공되는 오리지널 제품입니다.
BBTrend is a relatively new indicator developed by John Bollinger to work with Bollinger Bands. It is one of only a few indicators that can signal both strength and direction making it a very valuable tool for traders. Calculations The calculations are fairly simple. The default periods of 20 and 50 are shown, but these can be changed through the parameters. Lower = MathAbs(lowerBB(20) - lowerBB(50)) Upper = MathAbs(upperBB(20) - upperBB(50)) BBTrend = (lower - upper) / middleBB(20) Interpret
FREE
The ZigZag Buy Level is a specialized tool for traders who utilize market structure and classic ZigZag patterns to define key support and entry points. It automatically identifies "Main Highs"—significant highs confirmed by the subsequent price action—and then calculates a high-probability "Buy Level" based on a specified percentage pullback from that Main High to the last corrective low. This indicator helps you anticipate deep retracement entries, clearly marking them on the chart with labels
Orion Dynamic Keltner
Joao Paulo Botelho Silva
Theoretical Foundation   The Keltner Channels are channels ploted using volatility deviations above and bellow a moving average. The indicator is an excellent tool to help the trader build trend and mean-reversion strategies.   Parameters   The Orion Dynamic Keltner allows the user to select the Volatility Calculation Type, being ATR or Average Range (not considering price gaps). Also, the user can select the Calculation Period, Number of Deviations, Moving Average Mode and the Moving Average Ca
Caicai L&S Yield Histogram Important Notice: This indicator is an integral tool of the automated EA Caicai Long and Short Pair Trading . This indicator visually displays the percentage deviation (Yield %) of a pair's current spread relative to its own historical mean. It is an excellent tool for quickly visualizing the gross financial potential of a market distortion in Long & Short operations. Main Features: Percentage Visualization: Understand the size of the distortion in palpable percentage
WaveTrend Arrow LIGHT is a clean and lightweight WaveTrend-based arrow indicator for MetaTrader 5. This free version focuses purely on visual buy & sell arrows , generated from WaveTrend WT1 and WT2 crossings, without alerts or notifications. It is designed for traders who prefer a simple, non-repainting arrow indicator and for developers who want a stable signal source for EA integration . Features: Buy & Sell arrows based on WaveTrend crossing Non-repainting signals (closed bar option) Clean a
FREE
이 제품의 구매자들이 또한 구매함
ARIPoint
Temirlan Kdyrkhan
ARIPoint is a powerful trading companion designed to generate high-probability entry signals with dynamic TP/SL/DP levels based on volatility. Built-in performance tracking shows win/loss stats, PP1/PP2 hits, and success rates all updated live. Key Features: Buy/Sell signals with adaptive volatility bands Real-time TP/SL/DP levels based on ATR Built-in MA Filter with optional ATR/StdDev volatility Performance stats panel (Success, Profit/Loss, PP1/PP2) Alerts via popup, sound, push, or email Cu
Divergence Bomber
Ihor Otkydach
4.9 (87)
이 지표를 구매하신 분께는 다음과 같은 혜택이 무료로 제공됩니다: 각 거래를 자동으로 관리하고, 손절/익절 수준을 설정하며, 전략 규칙에 따라 거래를 종료하는 전용 도우미 툴 "Bomber Utility" 다양한 자산에 맞게 지표를 설정할 수 있는 셋업 파일(Set Files) "최소 위험", "균형 잡힌 위험", "관망 전략" 모드로 설정 가능한 Bomber Utility의 셋업 파일 이 전략을 빠르게 설치, 설정, 시작할 수 있도록 돕는 단계별 영상 매뉴얼 주의: 위의 모든 보너스를 받기 위해서는 MQL5 개인 메시지 시스템을 통해 판매자에게 연락해 주세요. 독창적인 커스텀 지표인 “Divergence Bomber(다이버전스 봄버)”를 소개합니다. 이 지표는 MACD 다이버전스(괴리) 전략을 기반으로 한 올인원(All-in-One) 거래 시스템입니다. 이 기술 지표의 주요 목적은 가격과 MACD 지표 간의 다이버전스를 감지하고, **향후 가격이 어느 방향으로 움직일지를 알려주는
Grabber System MT5
Ihor Otkydach
4.83 (23)
탁월한 기술적 지표인 Grabber를 소개합니다. 이 도구는 즉시 사용 가능한 “올인원(All-Inclusive)” 트레이딩 전략으로 작동합니다. 하나의 코드 안에 강력한 시장 기술 분석 도구, 매매 신호(화살표), 알림 기능, 푸시 알림이 통합되어 있습니다. 이 인디케이터를 구매하신 모든 분들께는 다음의 항목이 무료로 제공됩니다: Grabber 유틸리티: 오픈 포지션을 자동으로 관리하는 도구 단계별 영상 매뉴얼: 설치, 설정, 그리고 실제 거래 방법을 안내 맞춤형 세트 파일: 인디케이터를 빠르게 자동 설정하여 최고의 성과를 낼 수 있도록 도와줍니다 다른 전략은 이제 잊어버리세요! Grabber만이 여러분을 새로운 트레이딩의 정점으로 이끌어 줄 수 있습니다. Grabber 전략의 주요 특징: 거래 시간 프레임: M5부터 H4까지 거래 가능한 자산: 어떤 자산이든 사용 가능하지만, 제가 직접 테스트한 종목들을 추천드립니다 (GBPUSD, GBPCAD, GBPCHF, AUDCAD, AU
Quantum TrendPulse
Bogdan Ion Puscasu
5 (23)
SuperTrend   ,   RSI   ,   Stochastic   의 힘을 하나의 포괄적인 지표로 결합하여 트레이딩 잠재력을 극대화하는 궁극의 트레이딩 도구   인 Quantum TrendPulse를   소개합니다. 정밀성과 효율성을 추구하는 트레이더를 위해 설계된 이 지표는 시장 추세, 모멘텀 변화, 최적의 진입 및 종료 지점을 자신 있게 식별하는 데 도움이 됩니다. 주요 특징: SuperTrend 통합:   주요 시장 추세를 쉽게 따라가고 수익성의 물결을 타세요. RSI 정밀도:   매수 과다 및 매도 과다 수준을 감지하여 시장 반전 시점을 파악하는 데 적합하며 SuperTrend 필터로 사용 가능 확률적 정확도:   변동성이 큰 시장에서 숨겨진 기회를 찾기 위해 확률적 진동   을 활용하고 SuperTrend의 필터로 사용 다중 시간대 분석:   M5부터 H1 또는 H4까지 다양한 시간대에 걸쳐 시장을 최신 상태로 유지하세요. 맞춤형 알림:   맞춤형 거래 조건이 충족되면
Azimuth Pro
Ottaviano De Cicco
5 (7)
Azimuth Pro V2: Synthetic Fractal Structure and Confirmed Entries for MT5 Overview Azimuth Pro is a multi-level swing structure indicator by Merkava Labs . Four nested swing layers, swing-anchored VWAP, ABC pattern detection, three-timeframe structural filtering, and closed-bar confirmed entries — one chart, one workflow from micro-swings to macro-cycles. This is not a blind signal product. It is a structure-first workflow for traders who care about location, context, and timing. V2 Launch Offe
SignalTech MT5
Yue Wang
5 (4)
SignalTech MT5 is a trading system for EURUSD, USDCHF, USDJPY, AUDUSD, NZDUSD, EURJPY, AUDJPY, NZDJPY, CADJPY H2 and H3 Timeframe.  It can generate signals with Buy/Sell Arrows and Pop-Up/Sound Alerts. Each signal has clear Entry and Stop Loss levels, which should be automatically flagged on the chart, as well as potential Targets 1, 2, and 3. The Entry and TP levels are fixed after the trade is taken. The exit level is dynamic. If there are signs of a potential short-term trend reversal, the
Meravith MT5
Ivan Stefanov
5 (1)
마켓 메이커를 위한 도구. Meravith는 다음과 같은 기능을 제공합니다: 모든 타임프레임을 분석하고 현재 유효한 추세를 표시합니다. 강세와 약세 거래량이 동일한 유동성 구간(거래량 균형 구간)을 강조 표시합니다. 서로 다른 타임프레임의 모든 유동성 레벨을 차트에 직접 표시합니다. 텍스트 기반 시장 분석을 생성하여 참고용으로 제공합니다. 현재 추세를 기반으로 목표가, 지지선 및 손절가를 계산합니다. 거래의 위험 대비 보상 비율(Risk/Reward)을 계산합니다. 계좌 잔고에 따라 포지션 크기를 산출하고 잠재 수익을 추정합니다. 시장에 중대한 변화가 발생할 경우 경고도 제공합니다. 지표의 주요 라인: 강세/약세 거래량 소진 라인 — 목표가로 사용됩니다. 시장 추세를 나타내는 라인. 시장이 강세인지 약세인지에 따라 색상이 변경되며 추세 지지선 역할을 합니다. 색상은 주로 시장 심리를 보여줍니다. 거래량 균형선(Eq). Eq(Volume Equilibrium) 라인은 시스템의 핵심입니
Bill Williams Advanced
Siarhei Vashchylka
5 (11)
Bill Williams Advanced is designed for automatic chart analysis using Bill Williams' "Profitunity" system. The indicator analyzes four timeframes at once. Manual (Be sure to read before purchasing) Advantages 1. Analyzes the chart using Bill Williams' "Profitunity" system. Signals are displayed in a table in the corner of the screen and on the price chart. 2. Finds all known AO and AC signals, as well as zone signals. Equipped with a trend filter based on the Alligator. 3. Finds "Divergence Bar
Entry Points Pro for MT5
Yury Orlov
4.48 (138)
다시 색을 칠하지 않고 거래에 진입할 수 있는 정확한 신호를 제공하는 MT5용 지표입니다. 외환, 암호화폐, 금속, 주식, 지수 등 모든 금융 자산에 적용할 수 있습니다. 매우 정확한 추정값을 제공하고 매수와 매도의 가장 좋은 시점을 알려줍니다. 하나의 시그널로 수익을 내는 지표의 예와 함께 비디오 (6:22)시청하십시오! 대부분의 거래자는 Entry Points Pro 지표의 도움으로 첫 거래 주 동안 트레이딩 결과를 개선합니다. 저희의   Telegram Group 을 구독하세요! Entry Points Pro 지표의 좋은점. 재도색이 없는 진입 신호 신호가 나타나고 확인되면(시그널 캔들이 완성된 경우) 신호는 더 이상 사라지지 않습니다. 여타 보조지표의 경우 신호를 표시한 다음 제거되기 때문에 큰 재정적 손실로 이어집니다. 오류 없는 거래 게시 알고리즘을 통해 트레이드(진입 또는 청산)를 할 이상적인 순간을 찾을 수 있으며, 이를 통해 이를 사용하는 모든 거래자의 성공률이
소개       Quantum Breakout PRO   , 브레이크아웃 존 거래 방식을 변화시키는 획기적인 MQL5 지표! 13년 이상의 거래 경험을 가진 숙련된 트레이더 팀이 개발한       퀀텀 브레이크아웃 PRO       혁신적이고 역동적인 브레이크아웃 존 전략으로 거래 여정을 새로운 차원으로 끌어올리도록 설계되었습니다. Quantum Breakout Indicator는 5개의 이익 목표 영역이 있는 브레이크아웃 영역의 신호 화살표와 브레이크아웃 상자를 기반으로 한 손절 제안을 제공합니다. 초보자 거래자와 전문 거래자 모두에게 적합합니다. Quantum EA 채널:       여기를 클릭하세요 중요한! 구매 후 설치 매뉴얼을 받으려면 개인 메시지를 보내주십시오. 추천: 기간: M15 통화쌍: GBPJPY, EURJPY, USDJPY,NZDUSD, XAUUSD 계정 유형: 스프레드가 매우 낮은 ECN, Raw 또는 Razor 브로커 시간: GMT +3 중개인 :
Btmm state engine pro
Garry James Goodchild
5 (4)
BTMM State Engine Pro is a MetaTrader 5 indicator for traders who use the Beat The Market Maker approach: Asian session context, kill zone timing, level progression, peak formation detection, and a multi-pair scanner from a single chart. It combines cycle state logic with a built-in scanner dashboard so you do not need the same tool on many charts at once. What it does Draws the Asian session range; session times can follow broker server offset or be set in inputs. Tracks level progression (L
OmniSync Projection
Antonio-alin Teculescu
5 (1)
Chronos Fractal Engine is an innovative price projection indicator for MetaTrader 5, designed to transform your technical analysis by intelligently identifying and projecting historical price patterns. Built upon an advanced correlation algorithm and the fractal principles of the market, this powerful tool visualizes potential future price movements, giving you a unique edge in your trading decisions. What is Chronos Fractal Engine? At its core, the Chronos Fractal Engine employs a sophisticat
Berma Bands
Muhammad Elbermawi
5 (8)
Berma Bands(BBs) 지표는 시장 동향을 파악하고 이를 활용하려는 트레이더에게 귀중한 도구입니다. 가격과 BBs 간의 관계를 분석함으로써 트레이더는 시장이 추세 단계인지 범위 단계인지를 분별할 수 있습니다. 자세한 내용을 알아보려면 [ Berma Home Blog ]를 방문하세요. 버마 밴드는 세 개의 뚜렷한 선으로 구성되어 있습니다. 어퍼 버마 밴드, 미들 버마 밴드, 로어 버마 밴드입니다. 이 선들은 가격 주위에 그려져 전체 추세에 대한 가격 움직임을 시각적으로 표현합니다. 이 밴드들 사이의 거리는 변동성과 잠재적인 추세 반전에 대한 통찰력을 제공할 수 있습니다. 버마 밴드 라인이 각각에서 분리될 때, 그것은 종종 시장이 횡보 또는 범위 이동 기간에 접어들고 있음을 시사합니다. 이는 명확한 방향 편향이 없음을 나타냅니다. 트레이더는 이러한 기간 동안 추세를 파악하기 어려울 수 있으며 더 명확한 추세가 나타날 때까지 기다릴 수 있습니다. 버마 밴드 라인이 단일 라인으로
" Dynamic Scalper System MT5 " 지표는 추세 파동 내에서 스캘핑 방식으로 거래하도록 설계되었습니다. 주요 통화쌍 및 금에서 테스트되었으며, 다른 거래 상품과의 호환성이 가능합니다. 추가적인 가격 변동 지원을 통해 추세에 따라 단기 포지션 진입 신호를 제공합니다. 지표의 원리 큰 화살표는 추세 방향을 결정합니다. 작은 화살표 형태의 스캘핑 신호를 생성하는 알고리즘은 추세 파동 내에서 작동합니다. 빨간색 화살표는 상승 방향을, 파란색 화살표는 하락 방향을 나타냅니다. 민감한 가격 변동선은 추세 방향으로 그려지며, 작은 화살표의 신호와 함께 작용합니다. 신호는 다음과 같이 작동합니다. 적절한 시점에 선이 나타나면 진입 신호가 형성되고, 선이 있는 동안 미결제 포지션을 유지하며, 완료되면 거래를 종료합니다. 권장되는 작업 시간대는 M1~H4입니다. 화살표는 현재 캔들에 형성되며, 다음 캔들이 이미 시작되었더라도 이전 캔들의 화살표는 다시 그려지지 않습니다. 입
ON Trade Gann Squares MT5
Abdullah Alrai
5 (2)
간 스퀘어 지표는 W.D. 간이 쓴 "시장 예측을 위한 수학적 공식" 기사에 기반한 강력한 시장 분석 도구입니다. 이 도구는 수학적 개념과 간 이론을 사용하여 정확한 시장 분석을 수행합니다. 144, 90, 52의 제곱과 9의 제곱을 사용합니다. 또한 의 9의 제곱근 및 해당 제곱의 채널 및 스타 패턴과의 관련성을 통합합니다. 사용자 메뉴얼 및 적용: 이 지표를 사용하기 전에 사용자 메뉴얼을 읽고 질문이 있을 경우 문의하시기 바랍니다. 전체 메뉴얼은 웹사이트에서 제공됩니다. MT5의 전체 버전을 구매하거나 MT4의 무료 버전을 테스트할 수 있습니다. 두 버전 모두 링크에서 확인하실 수 있습니다. 주요 기능 및 기능: 간 스퀘어 지표는 정확한 결정을 위해 기하학적 개념과 간 이론을 활용하는 시장 분석을 위한 포괄적인 도구 집합을 제공합니다. 주요 기능은 다음과 같습니다. 9의 제곱 분석:   이 지표는 9의 제곱에 대한 수평 선, 스타 패턴, 그리드 및 간 팬을 그릴 수 있습니다. 간
Cvd Divergence
Thalles Nascimento De Carvalho
CVD Divergence – 전문적인 주문 흐름 및 다이버전스 분석 CVD Divergence는 가격과 Cumulative Delta Volume(CVD) 사이의 신뢰할 수 있는 다이버전스를 감지하기 위해 개발된 기술적 지표입니다. 실제 주문 흐름이 가격 움직임을 확인하지 않을 때를 정확하게 포착하여, 잠재적 추세 전환, 매수·매도 세력의 소진, 기관의 시장 조작 가능성을 보여줍니다. 이 지표는 공격적인 거래량 분석과 가격 구조 해석을 결합해 명확하고 객관적이며 빠른 신호를 제공합니다. 지표 기능 CVD Divergence는 누적 델타 거래량을 사용하여 주문 흐름의 방향과 가격 방향을 비교합니다. 두 값이 크게 괴리될 경우 차트에 시각적 표시를 남기고 다이버전스 방향을 명확하게 보여줍니다. 다음과 같은 상황을 감지합니다: 강세 다이버전스 (가격이 하락하지만 CVD가 상승할 때) 약세 다이버전스 (가격이 상승하지만 CVD가 하락할 때) 매수·매도 세력의 힘 고갈 기관 주문 불균형으로
Presenting one-of-a-kind Gann Indicator for XAUUSD IQ Gold Gann Levels is a non-repainting, precision tool designed exclusively for XAUUSD/Gold intraday trading. It uses W.D. Gann’s square root method to plot real-time support and resistance levels, helping traders spot high-probability entries with confidence and clarity. William Delbert Gann (W.D. Gann) was an exceptional market analyst whose trading technique was based on a complex blend of mathematics, geometry, astrology, and ancient calcul
RelicusRoad Pro MT5
Relicus LLC
5 (24)
RelicusRoad Pro: 퀀트 시장 운영 체제 70% 할인 평생 이용권 (한정 시간) - 2,000명 이상의 트레이더와 함께하세요 왜 대부분의 트레이더는 "완벽한" 지표를 가지고도 실패할까요? 진공 상태에서 단일 개념 만으로 거래하기 때문입니다. 문맥 없는 신호는 도박입니다. 지속적인 승리를 위해서는 컨플루언스(중첩) 가 필요합니다. RelicusRoad Pro는 단순한 화살표 지표가 아닙니다. 완전한 퀀트 시장 생태계 입니다. 독점적인 변동성 모델링을 사용하여 가격이 이동하는 "공정 가치 로드"를 매핑하고, 단순 노이즈와 실제 구조적 돌파를 구분합니다. 추측은 그만두세요. 기관급 로드 로직으로 거래를 시작하세요. 핵심 엔진: "Road" 알고리즘 시스템의 중심에는 시장 상황에 실시간으로 적응하는 동적 변동성 채널인 Road Algo 가 있습니다. 세이프 라인(평형) 과 가격이 수학적으로 반전될 가능성이 높은 확장 레벨 을 투영합니다. Simple Road: 일반적인 시장을 위
우선적으로, 이 거래 도구는 전문적인 거래에 이상적인 비-다시 그리기 및 지연되지 않는 지표입니다.  온라인 강좌, 사용자 매뉴얼 및 데모. 스마트 가격 액션 컨셉트 인디케이터는 신규 및 경험 많은 트레이더 모두에게 매우 강력한 도구입니다. Inner Circle Trader Analysis 및 Smart Money Concepts Trading Strategies와 같은 고급 거래 아이디어를 결합하여 20가지 이상의 유용한 지표를 하나로 결합합니다. 이 인디케이터는 스마트 머니 컨셉트에 중점을 두어 대형 기관의 거래 방식을 제공하고 이동을 예측하는 데 도움을 줍니다.  특히 유동성 분석에 뛰어나 기관이 어떻게 거래하는지 이해하는 데 도움을 줍니다. 시장 트렌드를 예측하고 가격 변동을 신중하게 분석하는 데 탁월합니다. 귀하의 거래를 기관 전략에 맞추어 시장의 동향에 대해 더 정확한 예측을 할 수 있습니다. 이 인디케이터는 시장 구조를 분석하고 중요한 주문 블록을 식별하고 다양
CGE Trading Suite
Carl Gustav Johan Ekstrom
5 (2)
Institutional-Grade Analytics for MT5 C GE Trading Suite delivers the analytical edge typically reserved for professional trading desks. The platform integrates a full suite of analytical tools into one seamless workflow: dynamic grid mapping, liquidity behavior analysis, ECM, trend lines, MIDAS, trade cycles, and directional channel projections. Together, these provide a unified view of market structure and momentum. Directional clarity is further enhanced by the capital flow index, which meas
AriX
Temirlan Kdyrkhan
1 (4)
AriX Indicator for MT5 A powerful trend-following and signal-evaluation tool AriX is a custom MT5 indicator that combines Moving Averages and ATR-based risk/reward logic to generate clear buy/sell signals. It visualizes dynamic SL/TP levels, evaluates past trade outcomes, and displays win/loss statistics in a clean on-chart panel. Key features include: Buy/Sell signals based on MA crossovers ATR-based SL/TP1/TP2/TP3 levels with visual lines and labels Signal outcome tracking with real-time stat
Premium level Pro
Dmitriy Kashevich
Premium level is a unique indicator with more than 80% accuracy of correct predictions! This indicator has been tested for more than two months by the best Trading Specialists! The author's indicator you will not find anywhere else! From the screenshots you can see for yourself the accuracy of this tool! 1 is great for trading binary options with an expiration time of 1 candle. 2 works on all currency pairs, stocks, commodities, cryptocurrencies Instructions: As soon as the red arrow app
IVISTscalp5
Vadym Zhukovskyi
5 (6)
iVISTscalp5 — 시간 기반 시장 예측 시스템 iVISTscalp5는 일반적인 지표가 아닙니다. MetaTrader 5용 시간 기반 예측 시스템으로, 시장이 언제 움직일 가능성이 높은지를 보여줍니다. ⸻ 기능  • 정확한 타이밍  • BUY / SELL 신호  • 평균 수익 잠재력  • 주간 예측  • 120개 이상의 자산 ⸻ 핵심 개념 시장은 가격뿐만 아니라 시간에 의해 움직인다 ⸻ iVISTscalp5 — 시간에서의 우위 당신에게 소개하는 iVISTscalp5 지표는 독특하면서도 거래 작업에서 효과적입니다. 이 지표는 시간 데이터를 기반으로 하며 금융 시장의 많은 경험과 깊은 분석의 결과입니다. iVISTscalp5 지표는 수동 거래에 뛰어난 도구입니다. 편리성, 간단함 및 시각화 - 모든 복잡성은 숨겨져 있습니다. 우리는 iVISTscalp5 지표의 설정과 사용을 최대한 단순화했습니다. 이 지표는 MT5 터미널에서 가지고 있는 모든 금융 상품에 적합
Stop guessing the market. Start trading mathematical probabilities with Machine Learning. The Titan NPC Pro (Neural Probability Channel) is not just another moving average or standard deviation band. It is a highly advanced institutional-grade indicator powered by a Kernel Regression Engine . By utilizing a Rational Quadratic Kernel function, the algorithm calculates the true "Fair Value" of the asset and plots dynamic probability boundaries to pinpoint exact Mean Reversion (Overbought/Oversold)
ICT PO3 (Power of 3) AMD Protocol Framework Indicator True Time & Structure Integration   |  Non-Repainting | Real-Time  | Multi-Asset  | MT4 Version Available Full Setup Guide & Strategy Playbook: https://www.mql5.com/en/blogs/post/768683 MT4 Version: https://www.mql5.com/en/market/product/171742 Indicator Overview The ICT PO3 AMD Protocol Framework is a complete structural overlay for MetaTrader 5 that maps the True Daily Cycle directly onto your lower-timeframe execution chart. It projects
Ultimate SMC Indicator
Hicham Mahmoud Almoustafa
1 (1)
Ultimate SMC Indicator v2.20 — Smart Money Concepts All-in-One Stop switching between 5 different indicators. Ultimate SMC gives you everything Smart Money traders need — in one clean indicator with interactive controls. GUIDE What makes this different? Most SMC indicators show you Order Blocks or FVGs separately. You still have to figure out which zones actually matter. Ultimate SMC does the hard work: it scans for Order Blocks, Fair Value Gaps, Liquidity Sweeps, Supply & Demand zones, Fibo
Ziva LSE System
Hassan Abdullah Hassan Al Balushi
ZIVA LSE System A Professional Liquidity & Structure Execution Framework Executive Overview ZIVA LSE System is a professionally engineered analytical framework designed to interpret market behavior through structural logic and liquidity dynamics. It is not positioned as a conventional indicator. Rather, it functions as a structured execution environment that organizes price action into a clear, disciplined decision-making model. The system is built to deliver consistency, clarity, and controlled
Easy SMC Trading
Israr Hussain Shah
3 (2)
자동 위험 관리 및 구조 돌파 스캐너를 포함한 구조 추세 분석 버전: 1.0 개요 자동 위험 관리 기능을 갖춘 구조 추세 분석은 가격 움직임과 시장 구조에 의존하는 트레이더를 위해 설계된 종합적인 트레이딩 시스템입니다. 부드러운 추세 필터와 스윙 포인트 감지, 구조 돌파(BOS) 신호를 결합하여 높은 확률의 거래 설정을 생성합니다. 이 도구의 가장 두드러진 특징은 자동 위험 관리 기능입니다. 유효한 구조 돌파가 감지되면 지표는 즉시 위험/보상 영역(1:1, 1:2, 1:3)을 계산하고 표시하며, 가격이 목표에 도달할 때 거래 시각화를 자동으로 관리합니다. 수동으로 차트를 그릴 필요가 없어 트레이더는 실행에만 집중할 수 있습니다. 주요 기능 동적 구조 돌파(BOS) 감지 스윙 고점(HH/LH)과 스윙 저점(HL/LL)을 자동으로 식별합니다. 가격이 주요 구조적 레벨을 돌파할 때 차트에 BOS 라인을 직접 표시하여 추세 방향을 확인합니다. 구조적 핵심 지점을 명확한 텍스트
TPA True Price Action indicator reveals the true price action of the market makers through 100% non-repainting signals strictly at the close of a candle! TPA shows entries and re-entries, every time the bulls are definitely stronger than the bears and vice versa. Not to confuse with red/green candles. The shift of power gets confirmed at the earliest stage and is ONE exit strategy of several. There are available now two free parts of the TPA User Guide for our customers. The first "The Basics"
Omniview ICT Dashboard
Kayode Michael Oyetunde
구조화된 시장 관점으로 거래하기 OmniView ICT 대시보드는 하나의 인터페이스에서 여러 종목을 모니터링할 수 있도록 설계된 멀티 심볼 시장 스캐너입니다. 여러 차트를 전환하는 대신, Market Watch의 종목을 스캔하여 현재 시장 상황을 구조화된 형태로 제공합니다. 개요 여러 종목 동시 스캔 정의된 조건 기반의 순위 표시 원클릭 차트 동기화 시장 분석 정리에 도움 스코어링 시스템 각 설정은 가격 구조, 모멘텀, 유동성 움직임에 기반한 내부 조건으로 평가됩니다. 85% – 100% → 여러 조건의 강한 일치 70% – 84% → 명확한 방향성과 확인 60% – 69% → 유효한 구조, 추가 확인 필요 가능 60% 미만 → 아직 형성 중인 조건 이 점수 시스템은 다양한 시장 상황을 비교하는 데 사용됩니다. 분석 모델 이 대시보드는 Smart Money 개념을 기반으로 시장 데이터를 처리하며 다음 요소를 포함합니다: 시장 구조 변화 Fair Value Gap 유동성 스윕 프리미엄
제작자의 제품 더 보기
Predator Expansion Contraction Candles 지표로 시장 역학의 비밀을 해방하고 거래를 혁신하세요: 시장의 비밀 언어를 해독하고 가격 움직임의 흐름과 역류를 놀라운 정확도로 예측할 수 있는 능력을 상상해 보세요. Predator Expansion Contraction Candles 지표에 오신 것을 환영합니다. 이 혁신적인 도구는 시장 확장 및 수축 단계에 대한 беспрецедент한 통찰력을 제공하여 거래를 새로운 높이로 끌어올립니다. 거래 전략의 전체 잠재력을 해방하세요 이 최첨단 지표는 단순한 도구가 아닙니다. 다양한 전략과 호환되며, 다음과 같은 것들을 포함합니다: 브레이크아웃 전략 : 레이저 같은 정확도로 중요한 브레이크아웃 지점을 식별하여 항상 곡선 앞서 나아가게 합니다. 트렌드 추종 전략 : 시장 트렌드와 일치하도록 확장 및 수축의 명확한 신호를 사용하여 이익을 최대화합니다. 스마트 머니 개념 : 스마트 머니의 흐름과 거래를 일치시켜 기관
수요 공급 볼륨 존 — 기관급 지지/저항 및 매수·매도 압력 표시 Supply Demand Volume 는 가격 구조, 거래량 분석 및 실시간 변동성을 기반으로 주요 수요 및 공급 구역을 자동으로 탐지하는 정밀한 도구입니다. 정확한 지지/저항 레벨, 수급 흐름, Wyckoff 이론 또는 스마트 머니 개념을 사용하는 트레이더를 위해 설계되었으며, 매수/매도 세력 비교 및 잠재적 반전 신호를 시각적으로 제공합니다. 주요 기능: 자동 존 탐지 – 과거 고점/저점 및 ATR(평균 진폭)을 기반으로 주요 기관 거래 구역을 감지합니다.   매수/매도 볼륨 분석 – 실시간으로 매수/매도 세력의 강도를 시각화하여 방향성을 확인합니다.   중간선 및 가격 라벨 – 컬러와 가격 마커가 포함된 중간선 제공.   시간 기반 확장 – 구역이 자동으로 미래까지 확장되어 지속적으로 유효하게 유지됩니다. 추천 대상: 반전 트레이더 돌파 트레이더 볼륨 및 프라이스 액션 기반 트레이더 스캘핑 및 인트라데
기능 설명 매일 수십억을 움직이는 동일한 기관 핵심 레벨을 사냥합니다. 세 개의 독점 알고리즘이 실제 시장 구조를 해독하여 소매 거래자들이 무엇에 맞았는지도 모르기 전에 고확률 킬존을 노출시킵니다. 시각적 요소 녹색 히스토그램 : 기관 매수 압력 감지 빨간색 히스토그램 : 스마트 머니 분배 진행 중 신호선 : 녹색 = 강세 거래량, 빨간색 = 매도세 참여 주요 매개변수 룩백 기간 : 14 (기관 기억 범위) 돌파 임계값 : 0.6 (헤어 트리거 민감도) 거래량 가중치 : 다크 풀 감지 신호 해석 0.6 이상 또는 -0.6 이하 : 기관 돌파 0.8 이상 또는 -0.8 이하 : 강한 모멘텀 구역 신호선 색상 변화 : 파워 구조 플립 감지 히스토그램 + 신호 수렴 : 고확률 트렌드 확인 전략 기관 주문흐름 패턴의 역공학. 소매 거래자들이 지연 지표로 허둥거리는 동안 마켓메이커의 속임수를 꿰뚫어 봅니다. 망설이는 매 분마다 기관 주머니로 흘러가는 이익입니다. 사냥꾼이 되세요, 먹이가 되지
Korean (한국어) PREDATOR DAILY LEVELS 소프트웨어: Predator Daily Levels는 MT5 차트에 일일 High, Low, Open (HLO) 선을 자동으로 그려 수동 레벨 표시를 대체하여 효율적인 거래를 지원합니다. 여러 날 이전을 "Monday High" 같은 설명 라벨, 색상 코딩 선(진홍색 고점, 숲녹색 저점, 연산호색 시가), 사용자 지정 너비, 스타일, 폰트 크기로 표시합니다. 새 바와 차트 변경 시 자동 업데이트로 모든 심볼과 타임프레임에서 실시간 정밀도 보장. ​ 주요 기능 자동 HLO 선: 전일 고점(PDH), 저점(PDL), 시가 수준을 2일 앞으로 연장하여 지지/저항 및 브레이크아웃 구역 식별에 이상적. 완전 사용자 지정: 색상, 선 스타일(실선/점선), 너비 최대 3px, 라벨 표시, 폰트 크기(기본 20pt), 과거 일수(최대 20일) 등을 모든 설정에 맞춤. 평생 지원: 구매자 코드 수정 가능, 모든 시장에서 비재도장 성능
Daily Levels Plotter
Evans Asuma Metobo
Korean (한국어) PREDATOR DAILY LEVELS 소프트웨어: Predator Daily Levels는 MT5 차트에 일일 High, Low, Open (HLO) 선을 자동으로 그려 수동 레벨 표시를 대체하여 효율적인 거래를 지원합니다. 여러 날 이전을 "Monday High" 같은 설명 라벨, 색상 코딩 선(진홍색 고점, 숲녹색 저점, 연산호색 시가), 사용자 지정 너비, 스타일, 폰트 크기로 표시합니다. 새 바와 차트 변경 시 자동 업데이트로 모든 심볼과 타임프레임에서 실시간 정밀도 보장. ​ 주요 기능 자동 HLO 선: 전일 고점(PDH), 저점(PDL), 시가 수준을 2일 앞으로 연장하여 지지/저항 및 브레이크아웃 구역 식별에 이상적. 완전 사용자 지정: 색상, 선 스타일(실선/점선), 너비 최대 3px, 라벨 표시, 폰트 크기(기본 20pt), 과거 일수(최대 20일) 등을 모든 설정에 맞춤. 평생 지원: 구매자 코드 수정 가능, 모든 시장에서 비재도장 성능
Predator Order Flow 시스템 — 제품 설명 및 매뉴얼 제품 설명 Predator Order Flow 시스템은 MetaTrader 5용 전문가급 orderflow 인디케이터로, 시장에서 기관 자금의 활성 위치를 시각화합니다. 거래량 분석, 델타 프로파일링, 오더북 깊이를 단일 차트 오버레이로 결합하여 각 가격 수준의 매수/매도 압력을 명확히 보여줍니다 — Bookmap 등 플랫폼에서 기관 트레이더가 사용하는 통찰과 동일합니다. 실시간 거래와 전략 백테스팅에 최적화되어 실행 환경에 따라 업데이트 동작을 자동 조정합니다. 주요 기능: Volume Profile — 가격 수준별 누적 매수/매도 거래량 히트맵, POC (Point of Control)로 최고 활성 가격 표시 Delta Profile — 오른쪽 패널에서 각 가격 수준의 순 매수/매도 압력 차이 표시 Time Delta Profile — 하단 패널에서 바별 델타 모멘텀 표시 (스무딩으로 깔끔한 신호) Volume
필터:
리뷰 없음
리뷰 답변