Royal Fractals Indicator
- 지표
-
Irina Cherkashina
 I have been actively trading, including with the help of my own expert advisors, on financial markets since April 2012. In addition to trading with my own money, I work as a technical analyst in a mutual fund. In my free time, I like to go to live music concerts, travel, and hang out with friends.
 - 버전: 1.0
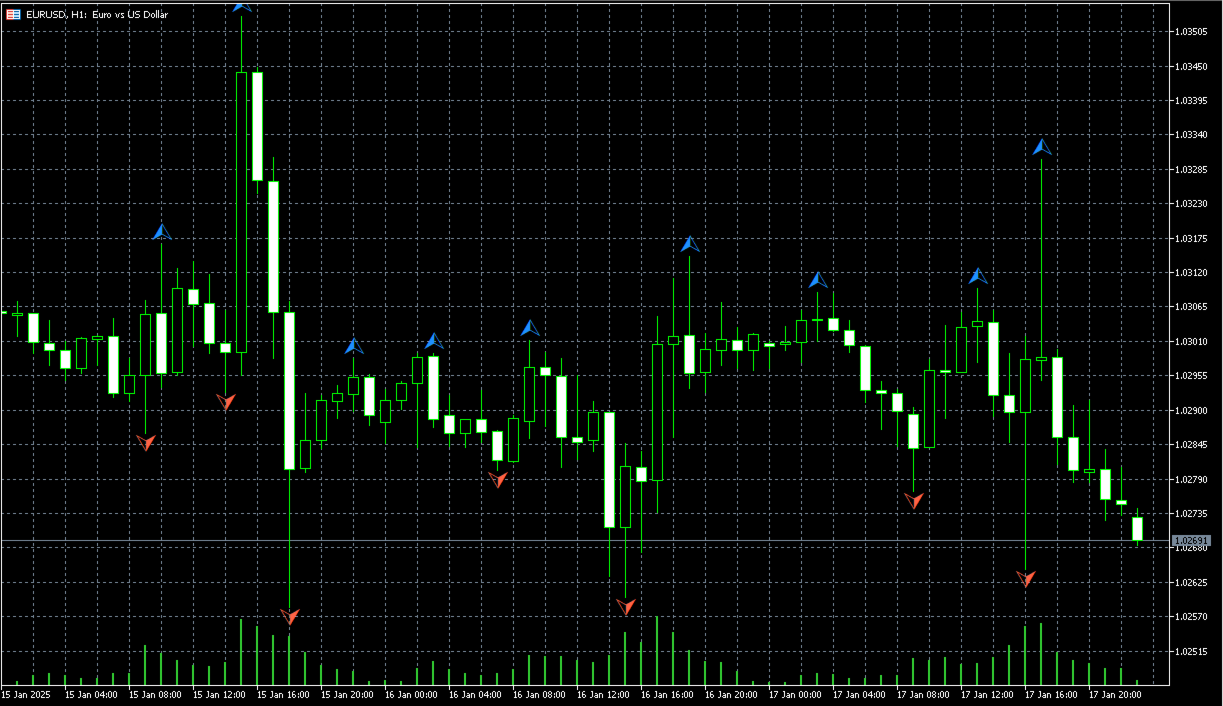
This indicator works by plotting fractals on the chart as arrows that can be used as buy or sell signals. It is a great tool for both new and experienced traders as it provides a clear visual representation of the market and helps traders identify fractals. Although it repaints, it can be used quite effectively in conjunction with other tools to filter trading strategies.
We use this indicator in this way in our Royal Fractals EA, which you can purchase on the MQL5 Market:
https://www.mql5.com/en/market/product/130545?source=Site+Market+MT5+New+Rating006