Bollinger Bands Stop Indicator

5

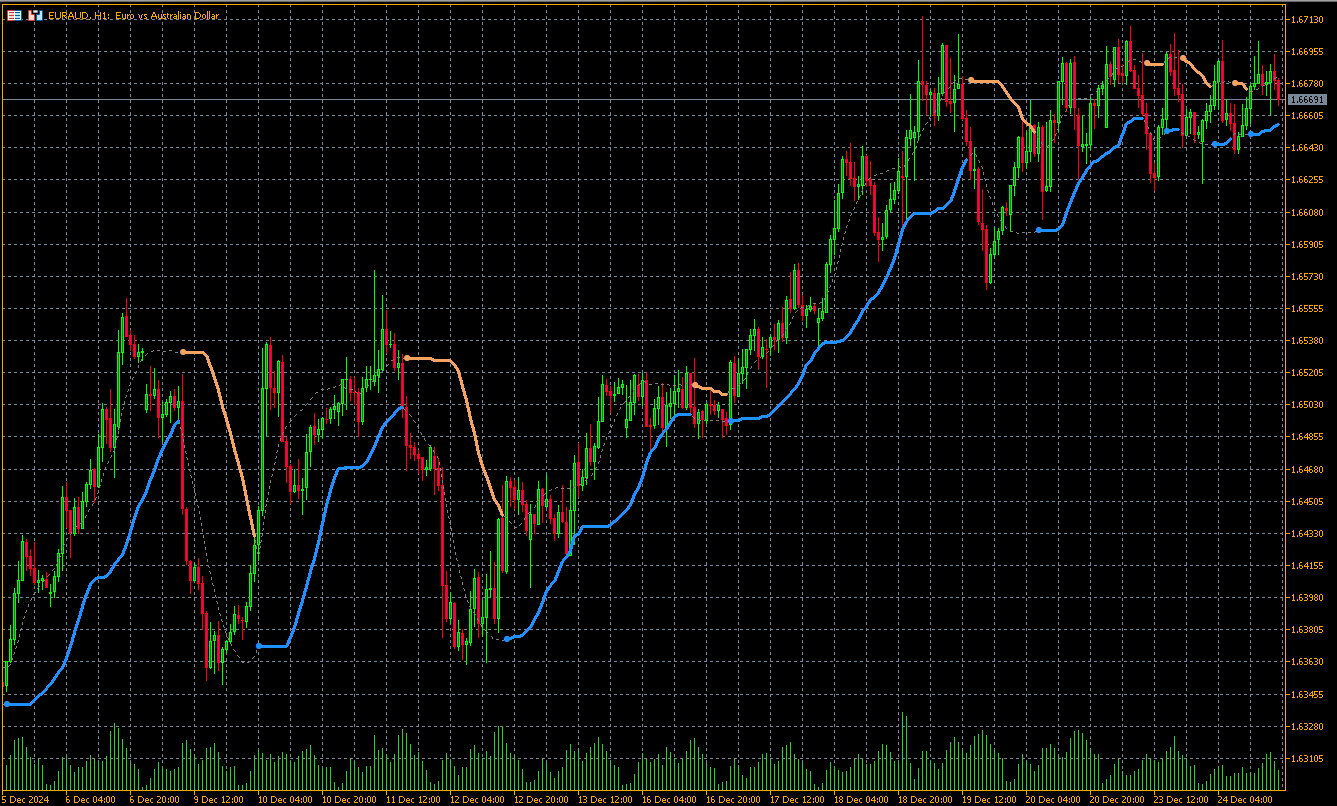
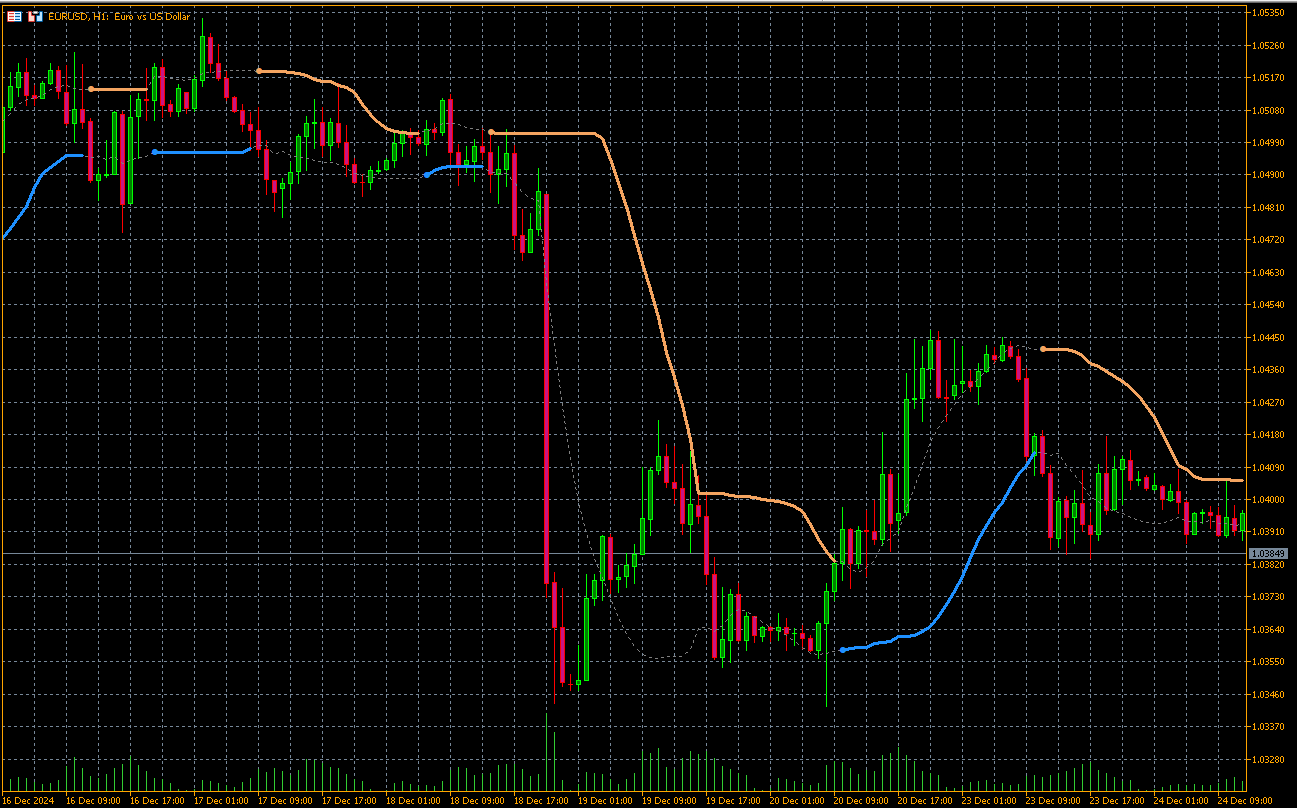
Bollinger Bands Stop Indicator holds significant importance for traders navigating the complex world of financial markets. Its relevance lies in several key aspects. Firstly, it aids in trend identification. By analyzing price movements relative to the Bollinger Bands, traders can discern whether the market is in an uptrend, downtrend, or ranging phase. Secondly, the indicator provides valuable insights into market volatility. Wider bands indicate higher volatility, while narrower bands suggest calmer market conditions. Lastly, the Bollinger Bands Stop Indicator serve as dynamic stop-loss levels, adjusting as the price moves. This adaptability enhances risk management and helps traders protect their capital.

We use this indicator in our Expert Advisor Bollinger Bands Trigger, which you can purchase in the MQL5 market:

https://www.mql5.com/en/market/product/129073?source=Site+Market+MT5+New+Rating006


How Does it Work?
Bollinger Bands Stop Indicator calculates the upper and lower bands based on the standard deviation of price data. These bands dynamically adjust as market conditions change. When the price touches or crosses these bands, it provides potential trading signals. Essentially, the indicator combines the concepts of Bollinger Bands with stop-loss functionality, making it a versatile tool for traders.

How to Understand?
Buy Signal: Look for a bullish crossover, where the price moves above the upper band. This suggests a potential long-trade opportunity.

Sell Signal: A bearish crossover occurs when the price falls below the lower band. Consider shorting the asset in this scenario.

How to Trade Using this Indicator?
Trend Following: Trade in the direction of the trend. Buy when the price is above the upper band during an uptrend, and sell when it’s below the lower band during a downtrend.

Reversals: Watch for price reversals near the bands. A bounce off the upper band could signal a potential short trade, while a bounce off the lower band may indicate a long opportunity.

How to Trade with Bollinger Bands Stop Indicator Indicator

Buy Entry
Look for a bullish signal, such as the price crossing above the upper Bollinger Bands Stop band.
Confirm the buy entry by checking if the overall trend is upward.
Set a stop-loss just below the lower Bollinger Bands Stop Indicator band to limit potential losses.

Consider taking profits at a predefined target level (e.g., a recent swing high or a fixed percentage gain).

Sell Entry
Identify a bearish signal, such as the price crossing below the lower Bollinger Bands Stop band.
Ensure that the broader trend is downward for better confirmation.
Place a stop-loss just above the upper BB stop band to manage risk.

Take profits at a predetermined level (e.g., a recent swing low or a fixed percentage decline).

Conclusion
Bollinger Bands Stop Indicator is a versatile tool that aids traders in trend identification, risk management, and decision-making. However, it’s crucial to combine it with other indicators and consider the market context. Whether you’re a novice or an experienced trader, understanding the Bollinger Bands Stops can enhance your trading strategy and improve overall performance.


리뷰 2
Findolin
1940
Findolin 2025.01.13 18:10 
 

Very good indicator. Thank you very much!

jihwan lim
28
jihwan lim 2025.02.07 06:43 
 

지표가 좋아요 감사 합니다

추천 제품
개요 이 지표는 클래식 돈치안 채널(Donchian Channel) 의 향상된 버전으로, 실전 트레이딩을 위한 다양한 기능이 추가되었습니다. 표준 세 개의 선(상단, 하단, 중앙선) 외에도 브레이크아웃 을 감지하여 차트에 화살표로 시각적으로 표시하며, 차트를 깔끔하게 보기 위해 현재 추세 방향의 반대 라인만 표시 합니다. 지표 기능: 시각적 신호 : 브레이크아웃 시 컬러 화살표 표시 자동 알림 : 팝업, 푸시 알림, 이메일 RSI 필터 : 시장의 상대 강도를 기반으로 신호 검증 사용자 맞춤 설정 : 색상, 선 두께, 화살표 코드, RSI 임계값 등 동작 원리 돈치안 채널은 다음을 계산합니다: 상단선 : 최근 N개의 종가 완료 캔들에서 가장 높은 고가 하단선 : 최근 N개의 종가 완료 캔들에서 가장 낮은 저가 중앙선 : 고가와 저가의 평균값 상방 브레이크아웃 은 종가가 상단선을 돌파할 때 발생하며, 하방 브레이크아웃 은 종가가 하단선 아래로 내려갈 때 발생합니다. 이 지표는: 세 개의
FREE
Value Chart Candlesticks
Flavio Javier Jarabeck
4.69 (13)
The idea of a Value Chart indicator was presented in the very good book I read back in 2020 , " Dynamic Trading Indicators: Winning with Value Charts and Price Action Profile ", from the authors Mark Helweg and David Stendahl. The idea is simple and the result is pure genius: Present candlestick Price analysis in a detrended way! HOW TO READ THIS INDICATOR Look for Overbought and Oversold levels. Of course, you will need to test the settings a lot to find the "correct" one for your approach. It
FREE
Free automatic Fibonacci is an indicator that automatically plots a Fibonacci retracement based on the number of bars you select on the BarsToScan setting in the indicator. The Fibonacci is automatically updated in real time as new highest and lowest values appears amongst the selected bars. You can select which level values to be displayed in the indicator settings. You can also select the color of the levels thus enabling the trader to be able to attach the indicator several times with differe
FREE
FlatBreakout MT5
Aleksei Vorontsov
FlatBreakout MT5 (Free Version) Flat Range Detector and Breakout Panel for MT5 — GBPUSD Only FlatBreakout MT5   is the free version of the professional FlatBreakoutPro MT5 indicator, specially designed for flat (range) detection and breakout signals on the   GBPUSD   pair only. Perfect for traders who want to experience the unique fractal logic of FlatBreakout MT5 and test breakout signals on a live market without limitations. Who Is This Product For? For traders who prefer to trade breakout of
FREE
Statistical Arbitrage Spread Generator for Cointegration [MT5] What is Pair Trading? Pair trading is a market-neutral strategy that looks to exploit the relative price movement between two correlated assets — instead of betting on the direction of the market. The idea? When two assets that usually move together diverge beyond a statistically significant threshold, one is likely mispriced. You sell the expensive one, buy the cheap one , and profit when they converge again. It’s a statistica
FREE
Girassol Sunflower MT5 Indicator
Saullo De Oliveira Pacheco
4.33 (6)
This is the famous Sunflower indicator for Metatrader5. This indicator marks possible tops and bottoms on price charts. The indicator identifies tops and bottoms in the asset's price history, keep in mind that the current sunflower of the last candle repaints, as it is not possible to identify a top until the market reverses and it is also not possible to identify a bottom without the market stop falling and start rising. If you are looking for a professional programmer for Metatrader5, please
FREE
Follow The Line MT5
Oliver Gideon Amofa Appiah
4.6 (35)
This indicator obeys the popular maxim that: "THE TREND IS YOUR FRIEND" It paints a GREEN line for BUY and also paints a RED line for SELL. (you can change the colors). It gives alarms and alerts of all kinds. IT DOES NOT REPAINT and can be used for all currency pairs and timeframes. Yes, as easy and simple as that. Even a newbie can use it to make great and reliable trades. NB: For best results, get my other premium indicators for more powerful and reliable signals. Get them here: https://www.m
FREE
RSI abcd
Francisco Gomes Da Silva
3 (1)
RSI ABCD 패턴 파인더: 기술적 전략 1. 지표 작동 방식 클래식 RSI 와 ABCD 하모닉 패턴 자동 감지를 결합합니다. 주요 구성 요소 표준 RSI (조정 가능한 기간) 고점 및 저점 마커 (화살표) ABCD 패턴 (초록/빨강 선) 과매수 (70) 및 과매도 (30) 필터 2. MT5 설정 period = 14 ; // RSI 기간 size = 4 ; // 최대 패턴 크기 OverBought = 70 ; // 과매수 수준 OverSold = 30 ; // 과매도 수준 Filter = USE_FILTER_ YES ; // 확인 필터 3. 트레이딩 전략 3.1. 매수 진입 (강세 ABCD) 조건: RSI가 다음을 형성: 저점 ( A ) → 고점 ( B ) → 더 높은 저점 ( C ) D 는 과매도 (30) 위지만 C 아래 확인: A-B-C-D 연결 초록 선 목표: TP1: B-C의 61.8% TP2: B-C의 100% 손절: D 아래 3.2. 매도 진입 (약세 ABCD) 조건:
FREE
Product Name: Adaptive Session Trend MT5 Adaptive Session Trend MT5 is a session-based trend identification indicator for MetaTrader 5. It incorporates internal logic to detect the trading instrument and automatically synchronize with the broker's server time to filter signals based on the London and New York trading sessions. If you are looking for profitable and affordable EAs checkout my pulse series -  https://www.mql5.com/en/market/product/163739? The indicator is designed to provide tren
FREE
Haven FVG Indicator
Maksim Tarutin
5 (7)
인디케이터   Haven FVG   는 시장을 분석하는 도구로, 차트에서 비효율성 영역(Fair Value Gaps, FVG)을 식별하여 트레이더에게 가격 분석 및 거래 결정을 위한 주요 수준을 제공합니다. 다른 제품 ->  여기 주요 특징: 개별 색상 설정: 상승 FVG 색상   (Bullish FVG Color). 하락 FVG 색상   (Bearish FVG Color). 유연한 FVG 시각화: FVG를 검색할 최대 캔들 수. FVG 영역을 특정 바 수만큼 추가로 연장. FVG에 대한 채우기를 활성화할 수 있습니다. 중앙선(Middle Line): 색상 및 선 스타일 선택(예: 점선). 더 정확한 선 두께 조정. 일반 설정: FVG를 현재 바까지 확장. 채우기가 있는 역사적 FVG 제외하여 최신 데이터에 집중. 차트에서 비효율성 영역을 분석하고 근거 있는 거래 결정을 내리는 간단하고 효과적인 방법.
FREE
Indicator and Expert Adviser  EA Available in the comments section of this product. Download with Indicator must have indicator installed for EA to work. Mt5 indicator alerts for bollinger band and envelope extremes occurring at the same time. Buy signal alerts occur when A bullish candle has formed below both the lower bollinger band and the lower envelope  Bar must open and close below both these indicators. Sell signal occur when A bear bar is formed above the upper bollinger band and upper
FREE
https://www.mql5.com/en/users/gedeegi/seller    The GEN indicator is a multifunctional technical analysis tool for the MetaTrader 5 (MT5) platform. It is designed to automatically identify and display key Support and Resistance (S&R) levels and detect False Breakout signals, providing clear and visual trading cues directly on your chart. Its primary goal is to help traders identify potential price reversal points and avoid market traps when the price fails to decisively break through key levels
FREE
DALA Forecast
Grigorii Matsnev
About the indicator: DALA Forecast is a universal tool for predicting the dynamics of time series of any nature. For prediction, modified methods of nonlinear dynamics analysis are used, on the basis of which a predictive model is built using machine learning methods.  To get the trial version of the indicator, you can contact me in private messages. How to use the indicator: Apply the indicator to your chosen financial instrument or indicator with the settings you need. The prediction will be
FREE
Zigzag Price Arrows
Aiman Saeed Salem Dahbag
The Zigzag Price Arrow indicator is an enhanced version of the classic Zigzag indicator, combining the traditional zigzag pattern with advanced visual features. It not only identifies major market turning points but also provides clear trading signals through: • Directional arrows: Displays colored arrows (green for buy, magenta for sell) indicating potential trend directions. • Price labels: Shows the exact price values at each pivot point directly on the chart. • Improved visual clarity: Make
FREE
Build your professional trading suite for less: I believe in providing high-quality tools for the community. If you find value in this free indicator, please consider leaving a 5-star review to support my work. You can also explore my full catalog of professional EAs and specialized indicators on my profile to find the perfect 'trigger' for your strategy. What is this indicator? This Basic Support and Resistance Indicator -Free-   is designed to help traders automatically identify key market
FREE
WH Price Wave Pattern MT5
Wissam Hussein
4.25 (12)
FREE
VisualVol EURUSD
Maxim Kuznetsov
The indicator highlights the points that a professional trader sees in ordinary indicators. VisualVol visually displays different volatility indicators on a single scale and a common align. Highlights the excess of volume indicators in color. At the same time, Tick and Real Volume, Actual range, ATR, candle size and return (open-close difference) can be displayed. Thanks to VisualVol, you will see the market periods and the right time for different trading operations. This version is intended f
FREE
PZ Pivot Points MT5
PZ TRADING SLU
4.91 (22)
This indicator displays pivot points in the chart, including historical vales, and supports many calculation modes for Pivot Points and S/R levels. [ Installation Guide | Update Guide | Troubleshooting | FAQ | All Products ] It plots historical levels for backtesting purposes It allows you to select the reference timeframe It implements different Pivot Point calculation modes It implements different SR calculation modes It implements customizable colors and sizes Calculation Modes The indicato
FREE
Trendline mt5 indicator
David Muriithi
3 (1)
Are you tired of drawing trendlines every time you're analyzing charts? Or perhaps you would like more consistency in your technical analysis. Then this is for you. This indicator will draw trend lines automatically when dropped on a chart. How it works Works similar to standard deviation channel found on mt4 and mt5. It has 2 parameters: 1. Starting Bar 2. Number of bars for calculation The   starting bar   is the bar which drawing of the trend lines will begin, while the   number of bars for c
FREE
Coral Indi
Dinh Duong Luong
Coral trend is   a trend-following indicator that is widely popular among FOREX traders . It is usually used as a confluence with other indicators. It uses combinations of moving averages with complex smoothing formulas! It has two configurable parameters: Coefficient   - smoothing ratio (*) Applied price Calculation: Coral = (-0.064) * B6 + 0.672 * B5 - 2.352 * B4 + 2.744 * B3
FREE
MACD Enhanced
Nikita Berdnikov
5 (3)
Introducing the MACD  Enhanced – an advanced MACD (Moving Average Convergence Divergence) indicator that provides traders with extended capabilities for trend and momentum analysis in financial markets. The indicator uses the difference between the fast and slow exponential moving averages to determine momentum, direction, and strength of the trend, creating clear visual signals for potential entry and exit points. Attention! To achieve the best results, it is recommended to adapt the indicator
FREE
PZ Three Drives MT5
PZ TRADING SLU
2.83 (6)
This indicator finds Three Drives patterns. The Three Drives pattern is a 6-point reversal pattern characterised by a series of higher highs or lower lows that complete at a 127% or 161.8% Fibonacci extension. It signals that the market is exhausted and a reversal can happen. [ Installation Guide | Update Guide | Troubleshooting | FAQ | All Products ] Customizable pattern sizes Customizable colors and sizes Customizable breakout periods Customizable 1-2-3 and 0-A-B ratios It implements visual/s
FREE
PZ Penta O MT5
PZ TRADING SLU
3.5 (4)
The Penta-O is a 6-point retracement harmonacci pattern which usually precedes big market movements. Penta-O patterns can expand and repaint quite a bit. To make things easier this indicator implements a twist: it waits for a donchian breakout in the right direction before signaling the trade. The end result is an otherwise repainting indicator with a very reliable trading signal. The donchian breakout period is entered as an input. [ Installation Guide | Update Guide | Troubleshooting | FAQ | A
FREE
Swing Point BoS CHoCH Con Exp Alerts
Usiola Oluwadamilol Olagundoye
NOTE: Turn Pattern Scan ON This indicator identifies Swing Points, Break of Structure (BoS), Change of Character (CHoCH), Contraction and Expansion patterns which are plotted on the charts It also comes with Alerts & Mobile notifications so that you do not miss any trades. It can be used on all trading instruments and on all timeframes. The non-repaint feature makes it particularly useful in backtesting and developing profitable trading models. The depth can be adjusted to filter swing points.
FREE
Bounce Zone MT5
Nguyen Thanh Cong
4.56 (9)
Introduction The Bounce Zone indicator is a cutting-edge non-repainting technical tool built to identify key areas on the price chart where market sentiment is likely to cause a significant price reversal. Using advanced algorithms and historical price data analysis, this indicator pinpoints potential bounce zones. Combined with other entry signal, this indicator can help forex traders place the best trades possible Signal A possible buy signal is generated when price is in the green zone an
FREE
Fibonacci Trend Indicator
Vinoth Durairaj Durairaj
Fibonacci Trend Indicator for MT5 Unlock the power of Fibonacci analysis on your MetaTrader 5 charts! Our   Fibonacci Trend Indicator   automatically plots dynamic support and resistance levels so you can spot trends, reversals, and breakout opportunities at a glance. Features & Advantages Automatic Fibonacci Levels Instantly displays seven key Fibonacci retracement levels based on the highest and lowest prices from your chosen lookback period — no manual work required. Dynamic Trend Adaptatio
FREE
LT Donchian Channel
Thiago Duarte
4.83 (6)
Donchian Channel is an indicator created by Richard Donchian. It is formed by taking the highest high and the lowest low of the last specified period in candles. The area between high and low is the channel for the chosen period. Its configuration is simple. It is possible to have the average between the upper and lower lines, plus you have alerts when price hits one side. If you have any questions or find any bugs, please contact me. Enjoy!
FREE
Cybertrade Keltner Channels
Emanuel Andriato
4.75 (4)
Cybertrade Keltner Channels - MT5 Created by Chester Keltner, this is a volatility indicator used by technical analysis. It is possible to follow the trend of financial asset prices and generate support and resistance patterns. In addition, envelopes are a way of tracking volatility in order to identify opportunities to buy and sell these assets. It works on periods longer than the period visible on the chart. All values ​​are available in the form of buffers to simplify possible automations.
FREE
Important Lines
Terence Gronowski
4.87 (23)
This indicator displays Pivot-Lines, preday high and low, preday close and the minimum and maximum of the previous hour. You just have to put this single indicator to the chart to have all these important lines, no need to setup many single indicators. Why certain lines are important Preday high and low : These are watched by traders who trade in a daily chart. Very often, if price climbs over or falls under a preday low/high there is an acceleration in buying/selling. It is a breakout out of a
FREE
Daily Support and Resistance Levels 는 클래식 피벗 포인트 방식으로 일중 거래 핵심 가격 레벨을 자동 계산/표시하는 전문 지표입니다. 주요 기능: 피벗 포인트(PP) 자동 계산 3개의 저항 레벨(R1, R2, R3) 3개의 지지 레벨(S1, S2, S3) 전일 고가/저가 표시 실시간 정보 패널 상승/하락 바이어스 표시 최근 레벨까지 거리 표시 색상/표시 완전 사용자 설정 매일 자동 업데이트 모든 타임프레임 지원 계산 방식: 전일 고가/저가/종가 기반 클래식 피벗 포인트. 트레이딩 활용: 지지/저항 반등 매매 돌파 전략 레인지 거래 방향성 판단 목표가 설정 사용 방법: 차트에 인디케이터 적용 레벨 자동 생성 가격 > PP = 상승 바이어스 가격 < PP = 하락 바이어스 S1-S3 = 지지 구간 R1-R3 = 저항 구간 설정 옵션: 피벗/지지/저항 색상 라인 굵기/스타일 가격 라벨 표시/숨기기 정보 패널 ON/OFF 패널 위치/폰트 크기 전일 고가/저가 표
FREE
이 제품의 구매자들이 또한 구매함
ARIPoint
Temirlan Kdyrkhan
1 (1)
ARIPoint is a powerful trading companion designed to generate high-probability entry signals with dynamic TP/SL/DP levels based on volatility. Built-in performance tracking shows win/loss stats, PP1/PP2 hits, and success rates all updated live. Key Features: Buy/Sell signals with adaptive volatility bands Real-time TP/SL/DP levels based on ATR Built-in MA Filter with optional ATR/StdDev volatility Performance stats panel (Success, Profit/Loss, PP1/PP2) Alerts via popup, sound, push, or email Cu
이 지표를 구매하면 제 프로페셔널 트레이드 매니저를 무료로 드립니다. 우선 이 거래 시스템이 리페인팅, 리드로잉 및 레이그 인디케이터가 아니라는 점을 강조하는 것이 중요합니다. 이는 수동 및 로봇 거래 모두에 이상적인 것으로 만듭니다. 온라인 강좌, 설명서 및 프리셋 다운로드. "스마트 트렌드 트레이딩 시스템 MT5"은 새로운 및 경험이 풍부한 트레이더를 위해 맞춤형으로 제작된 종합적인 거래 솔루션입니다. 10개 이상의 프리미엄 인디케이터를 결합하고 7개 이상의 견고한 거래 전략을 특징으로 하여 다양한 시장 조건에 대한 다목적 선택이 가능합니다. 트렌드 추종 전략: 효과적인 트렌드 추이를 타기 위한 정확한 진입 및 손절 관리를 제공합니다. 반전 전략: 잠재적인 트렌드 반전을 식별하여 트레이더가 범위 시장을 활용할 수 있게 합니다. 스캘핑 전략: 빠르고 정확한 데이 트레이딩 및 단기 거래를 위해 설계되었습니다. 안정성: 모든 인디케이터가 리페인팅, 리드로잉 및 레이그가 아니므로 신뢰
Power Candles MT5
Daniel Stein
5 (5)
Power Candles – 모든 시장을 위한 강도 기반 진입 신호 Power Candles 는 Stein Investments의 검증된 강도 분석을 가격 차트에 직접 제공합니다. 가격 움직임에만 반응하는 대신, 각 캔들은 실제 시장 강도를 기준으로 색상화되어 모멘텀 형성, 강도 가속, 명확한 추세 전환을 즉시 파악할 수 있습니다. 모든 시장을 위한 단일 로직 Power Candles는 모든 거래 심볼 에서 자동으로 작동합니다. 현재 심볼이 Forex인지 비-Forex 시장인지 자동으로 감지하여 내부적으로 적절한 강도 모델을 적용합니다. Forex 및 Gold 는 FX Power Delta 값을 사용합니다 (절대값 범위 최대 100) 지수, 크립토 및 CFD 는 IX Power Strength 값을 사용합니다 (절대값 범위 최대 50) 필요한 강도 계산은 Power Candles에 완전히 내장되어 있습니다. 캔들 색상이나 신호 로직을 위해 추가 인디케이터는 필요하지 않습니다. 가격
Divergence Bomber
Ihor Otkydach
4.9 (81)
이 지표를 구매하신 분께는 다음과 같은 혜택이 무료로 제공됩니다: 각 거래를 자동으로 관리하고, 손절/익절 수준을 설정하며, 전략 규칙에 따라 거래를 종료하는 전용 도우미 툴 "Bomber Utility" 다양한 자산에 맞게 지표를 설정할 수 있는 셋업 파일(Set Files) "최소 위험", "균형 잡힌 위험", "관망 전략" 모드로 설정 가능한 Bomber Utility의 셋업 파일 이 전략을 빠르게 설치, 설정, 시작할 수 있도록 돕는 단계별 영상 매뉴얼 주의: 위의 모든 보너스를 받기 위해서는 MQL5 개인 메시지 시스템을 통해 판매자에게 연락해 주세요. 독창적인 커스텀 지표인 “Divergence Bomber(다이버전스 봄버)”를 소개합니다. 이 지표는 MACD 다이버전스(괴리) 전략을 기반으로 한 올인원(All-in-One) 거래 시스템입니다. 이 기술 지표의 주요 목적은 가격과 MACD 지표 간의 다이버전스를 감지하고, **향후 가격이 어느 방향으로 움직일지를 알려주는
Entry In The Zone and SMC Multi Timeframe 은 Smart Money Concepts(SMC)를 기반으로 개발된 실시간 시장 분석 도구입니다. 이 시스템은 트레이더가 시장 구조를 체계적으로 분석하고 전체적인 시장 방향을 더욱 명확하게 파악할 수 있도록 설계되었습니다. 시스템은 여러 시간대에서 반전 포인트(Reversal Points), 핵심 구역(Key Zones), 그리고 시장 구조(Market Structure)를 자동으로 분석하며, POI(Point of Interest), 노 리페인트(No Repaint) 신호, 자동 피보나치 레벨(Auto Fibonacci Levels)을 표시하여 되돌림(Pullback)과 반전 포인트를 정확하게 탐지할 수 있도록 돕습니다. 또한 실시간 신호와 알림을 통해 가격이 핵심 구역에 진입하거나 해당 구역에서 반전 신호가 발생하는 순간을 놓치지 않도록 보조합니다. 더불어 이 시스템은 인디케이터와 신호 시스템을 하나로
SuperScalp Pro
Van Minh Nguyen
5 (1)
SuperScalp Pro – 고급 다중 필터 스캘핑 인디케이터 시스템 SuperScalp Pro는 클래식 Supertrend와 여러 지능형 확인 필터를 결합한 고급 스캘핑 인디케이터 시스템입니다. 해당 인디케이터는 M1부터 H4까지 모든 타임프레임에서 효율적으로 작동하며, 특히 XAUUSD, BTCUSD 및 주요 외환 통화쌍에 적합합니다. 독립형 시스템으로 사용하거나 기존 거래 전략에 유연하게 통합할 수 있습니다. 이 인디케이터는 11개 이상의 필터를 통합하며, 빠른/느린 EMA, 추세 판별용 3개의 EMA, EMA 기울기(EMA slope), RSI, ADX, 거래량(Volume), VWAP, 볼린저 밴드 돌파(Bollinger Bands Breakout) 및 MACD 다이버전스 필터 등을 포함합니다. 스마트 캔들 필터는 캔들 종가를 확인하여 약한 신호를 제거하고, 3 EMA와 MACD 다이버전스 필터를 결합한 추세 인식 메커니즘은 더 높은 승률의 신호를 선별하는 데 도움을 줍니
Azimuth Pro
Ottaviano De Cicco
5 (1)
LAUNCH PROMO Azimuth Pro price is initially set at 299$ for the first 100 buyers. Final price will be 499$ . THE DIFFERENCE BETWEEN RETAIL AND INSTITUTIONAL ENTRIES ISN'T THE INDICATOR — IT'S THE LOCATION. Most traders enter at arbitrary price levels, chasing momentum or reacting to lagging signals. Institutions wait for price to reach structured levels where supply and demand actually shift. Azimuth Pro maps these levels automatically: swing-anchored VWAP, multi-timeframe structure lines, an
무료 AUX 인디케이터와 EA 지원을 받으세요 직접 다운로드 — 여기를 클릭 [ D.I.C.E ] The DICE Indicator  Divergence in Chaos Environment는 엘리엇 파동 이론과 트레이딩 카오스 기법을 함께 사용하는 트레이더를 위해 설계된 MT5 전문 도구입니다. 가격 움직임의 숨겨진 및 일반 다이버전스를 감지하며, 빌 윌리엄스가 설명한 혼돈 시장 환경과 동기화됩니다. 주요 특징 엘리엇 파동 정렬 다이버전스: 파동 구조에 조화된 강세 및 약세 다이버전스를 탐지하여 파동 카운팅 정확도를 높입니다. 카오스 기법 통합: AO(오썸 오실레이터) 및 시장 구조 원칙과 일치하도록 설계되었습니다. 다중 타임프레임 스캐닝: 다양한 시간 프레임에서 다이버전스를 분석하여 모멘텀 변화와 추세 소진을 확인합니다. 시각적 알림 및 객체: 명확한 화살표, 선, 표시로 빠른 인식 가능. 적응형 시장 판독: 혼돈 시장 조건에 자동으로 조정되어 노이즈를 필터링하고 유효한 셋업만
Game Changer Indicator mt5
Vasiliy Strukov
4.69 (13)
Game Changer는 모든 금융 상품에 사용하도록 설계된 혁신적인 추세 지표로, 메타트레이더를 강력한 추세 분석기로 탈바꿈시켜 줍니다. 이 지표는 재작성이나 지연 현상이 발생하지 않습니다. 모든 시간대에서 작동하며 추세 파악을 지원하고, 잠재적 반전 신호를 제공하며, 트레일링 스톱 메커니즘으로 활용되고, 신속한 시장 반응을 위한 실시간 알림을 제공합니다. 숙련된 투자자, 전문가, 또는 우위를 점하려는 초보자 등 누구나 이 도구를 통해 자신감과 원칙을 바탕으로, 그리고 근본적인 추세 역학에 대한 명확한 이해를 바탕으로 거래할 수 있습니다. 구매 후 바로 연락 주시면 개인 보너스를 드립니다! 강력한 지지선과 추세 스캐너 지표를 무료로 받으실 수 있습니다. 개인 메시지로 알려주세요 저는 텔레그램에서 EA나 특별 세트를 판매하지 않습니다. Mql5에서만 사용 가능하며, 세트 파일은 제 블로그에서만 볼 수 있습니다 . 사기꾼을 조심하시고 다른 사람에게서 세트를 구매하지 마세요 설정 추세
Atomic Analyst MT5
Issam Kassas
4.07 (28)
우선적으로 언급할 점은이 거래 지표가 다시 그리지 않고 지연되지 않으며 이를 통해 수동 및 로봇 거래 모두에 이상적이라는 점입니다. 사용자 매뉴얼: 설정, 입력 및 전략. Atomic Analyst는 가격의 강도와 모멘텀을 활용하여 시장에서 더 나은 이점을 찾는 PA Price Action Indicator입니다. 고급 필터를 장착하여 잡음과 거짓 신호를 제거하고 거래 잠재력을 높이는 데 도움이 됩니다. 복잡한 지표의 다중 레이어를 사용하여 Atomic Analyst는 차트를 스캔하고 복잡한 수학적 계산을 간단한 신호와 색상으로 변환하여 초보 트레이더가 이해하고 일관된 거래 결정을 내릴 수 있도록합니다. "Atomic Analyst"는 새로운 및 경험이 풍부한 트레이더를위한 종합적인 거래 솔루션입니다. 프리미엄 지표와 최고 수준의 기능을 하나의 거래 전략에 결합하여 모든 종류의 트레이더에 대한 다재다능한 선택지가되었습니다. 인트라데이 거래 및 스캘핑 전략 : 빠르고 정확한 일일
Smart Stop Indicator – 차트 위에서 직접 작동하는 지능형 스톱로스 시스템 개요 Smart Stop Indicator는 감이나 추측이 아닌 명확하고 체계적인 방식으로 스톱로스를 설정하고 싶은 트레이더를 위한 맞춤형 솔루션입니다. 이 도구는 클래식 프라이스 액션 논리(고점, 저점 구조)와 현대적인 브레이크아웃 인식을 결합하여 실제로 가장 논리적인 다음 스톱 레벨을 정확히 식별합니다. 추세, 박스권, 빠른 브레이크아웃 상황 등 어떤 시장에서도 인디케이터는 최적의 SL 구역과 상태(“new”, “broken”, “valid”)를 차트에 직접 표시합니다. 새로운 기능으로 SL 거리의 %ADR 표시가 추가되었습니다. 핵심 기능 자동 시장구조 기반 스톱 설정 • 시장 구조와 실시간 가격 움직임을 기반으로 의미 있는 스톱로스 레벨을 자동으로 탐지합니다. 스마트 브레이크아웃 감지 • 빠른 방향 변화나 돌파 상황에서도 불필요한 조기 스톱 조정을 강요하지 않으며 유연하게 반응합
FX Power MT5 NG
Daniel Stein
5 (30)
FX Power: 통화 강세 분석으로 더 스마트한 거래 결정을 개요 FX Power 는 어떤 시장 상황에서도 주요 통화와 금의 실제 강세를 이해하기 위한 필수 도구입니다. 강한 통화를 매수하고 약한 통화를 매도함으로써 FX Power 는 거래 결정을 단순화하고 높은 확률의 기회를 발견합니다. 트렌드를 따르거나 극단적인 델타 값을 사용해 반전을 예측하고자 한다면, 이 도구는 귀하의 거래 스타일에 완벽히 적응합니다. 단순히 거래하지 말고, FX Power 로 더 스마트하게 거래하세요. 1. FX Power가 거래자에게 매우 유용한 이유 통화와 금의 실시간 강세 분석 • FX Power 는 주요 통화와 금의 상대적 강세를 계산하고 표시하여 시장 역학에 대한 명확한 통찰력을 제공합니다. • 어떤 자산이 앞서고 있고 어떤 자산이 뒤처지는지 모니터링하여 보다 현명한 거래 결정을 내릴 수 있습니다. 포괄적인 멀티 타임프레임 뷰 • 단기, 중기 및 장기 타임프레임에서 통화와 금의 강세를
Trend Screener Pro MT5
STE S.S.COMPANY
4.84 (100)
트렌드 표시기, 트렌드 트레이딩 및 필터링을 위한 획기적인 고유 솔루션, 하나의 도구 안에 내장된 모든 중요한 트렌드 기능! Forex, 상품, 암호 화폐, 지수 및 주식과 같은 모든 기호/도구에 사용할 수 있는 100% 다시 칠하지 않는 다중 시간 프레임 및 다중 통화 표시기입니다. Trend Screener는 차트에 점이 있는 화살표 추세 신호를 제공하는 효율적인 지표 추세 추종 지표입니다. 추세 분석기 표시기에서 사용할 수 있는 기능: 1. 트렌드 스캐너. 2. 최대 이익 분석이 있는 추세선. 3. 추세 통화 강도 측정기. 4. 경고가 있는 추세 반전 점. 5. 경고가 있는 강력한 추세 점. 6. 추세 화살표 Trend Screener Indicator가 있는 일일 분석 예, 일일 신호 성능...등은 여기에서 찾을 수 있습니다. 여기를 클릭하십시오. LIMITED TIME OFFER : Trend Screener Indicator는 50$ 및 평생 동안만 사용할 수 있습니다.
Entry Points Pro for MT5
Yury Orlov
4.48 (138)
다시 색을 칠하지 않고 거래에 진입할 수 있는 정확한 신호를 제공하는 MT5용 지표입니다. 외환, 암호화폐, 금속, 주식, 지수 등 모든 금융 자산에 적용할 수 있습니다. 매우 정확한 추정값을 제공하고 매수와 매도의 가장 좋은 시점을 알려줍니다. 하나의 시그널로 수익을 내는 지표의 예와 함께 비디오 (6:22)시청하십시오! 대부분의 거래자는 Entry Points Pro 지표의 도움으로 첫 거래 주 동안 트레이딩 결과를 개선합니다. 저희의   Telegram Group 을 구독하세요! Entry Points Pro 지표의 좋은점. 재도색이 없는 진입 신호 신호가 나타나고 확인되면(시그널 캔들이 완성된 경우) 신호는 더 이상 사라지지 않습니다. 여타 보조지표의 경우 신호를 표시한 다음 제거되기 때문에 큰 재정적 손실로 이어집니다. 오류 없는 거래 게시 알고리즘을 통해 트레이드(진입 또는 청산)를 할 이상적인 순간을 찾을 수 있으며, 이를 통해 이를 사용하는 모든 거래자의 성공률이
Super Signal – Skyblade Edition 전문가용 노리페인트 / 노래그 트렌드 신호 시스템, 뛰어난 승률 제공 | MT4 / MT5용 1분, 5분, 15분과 같은 낮은 타임프레임에서 가장 좋은 성능을 보입니다. 핵심 기능: Super Signal – Skyblade Edition은 추세 매매를 위해 설계된 스마트 신호 시스템입니다. 이 시스템은 다중 필터 로직을 활용하여, 명확한 방향성과 실질적인 모멘텀이 수반된 고품질 추세만을 감지합니다. 이 시스템은   고점 또는 저점을 예측하지 않으며 , 다음 세 가지 조건이 모두 충족될 때만 신호를 발생시킵니다: 명확한 추세 방향 강화되는 모멘텀 건전한 변동성 구조 또한, 시장 세션 기반의 유동성 분석을 통해 신호의 신뢰성과 타이밍을 더욱 향상시킵니다. 신호 특성: 모든 화살표 신호는 100% 리페인트 없음 / 지연 없음 신호가 한 번 발생하면 고정되며, 깜빡이거나 사라지지 않음 차트 상의 시각적 화살표, 정보 패널, 팝업
Transaction Speed MT5
Ivan Stefanov
5 (2)
이 지표는 시장에서 관심이 나타나는 영역 을 강조 표시한 후, 주문이 누적되는 영역 을 보여줍니다. 이는 **대규모 오더북(호가창)**처럼 작동합니다. 이것은 거대한 자금 을 위한 인디케이터입니다. 성능은 탁월하며, 시장에서 어떤 관심이 있든 반드시 포착할 수 있습니다 . (이것은 완전히 새로 작성되고 자동화된 버전 입니다 – 이제 수동 분석은 필요하지 않습니다.) **거래 속도(Transaction Speed)**는 새로운 개념의 인디케이터로, 시장에 대규모 주문이 언제, 어디에 쌓이는지를 보여주며 , 그 이점을 분석합니다. 매우 초기 단계에서 트렌드 전환 을 감지할 수 있습니다. FX 시장에서 흔히 사용하는 "거래량(volume)"은 오해입니다. 실제로는 시간당 가격 변화량 이므로, 올바른 용어는 거래 속도 입니다. 우리가 어떻게 사고하고, 행동하며, 분석하느냐 가 가장 중요합니다. 분석 패러다임의 전환 은 필수적입니다. 이 인디케이터는 외환 시장에서의 볼륨 개념을 논리적으로
우선적으로, 이 거래 도구는 전문적인 거래에 이상적인 비-다시 그리기 및 지연되지 않는 지표입니다.  온라인 강좌, 사용자 매뉴얼 및 데모. 스마트 가격 액션 컨셉트 인디케이터는 신규 및 경험 많은 트레이더 모두에게 매우 강력한 도구입니다. Inner Circle Trader Analysis 및 Smart Money Concepts Trading Strategies와 같은 고급 거래 아이디어를 결합하여 20가지 이상의 유용한 지표를 하나로 결합합니다. 이 인디케이터는 스마트 머니 컨셉트에 중점을 두어 대형 기관의 거래 방식을 제공하고 이동을 예측하는 데 도움을 줍니다.  특히 유동성 분석에 뛰어나 기관이 어떻게 거래하는지 이해하는 데 도움을 줍니다. 시장 트렌드를 예측하고 가격 변동을 신중하게 분석하는 데 탁월합니다. 귀하의 거래를 기관 전략에 맞추어 시장의 동향에 대해 더 정확한 예측을 할 수 있습니다. 이 인디케이터는 시장 구조를 분석하고 중요한 주문 블록을 식별하고 다양
Grabber System MT5
Ihor Otkydach
4.82 (22)
탁월한 기술적 지표인 Grabber를 소개합니다. 이 도구는 즉시 사용 가능한 “올인원(All-Inclusive)” 트레이딩 전략으로 작동합니다. 하나의 코드 안에 강력한 시장 기술 분석 도구, 매매 신호(화살표), 알림 기능, 푸시 알림이 통합되어 있습니다. 이 인디케이터를 구매하신 모든 분들께는 다음의 항목이 무료로 제공됩니다: Grabber 유틸리티: 오픈 포지션을 자동으로 관리하는 도구 단계별 영상 매뉴얼: 설치, 설정, 그리고 실제 거래 방법을 안내 맞춤형 세트 파일: 인디케이터를 빠르게 자동 설정하여 최고의 성과를 낼 수 있도록 도와줍니다 다른 전략은 이제 잊어버리세요! Grabber만이 여러분을 새로운 트레이딩의 정점으로 이끌어 줄 수 있습니다. Grabber 전략의 주요 특징: 거래 시간 프레임: M5부터 H4까지 거래 가능한 자산: 어떤 자산이든 사용 가능하지만, 제가 직접 테스트한 종목들을 추천드립니다 (GBPUSD, GBPCAD, GBPCHF, AUDCAD, AU
FX Levels MT5
Daniel Stein
5 (12)
FX Levels: 모든 시장을 위한 뛰어난 정확도의 지지와 저항 간단 요약 통화쌍, 지수, 주식, 원자재 등 어떤 시장이든 믿을 만한 지지·저항 레벨을 찾고 싶나요? FX Levels 는 전통적인 “Lighthouse” 기법과 첨단 동적 접근을 결합해, 거의 보편적인 정확성을 제공합니다. 실제 브로커 경험을 반영하고, 자동화된 일별 업데이트와 실시간 업데이트를 결합함으로써 FX Levels 는 가격 반전 포인트를 파악하고, 수익 목표를 설정하며, 자신 있게 트레이드를 관리할 수 있게 돕습니다. 지금 바로 시도해 보세요—정교한 지지/저항 분석이 어떻게 여러분의 트레이딩을 한 단계 끌어올릴 수 있는지 직접 확인하세요! 1. FX Levels가 트레이더에게 매우 유용한 이유 뛰어난 정확도의 지지·저항 존 • FX Levels 는 다양한 브로커 환경에서도 거의 동일한 존을 생성하도록 설계되어, 데이터 피드나 시간 설정 차이로 인한 불일치를 해소합니다. • 즉, 어떤 브로커를 사용하
Market Structure Patterns
Samuel Manoel De Souza
4.47 (19)
Available for   MT4   and   MT5 . Join the Market Structure Patterns channel to download materials available for study and/or additional informations. Related posts: Market Structure Patterns - Introdução Market Structure Patterns   is an indicator based on   smart money concepts   that displays   SMC/ICT   elements that can take your trading decisions to the next level. Take advantage of the   alerts ,   push notifications   and   email messages   to keep informed from when an element is form
ARIScalping
Temirlan Kdyrkhan
ARIScalp is a powerful trading companion designed to generate high-probability entry signals with dynamic TP/SL/DP levels based on volatility. Built-in performance tracking shows win/loss stats, PP1/PP2 hits, and success rates all updated live. Key Features: Buy/Sell signals with adaptive volatility bands Real-time TP/SL/DP levels based on ATR Built-in MA Filter with optional ATR/StdDev volatility Performance stats panel (Success, Profit/Loss, PP1/PP2) Alerts via popup, sound, push, or email Cus
ARICoins
Temirlan Kdyrkhan
ARICoin is a powerful trading companion designed to generate high-probability entry signals with dynamic TP/SL/DP levels based on volatility. Built-in performance tracking shows win/loss stats, PP1/PP2 hits, and success rates all updated live. Key Features: Buy/Sell signals with adaptive volatility bands Real-time TP/SL/DP levels based on ATR Built-in MA Filter with optional ATR/StdDev volatility Performance stats panel (Success, Profit/Loss, PP1/PP2) Alerts via popup, sound, push, or email Cust
Shock Pullback
Suleiman Alhawamdah
5 (1)
간단히 말해, 현재 캔들 옆에 흰색 숫자(‘핍’이라고 불림)의 움직임이 나타나기 시작하면 거래를 시작할 수 있습니다. 흰색 ‘핍’은 현재 매수 또는 매도 거래가 활성화되어 있으며 흰색으로 표시된 것처럼 올바른 방향으로 움직이고 있음을 나타냅니다. 흰색 핍의 움직임이 멈추고 정적인 녹색으로 바뀌면 이는 현재 모멘텀의 종료를 의미합니다. 숫자의 녹색은 매수 또는 매도 거래를 통해 얻은 총 수익을 ‘핍’ 단위로 나타냅니다. 또한, 인디케이터 내의 다른 고급 전문 분석 도구를 활용하여 거래를 시작할 수 있습니다. 인디케이터에 표시되는 신호와 색상을 관찰함으로써 높은 정확도로 수많은 스캘핑 기회를 포착할 수 있습니다. 테스트 중이거나 실시간 차트에서 인디케이터를 충분히 이해하는 것이 중요합니다. 대부분의 외환 시장에 적합: 금 거래 및 인기 있는 지수 시장(Dow Jones, S&P 500, Nasdaq, DAX 등), 그리고 EUR/USD, GBP/USD, USD/JPY 등 강력한 통화쌍
Quantum TrendPulse
Bogdan Ion Puscasu
5 (20)
SuperTrend   ,   RSI   ,   Stochastic   의 힘을 하나의 포괄적인 지표로 결합하여 트레이딩 잠재력을 극대화하는 궁극의 트레이딩 도구   인 Quantum TrendPulse를   소개합니다. 정밀성과 효율성을 추구하는 트레이더를 위해 설계된 이 지표는 시장 추세, 모멘텀 변화, 최적의 진입 및 종료 지점을 자신 있게 식별하는 데 도움이 됩니다. 주요 특징: SuperTrend 통합:   주요 시장 추세를 쉽게 따라가고 수익성의 물결을 타세요. RSI 정밀도:   매수 과다 및 매도 과다 수준을 감지하여 시장 반전 시점을 파악하는 데 적합하며 SuperTrend 필터로 사용 가능 확률적 정확도:   변동성이 큰 시장에서 숨겨진 기회를 찾기 위해 확률적 진동   을 활용하고 SuperTrend의 필터로 사용 다중 시간대 분석:   M5부터 H1 또는 H4까지 다양한 시간대에 걸쳐 시장을 최신 상태로 유지하세요. 맞춤형 알림:   맞춤형 거래 조건이 충족되면
IX Power MT5
Daniel Stein
4.92 (12)
IX Power: 지수, 원자재, 암호화폐 및 외환 시장 통찰력을 발견하세요 개요 IX Power 는 지수, 원자재, 암호화폐 및 외환 시장의 강도를 분석할 수 있는 다목적 도구입니다. FX Power 는 모든 가용 통화 쌍 데이터를 사용하여 외환 쌍에 대해 가장 높은 정확도를 제공하는 반면, IX Power 는 기초 자산 시장 데이터에만 초점을 맞춥니다. 이로 인해 IX Power 는 비외환 시장에 이상적이며, 다중 쌍 분석이 필요하지 않은 간단한 외환 분석에도 신뢰할 수 있는 도구입니다. 모든 차트에서 매끄럽게 작동하며, 거래 결정을 향상시키기 위한 명확하고 실행 가능한 통찰력을 제공합니다. 1. IX Power가 트레이더에게 유용한 이유 다양한 시장 강도 분석 • IX Power 는 지수, 원자재, 암호화폐 및 외환 심볼의 강도를 계산하여 각 시장에 맞는 통찰력을 제공합니다. • US30, WTI, 금, 비트코인 또는 통화 쌍과 같은 자산을 모니터링하여 거래 기회를 발견
FX Dynamic MT5
Daniel Stein
5 (5)
FX Dynamic: 맞춤형 ATR 분석으로 변동성과 트렌드를 파악하세요 개요 FX Dynamic 는 Average True Range(ATR) 계산을 활용하여 트레이더에게 일간 및 일중 변동성에 대한 뛰어난 인사이트를 제공하는 강력한 도구입니다. 80%, 100%, 130%와 같은 명확한 변동성 임계값을 설정함으로써 시장이 평소 범위를 초과할 때 빠르게 경고를 받고, 유망한 수익 기회를 재빨리 식별할 수 있습니다. FX Dynamic 는 브로커의 시간대를 인식하거나 수동으로 조정할 수 있으며, 변동성 측정 기준을 일관되게 유지하며, MetaTrader 플랫폼과 완벽하게 연동되어 실시간 분석을 지원합니다. 1. FX Dynamic이 트레이더에게 매우 유용한 이유 실시간 ATR 인사이트 • 하루 및 일중 변동성을 한눈에 모니터링하세요. ATR의 80%, 100%, 130% 임계값이 도달 또는 초과되면, 시장의 중요한 지점에 있음을 알 수 있습니다. • 변동성이 완전히 폭발하기
Gold Sniper Scalper Pro
Ich Khiem Nguyen
3.5 (8)
Gold Sniper Scalper Pro는 MetaTrader 5용 전문 지표로, 트레이더가 진입 지점을 식별하고 리스크를 효과적으로 관리할 수 있도록 지원하기 위해 설계되었습니다. 이 지표는 시그널 감지 시스템, 자동 Entry/SL/TP 관리, 거래량 분석 및 실시간 성과 통계를 포함하는 포괄적인 분석 도구 세트를 제공합니다. 시스템 이해를 위한 사용자 가이드   |   기타 언어 사용자 가이드 주요 기능 시그널 감지 시스템 지표는 Price Action 분석 및 시장 구조를 기반으로 잠재적 진입 지점을 자동으로 감지합니다. 거래 기회 감지 시: - BUY 화살표(녹색) 또는 SELL 화살표(빨간색)가 차트에 표시됩니다 - 캔들이 색상으로 표시되어 시그널 영역을 식별합니다 - Entry/SL/TP 레벨이 자동으로 계산됩니다 시그널은 가격이 Entry 레벨에 도달할 때만 활성화되어, 시장에서 확인되지 않은 시그널을 필터링합니다. 지능형 Entry/SL/TP 관리 - Ent
PZ Swing Trading MT5
PZ TRADING SLU
5 (5)
Protect against whipsaws: revolutionize your swing trading approach Swing Trading is the first indicator designed to detect swings in the direction of the trend and possible reversal swings. It uses the baseline swing trading approach, widely described in trading literature. The indicator studies several price and time vectors to track the aggregate trend direction and detects situations in which the market is oversold or overbought and ready to correct. [ Installation Guide | Update Guide | Tro
Introduction to X3 Chart Pattern Scanner X3 Cherart Pattern Scanner is the non-repainting and non-lagging indicator detecting X3 chart patterns including Harmonic pattern, Elliott Wave pattern, X3 patterns, and Japanese Candlestick patterns. Historical patterns match with signal patterns. Hence, you can readily develop the solid trading strategy in your chart. More importantly, this superb pattern scanner can detect the optimal pattern of its kind. In addition, you can switch on and off individu
Trend Forecaster
Alexey Minkov
5 (7)
The Trend Forecaster indicator utilizes a unique proprietary algorithm to determine entry points for a breakout trading strategy. The indicator identifies price clusters, analyzes price movement near levels, and provides a signal when the price breaks through a level. The Trend Forecaster indicator is suitable for all financial assets, including currencies (Forex), metals, stocks, indices, and cryptocurrencies. You can also adjust the indicator to work on any time frames, although it is recommen
제작자의 제품 더 보기
Extreme Spike PRT
Irina Cherkashina
The Extreme Spike PRT Indicator   is an effective tool for identifying   sharp market fluctuations .   It performs its calculations using the ATR (Average True Range) indicator and displays candles with extreme volatility in two categories:   primary spikes   and   secondary spikes , within the Metatrader platform oscillator window. This tool assists traders in detecting   intense price movements   and conducting more precise   analyses   based on these fluctuations. Time Frame 15-minute - 1-ho
TMA Centered Bands Indicator
Irina Cherkashina
5 (1)
The TMA Centered Bands Indicator for MT5 draws bands on the chart and shows the overall price trend. It displays three bands - the lower and upper boundaries of the channel and the median.   The bands are made up of moving averages, and each of them has an MA period. The name TMA comes from triangular moving averages, as the indicator draws triangular bands.   The price will fluctuate between these ranges whenever the trend changes direction, thus creating entry and exit points.   How to trade
FREE
Centered Target EA
Irina Cherkashina
This universal Expert Advisor is equally good for both scalping and conservative multi-currency trading of simultaneous trading of several pairs. This  Expert Advisor  is based on its own Algorithm, which is an incredibly effective tool due to the simultaneous operation of a trading strategy based on our   Centered Bands  Indicator  and our proprietary signal filter system together with the Martingale method, which together work out a very interesting hedging system. Traders are also given the
This universal expert advisor is based on our own Algorithm, which is based on effective and time-tested Elliot Wave Theory.  This   expert advisor   is ideal for working both on a flat and during sharp or protracted trend movements (thanks to the Martingale method, according to which averaging positions are opened in accordance with the multiplier and distance set in the settings for accepting a new signal). ATTENTION! CAREFULLY STUDY THE OPERATING PRINCIPLE AND AVAILABLE SETTINGS OF THE EXPER
The Channel Sgnals ProfRoboTrading Indicator for MT5 is an effective Forex trading tool designed to track market movements.   The MT5 signal point indicator effectively detects trend reversals after they have already occurred. This Indicator   is a fully automated technical tool that includes a number of parameters to track market trends.   It automatically examines the ever-changing price dynamics of the market, compares the information with earlier data and generates a trading signal. Because
FREE
The Kalires Channel Indicator is a technical indicator used to evaluate trend direction and potential trading opportunities. This is a hybrid indicator that combines Kauffman Adaptive Moving Average (KAMA), linear regression and smoothing. The Kalires Channel Indicator consists of two lines: one central and two outer bands. The central line is a smoothed KAMA modified according to the direction of the trend. The outer bars represent two linear regression lines drawn above and below the center l
FREE
The TrendOscillator Indicator is an upgraded version of the traditional Stochastic Oscillator.   It comprises two lines: %K and %D.   The %K line represents the current market position.   In contrast, the %D line is a moving average of the %K line used to generate signals and identify potential entry or exit points. The good thing is the indicator works on all timeframes like the traditional Stochastic.   However, to avoid any false signals, applying the indicator on longer timeframes is better
FREE
The TrendChannelTracker Indicator is an innovative Forex trading tool. This indicator, which is based on the standard Stochastic Oscillator, provides traders with a unique and simplified method for observing market trends. In contrast to the traditional Stochastic Oscillator, which is shown at the bottom of the chart, the TrendChannelTracker Indicator is built into the price action itself. This removes the need for traders to continually switch their attention between the oscillator and the pri
FREE
Our modernized version of the popular channel TMA_TRUE  indicator for MT4, which provides information on the main points of trend reversal and momentum exhaustion by drawing a channel on the chart, also draws arrows of signals for buy and sell. As a result, traders can identify bullish and bearish price reversal zones and BUY and SELL accordingly. This indicator works well on all instruments and on all Timeframes. This indicator is the basis of our Channel Trigger EA, which you can buy in MQL
FREE
This indicator works by plotting fractals on the chart as arrows that can be used as buy or sell signals. It is a great tool for both new and experienced traders as it provides a clear visual representation of the market and helps traders identify fractals. Although it repaints, it can be used quite effectively in conjunction with other tools to filter trading strategies. We use this indicator in this way in our Royal Fractals EA, which you can purchase on the MQL5 Market: https://www.mql5.com
FREE
The Forex Gangster Indicator allows you to determine the current trend. If the Forex Gangster Indicator line has moved below the price and turned blue, then you should open deals for an increase. If the Forex Gangster Indicator line has appeared above the price and turned red, then you should open deals for a decrease: The indicator is suitable for any time frames, but it needs to be supplemented with filtering indicators, since by itself it is late and does not have time to give an accurate si
FREE
The BandsFill Indicator is a modified Bollinger Bands with a colored cloud.   It has two adjustable parameters: Period Deviation The cloud is colored as follows: If the price crosses the upper band, the cloud is blue. If the price crosses the lower band, the cloud is pink.   Thanks to this, the BandsFill Indicator provides traders with an easy opportunity to detect various features and patterns in price dynamics that are invisible to the naked eye. Based on this information, traders can predict
FREE
This indicator works by plotting fractals on the chart as arrows that can be used as buy or sell signals. It is a great tool for both new and experienced traders as it provides a clear visual representation of the market and helps traders identify fractals. Although it repaints, it can be used quite effectively in conjunction with other tools to filter trading strategies. We use this indicator in this way in our RoyalFractals II Expert Advisor, which you can purchase on the MQL5 Market: https:
FREE
The Teamtrader Channel Stop indicator allows you to determine the current trend. If the Teamtrader Channel Stop indicator line has moved below the price and turned blue, then you should open deals for an increase. If the Teamtrader Channel Stop indicator line has appeared above the price and turned red, then you should open deals for a decrease: The indicator is suitable for any time frames, but it needs to be supplemented with filtering indicators, since by itself it is late and does not have
FREE
The Red Dragons Support and Resistance Levels indicator automatically determines support and resistance levels using the proprietary algorithm based on historical and current data, so the levels are dynamic, which allows you to adjust trading targets based on the current price movement. For this reason, we use this indicator in our advisors, for example, Red Dragons, which you can purchase here: https://www.mql5.com/en/market/product/128713?source=Site +Market+MT4+New+Rating006 The panel also
FREE
The TMA Centered Bands indicator for MT4 draws bands on the chart and reports the overall price trend, as well as gives arrows signals to buy and sell when the bar closes outside the channel. Unlike many TMAs, our version uses the calculation part of the algorithm without redrawing, and also adds the ability to select a symbol. The bands are made up of moving averages, and each of them has an MA period. The name TMA comes from triangular moving averages, as the indicator draws triangular bands
FREE
Moving Averages Divergence 3x3    Indicator     uses the crossover technique for signaling the market trend and the trade opportunities as well.     It applies 3 formats of the same indicator and allows them to plot the crossover signals which are interpreted as the trade signals along with the direction of the market trend. Moving Averages Divergence 3x3    Indicator   can be applied to trade all kinds of forex currency pairs within the financial markets.  Although, this indicator works well o
FREE
Forex Gangster PRT
Irina Cherkashina
FOREX GANGSTER is a unique Expert Advisor created by a professional prop trader and financial asset manager with many years of experience. This is a solution for those who strive for stable profits without constant control over each transaction or monitoring the work of a trading advisor. Created for optimal conservative trading and investing through exchange instruments with long-term regular profits and minimal risks. The Expert Advisor algorithm is based on a deep understanding of market pat
The Wolf Wave Finder Indicator is a popular indicator, that is useful in identifying potential trading opportunities.   The indicator works by recognizing the Wolf Wave pattern, which is a well-known pattern used by professional traders to identify potential areas of support and resistance.   The indicator is easy to use and provides traders with an easy way to identify potential trades.   The Wolf Wave Finder Indicator is a great tool for traders who are looking for a reliable and accurate way
Fibo Parabolic PRT
Irina Cherkashina
This indicator is a fusion of the Parabolic SAR and Fibonacci indicators. Fibo is drawn on the last wave, at the peaks the indicator displays prices for convenience. Parabolic SAR helps to define the market trend and generates trends following trade signals.     On the other hand, Fibonacci plots the price retracement levels so that traders can determine a better and safer place to enter the market. Scalping with Parabolic SAR and Fibonacci Overview. For this strategy, in addition to our indica
This is an easy-to-set-up and easy-to-use Expert Advisor that will help you always have the necessary information about your trading account at hand, sending from MetaTrader 4 to you in Telegram: • Account drawdown • Number of open positions • Volume of open positions • Profit per day, week, month How to get an chat ID: - Chat with BotFather to create Bot and get API Token of Bot. If you had Bot, skip the step. - Chat with bot @userinfobot , then the bot will reply your ID. How to setu
Symbol Manager PRT
Irina Cherkashina
The SYMBOL MANAGER symbol change indicator is an effective tool designed to enhance trading convenience and significantly simplify the trader's experience. This indicator allows users to switch seamlessly between currency pairs and timeframes within a single open window of the trading terminal. Importantly, when switching, the associated template, including indicators and current chart settings, is automatically duplicated, ensuring a consistent trading environment.
Morning Star PRT 지표는 모닝 플랫 브레이크아웃 원리를 사용합니다. 이 지표는 모닝 플랫 레벨을 표시하고 가능한 타겟을 보여줍니다. 지표에 피보나치 레벨이 추가되었고, 설정에서 지정한 두 타겟 레벨과 나이트 플랫 레벨의 교차점에 대한 경고음이 울립니다. Morning Star PRT 지표는 나이트가 끝날 때 나이트 플랫 채널을 구축하고, 두 개의 피보나치 가격 레벨이 위아래로 움직입니다. 이러한 레벨은 타겟 레벨과 반전 레벨로 간주할 수 있습니다. Morning Star PRT 지표는 모든 타임프레임에서 작동하지만 M15 간격에서 사용하는 것이 가장 효과적입니다. The Morning Star PRT indicator uses the morning flat breakout principle. The indicator displays morning flat levels and shows possible targets. An additional Fibonacci le
지표 공급 및 수요 구역 PRT– 차트의 공급 및 수요 구역 표시를 수행하는 데 사용되는 사용자 지정 도구입니다. 이 지표는 저항/지지 수준과 공급/수요 구역을 강조하는 차트에 선과 사각형을 그립니다. 편의상 선과 그림은 모두 다른 색상으로 칠해져 신호를 서로 쉽게 구별할 수 있습니다. 이 지표는 아직 사용되지 않았고 가격이 아직 돌파하지 않은 새로운 수준만 그립니다. 초보자와 숙련된 트레이더 모두에게 적합합니다. 이 지표는 스캘핑, 트렌드, 카운터 트렌드 및 기타 트레이딩 시스템에서 사용됩니다. 이것은 모든 전략에 쉽게 포함될 수 있는 보편적인 알고리즘입니다. 모든 시간 프레임과 도구에서 잘 보이고 오실레이터와 잘 결합됩니다. Indicator Supply & Demand zones PRT– is a custom tool that is used to perform supply and demand zones marking of the chart. The indicator draw
Pattern Master PRT
Irina Cherkashina
이 지표는 차트 패턴을 식별하고자 하는 트레이더에게 강력한 도구이며, 이를 트레이딩 전략에 통합하는 데에는 수많은 이점이 있습니다. 이 도구는 금융 시장에서 잠재적인 추세와 반전을 효과적으로 식별하고 신호를 보내 트레이딩 수익성을 높입니다. 고급 알고리즘 덕분에 이 지표는 시장 데이터를 정확하게 분석하여 트레이더에게 정보에 입각한 결정을 내리는 데 도움이 되는 귀중한 정보를 제공할 수 있습니다. 이 지표를 사용하면 차트 패턴을 높은 정확도로 자동으로 식별하므로 시장을 보다 포괄적으로 분석할 수 있습니다. 이러한 패턴은 종종 특정 방향으로 잠재적인 가격 움직임을 나타냅니다. 따라서 이 정보에 액세스할 수 있으면 트레이더는 이러한 패턴을 인식하거나 의미를 이해하지 못할 수 있는 다른 시장 참여자보다 유리합니다. 이 지표는 광범위한 강세 및 약세 패턴 인식 기능을 자랑합니다(차트에서 약어로 표시된 명칭은 괄호 안에 표시됨): - Rising Star(SS); - Evening St
This is the automatic price spike signal indicator for MT4. Plots advance alerts on potential breakouts/pullbacks. Suits forex, stocks & crypto trading strategies. This is a perfect indicator for reversal traders. A spike often indicates a turn-around moment. The best way to use that gauge is to apply it to your favourite trading system as a filter. 這是 MT4 的自動價格飆升訊號指示器。繪製有關潛在突破/回調的預先警報。適合外匯、股票和加密貨幣交易策略。 對於反轉交易者來說,這是一個完美的指標。尖峰通常表示轉變時刻。使用該指標的最佳方法是將其作為過濾器應用到您最喜歡的交易系統中
Parabolic SAR & Support/Resistance Levels는 외환 거래에서 잠재적인 추세 반전과 진입 및 종료 지점을 식별하는 데 사용되는 기술 분석 지표일 뿐만 아니라 기성 자율 거래 전략이기도 합니다. 이 지표는 PSAR 지표를 기반으로 차트에 동적 지원 및 저항 수준을 추가하여 트레이더가 시장이 잠재적으로 반전될 수 있는 주요 가격 수준을 식별하는 데 도움이 될 수 있습니다. 이 지표를 사용하면 트레이더는 시장의 강점과 방향, 거래의 잠재적인 진입 및 종료 지점에 대한 통찰력을 얻을 수 있습니다. Parabolic SAR & Support/Resistance Levels 지표는 차트에 다양한 Parabolic Support and Resistance(PSAR) 수준을 표시하여 트레이더에게 잠재적인 추세 반전 신호를 제공하는 기술 분석 도구입니다. 이 지표는 MT4 차트 창에 수평으로 정렬된 일련의 선으로 표시되어 트레이더가 실제 PSAR 수준을 쉽게 식별할
All Market Channels
Irina Cherkashina
The All Market Channels indicator from ProfRobotrading automatically builds and displays all formed trading channels on the screen. This indicator is very convenient for trading on all existing channel strategies and is applicable to all instruments and timeframes.  Look at the screenshot - it will tell you more :) More information is available on our website ProfRoboTrading. ProfRobotrading의 All Market Channels 지표는 모든 형성된 거래 채널을 자동으로 구축하여 화면에 표시합니다. 이 지표는 모든 기존 채널 전략에서 거래하는 데 매우 편리하며 모든 상품과
This is a Bollinger Bands Compression indicator. It detects volatility compression and the release of “suppressed momentum.” It can be used when it coincides with any specific trading entries — released volatility means a higher probability of making a decent profit. There is also a histogram with colored bands symbolizing weakness or strength, and a zero line crossover. Therefore, this indicator can be used both in conjunction with other indicators within trading strategies, and on its own meri
The work of this Expert Advisor is similar to fishing, when you use several fishing rods.   This Expert Advisor works on the channel indicator, the work of which you can see in the screenshots. This indicator is effective on any TM, so it can be used in all types of trading, including scalping for 5 and 15 minutes, intraday or full automatic trading of several instruments simultaneously on D1. This expert advisor is ideal for working both on a flat and during sharp or protracted trend movements
필터:
jihwan lim
28
jihwan lim 2025.02.07 06:43 
 

지표가 좋아요 감사 합니다

Findolin
1940
Findolin 2025.01.13 18:10 
 

Very good indicator. Thank you very much!

Irina Cherkashina
11053
개발자의 답변 Irina Cherkashina 2025.01.14 15:17
Thank you very much for your feedback. I would like to offer you an EA based on this indicator. https://www.mql5.com/en/market/product/129073?source=Site+Market+MT5+New+Rating006
리뷰 답변