Momentum Close

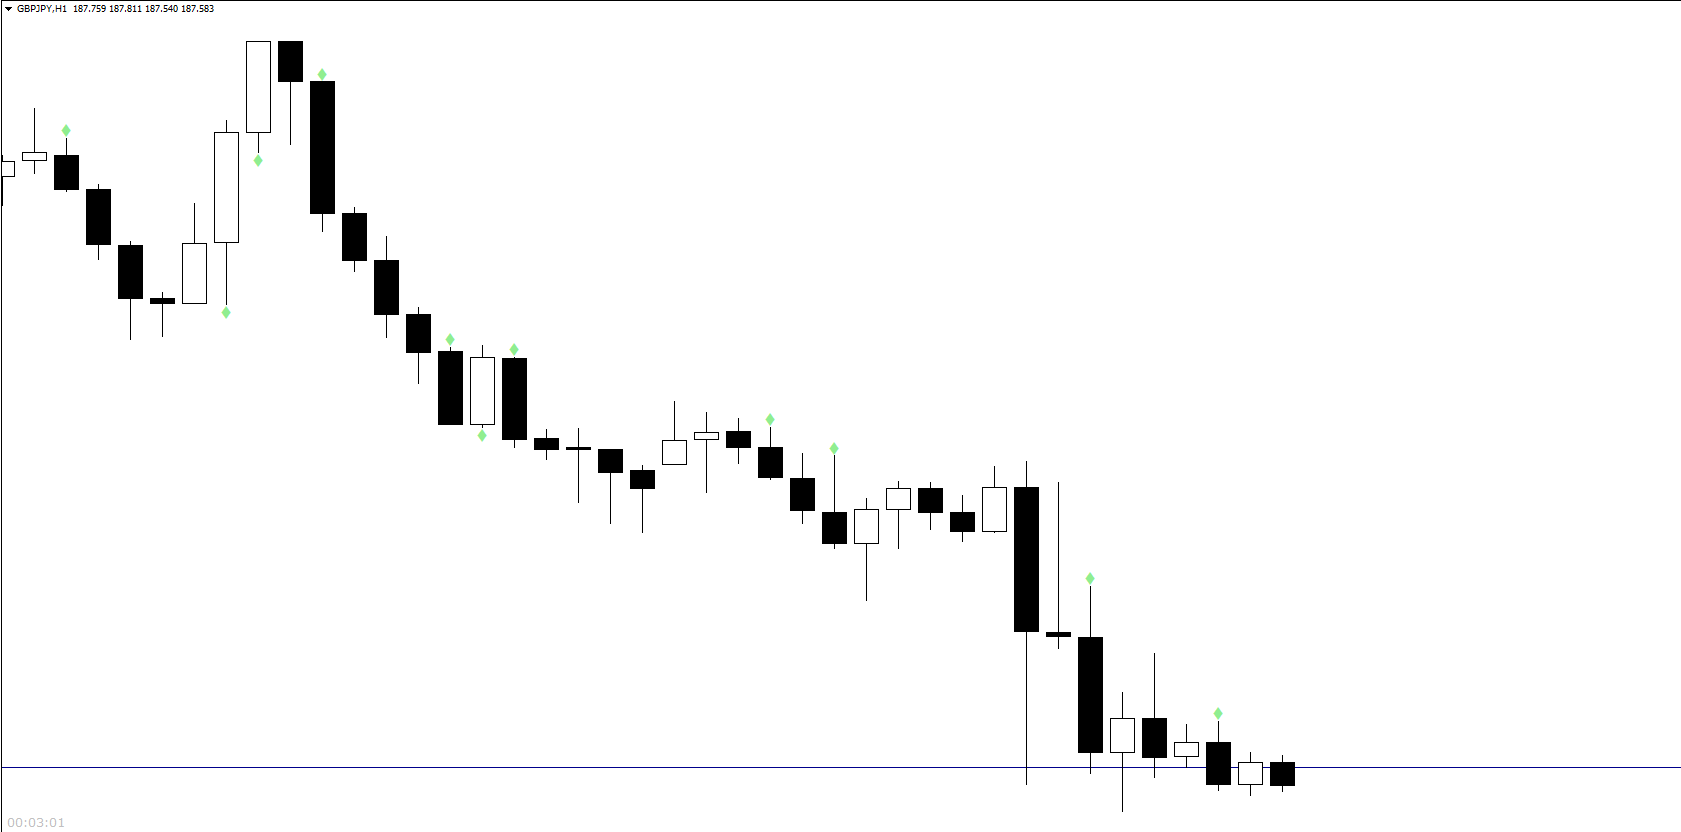
Momentum Close is a useful tool to identify volume based on the strength of a candle close.

A strong candle close is when there is a small wick in comparison to the candle body and is a sign that the market will continue in that direction.

*This is a NON-repainting indicator*


How this can help you?

  • Identify trend strength 
  • Trend confirmation
  • Seeing potential reversals (strong rejection candle)
  • Developing entry and exit strategies
  • Strong confluence to add to your strategy
  • Volume analysis


Features:

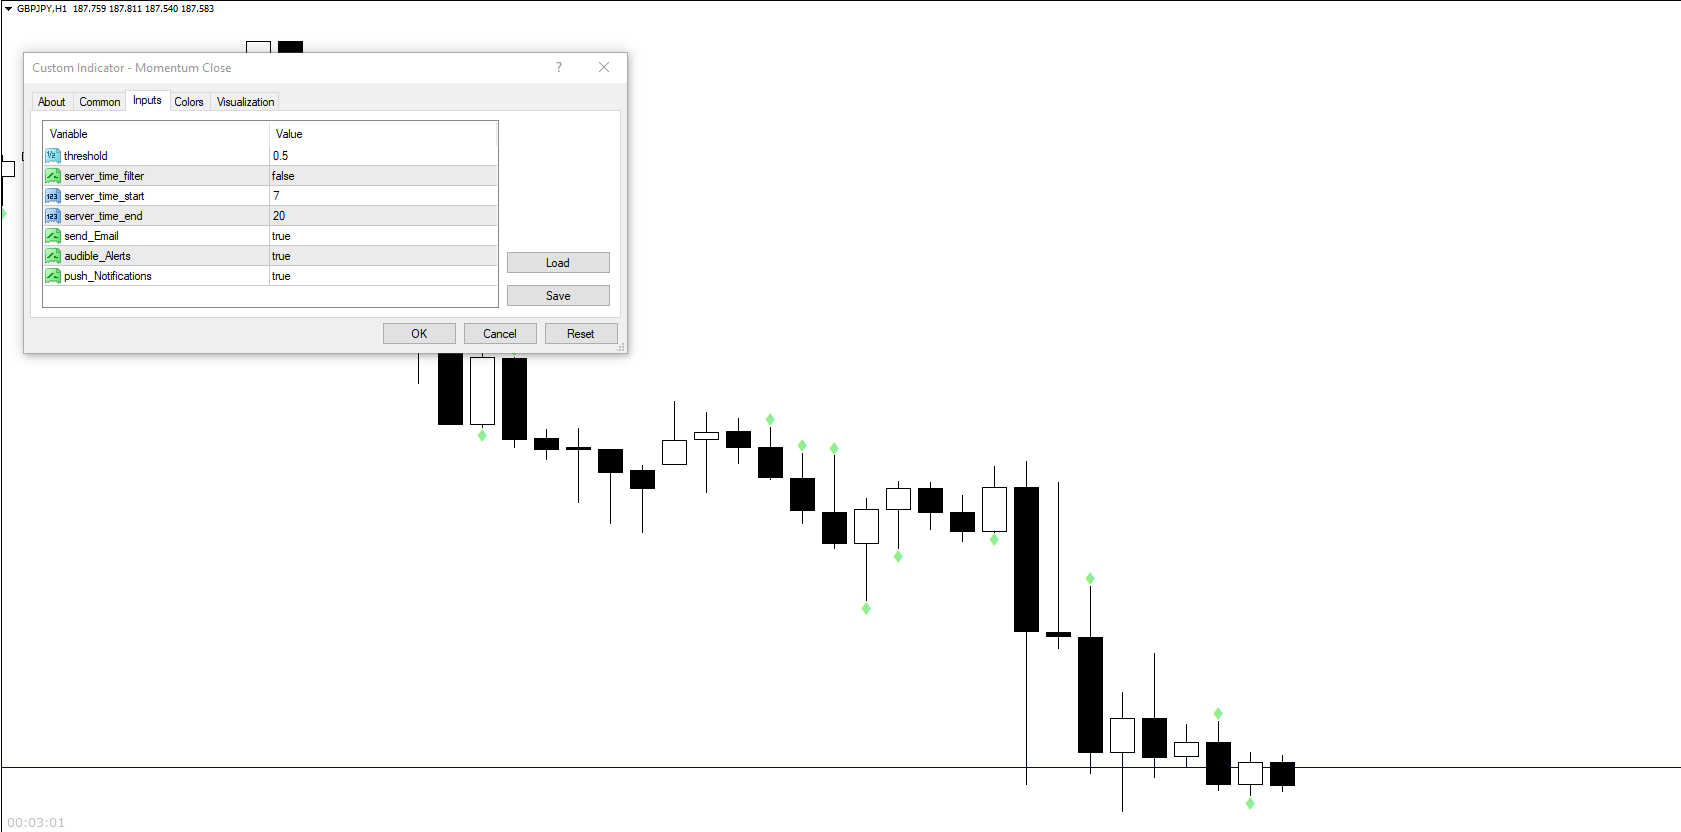
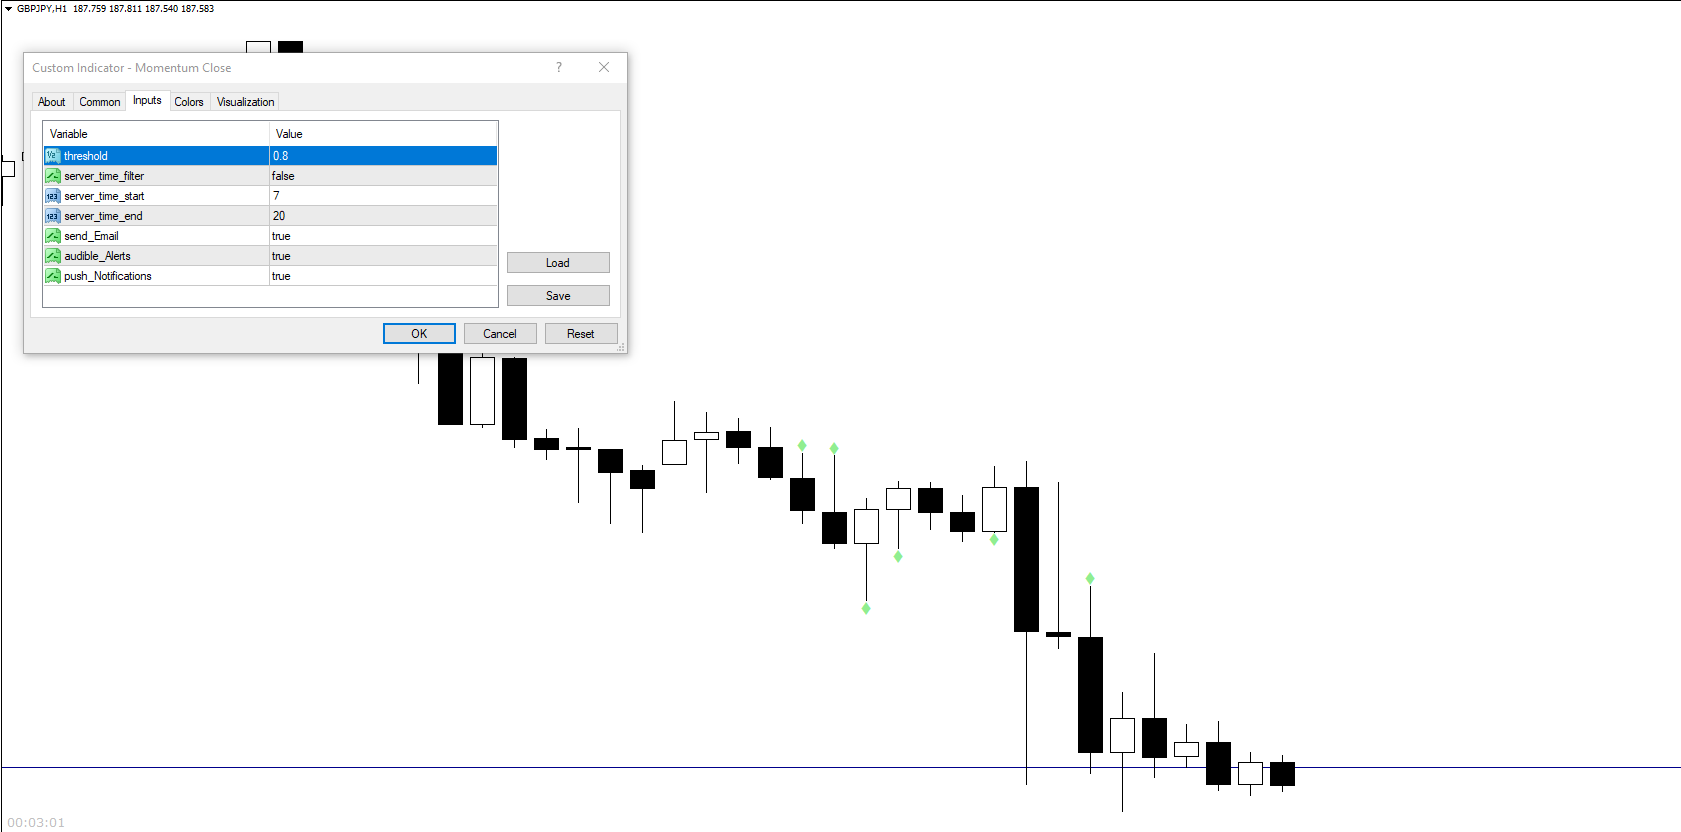
  • Threshold: parameter to control candle strength (higher is stronger)
  • Time filter: only enable indicator during your trading hours
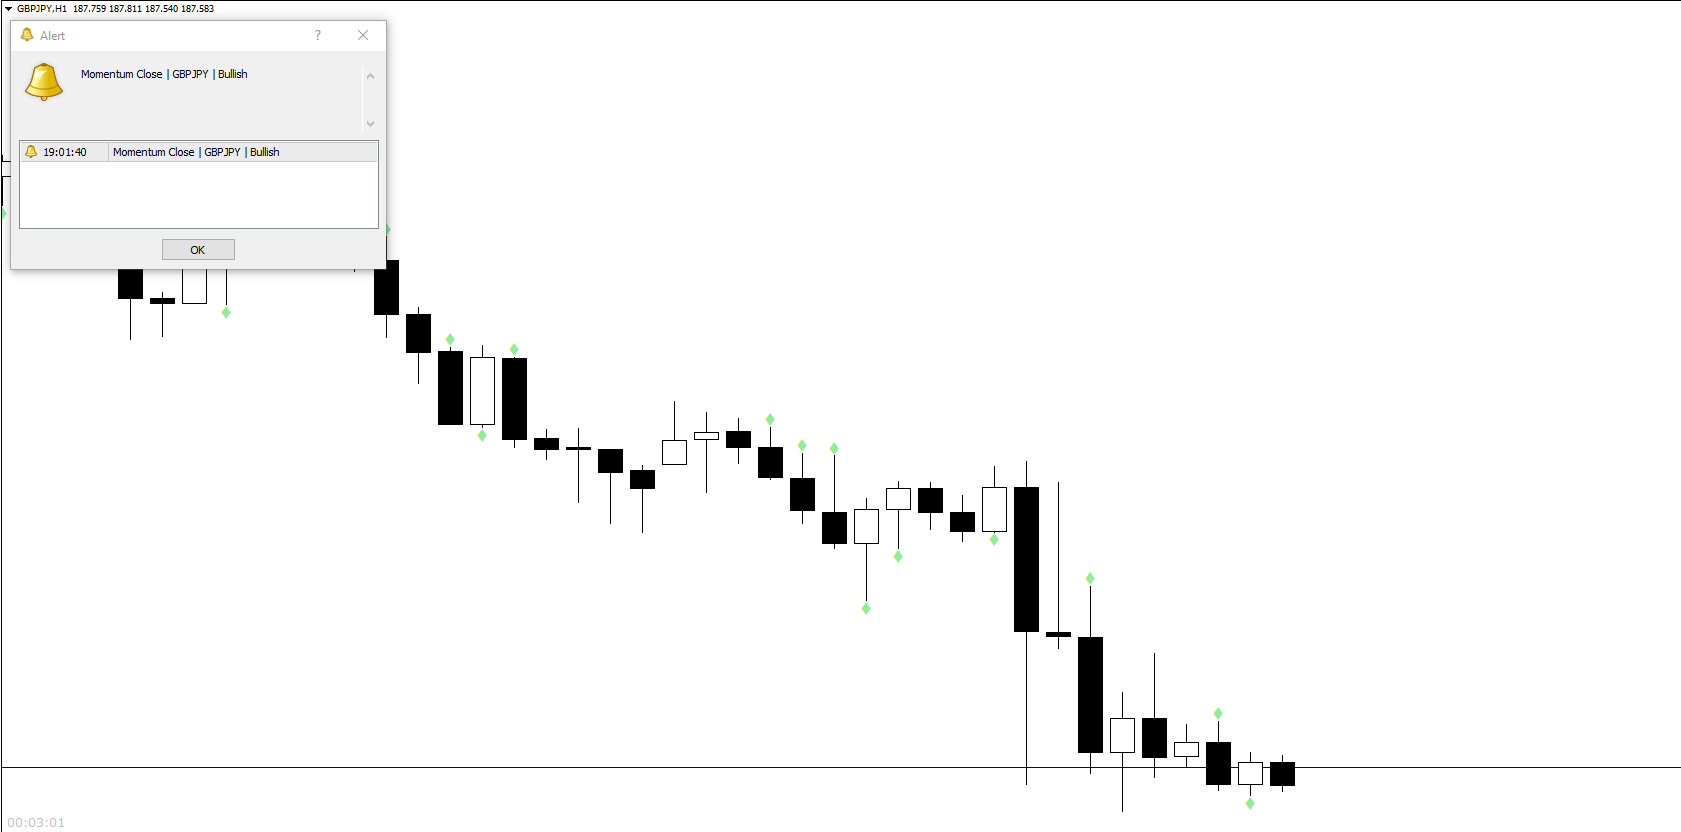
  • Alerts: audible alert, push notification and email alerts configurable 

추천 제품
Channel Cluster
Vitalyi Belyh
5 (1)
Cluster indicator working in the price channel. For operation, the indicator builds a channel line - (dashed line). Inside the channel, cluster sections are determined that determine the direction of the price movement - (histograms in two directions), start with large arrows. Small arrows are plotted above / below each histogram - indicator increase volatility. The indicator does not redraw the values. Works on any tools and timeframes. Entrances are made when large arrows appear, inside small
Auto Fibo Pro m
DMITRII GRIDASOV
"Auto FIBO Pro" Crypto_Forex 지표 - 거래에 유용한 보조 도구입니다! - 지표는 자동으로 Fibo 수준과 로컬 추세선(빨간색)을 계산하여 차트에 배치합니다. - Fibonacci 수준은 가격이 반전될 수 있는 주요 영역을 나타냅니다. - 가장 중요한 수준은 23.6%, 38.2%, 50%, 61.8%입니다. - 역전 스캘핑이나 존 그리드 거래에 사용할 수 있습니다. - Auto FIBO Pro 지표를 사용하여 현재 시스템을 개선할 수 있는 기회도 많습니다. - Info Spread Swap Display가 있습니다. 현재 Spread와 Swap이 부착된 외환 쌍을 표시합니다. - 디스플레이에는 계정 잔액, 자본 및 마진도 표시됩니다. - 차트의 어느 모서리에서나 Info Spread Swap Display를 찾을 수 있습니다. 0 - 왼쪽 상단 모서리, 1 - 오른쪽 상단, 2 - 왼쪽 하단, 3 - 오른쪽 하단. 여기를 클릭하여 고품질 트레이딩 로봇과
Alpha Trend sign has been a very popular trading tool in our company for a long time. It can verify our trading system and clearly indicate trading signals, and the signals will not drift. Main functions: Based on the market display of active areas, indicators can be used to intuitively determine whether the current market trend belongs to a trend market or a volatile market. And enter the market according to the indicator arrows, with green arrows indicating buy and red arrows indicating se
오메가 지지 및 저항 저가 매수, 고가 매도 전략에 대한 고유한 지표 반전 유형 항목은 가격이 전체 길이 선까지 상승함에 따라 가격이 회전/스윙/반전할 것으로 예상합니다. 주간 설정의 경우 4시간으로 1~5분 차트를 거래할 수 있고, 장기 설정의 경우 일일로 m15 이상, 주간으로 1시간 차트를 거래할 수 있습니다. 주간, 일일, 4시간, 심지어 1시간 차트에 대한 모든 제품의 고가 또는 저가에 대한 고정밀 미래 가격 예측기 특정 수준의 진입을 피하려면 SonicR 컬러 바 표시기 또는 이와 유사한 것을 사용하는 것이 가장 좋습니다. 비디오를 시청하여 방법과 이유를 알아보세요. MT4 버전은 무료이므로 지원이 제공되지 않습니다. MT5 고객만 지원을 받을 수 있습니다. 영상과 자세한 내용은 곧 공개됩니다! 특징 고유한 지지 및 저항 가격 수준 기록의 일수 제한 선, 색상 변경을 위한 입력 용법 이 지표는 거래에만 사용하거나 다른 전략과 결합하여 사용할 수 있습니다. 예상 목표 및
Trend Ray
Andriy Sydoruk
The indicator shows the potential trend direction by cyclical-wave dependence. Thus, all the rays of the intersection will be optimal rays, in the direction of which the price is expected to move, taking into account the indicator period. Rays can be used as a direction for potential market movement. But we must not forget that the approach must be comprehensive, the indicator signals require additional information to enter the market.
SystemBinaryM1
Andrey Spiridonov
SystemBinaryM1 - a professional indicator for trading short-term binary options, is a complete, self-contained author's strategy for working in the binary options market. The unique algorithm for analyzing the foreign exchange market is based on the calculation of reference points on three different time periods M15, M5. M1. Thus, the indicator simultaneously analyzes the long-term, medium-term and short-term price behavior before issuing a signal. The indicator is set in the usual way and work
Trend Hunter Pro
Yaroslav Varankin
The indicator is designed for opening trades for a long period. he is set up to get as many points from each trade as possible. he uses the scalping method... you can trade on any currency pairs indicator is already  you can trade at any time of the day but the preferred time of trading during the European American session. currency pairs eur / jpy, eur / usd currency pairs with high volatility then the results are much better.
Renko Chart Profile
Makarii Gubaydullin
작은 가격 변동을 걸러내고 큰 추세에 집중하세요 . Renko 차트 인디케이터는 작은 가격 변동을 걸러내어 전체적인 추세에 집중할 수 있도록 도와줍니다. 가격이 지정된 금액만큼 이동해야 Renko 블록이 생성됩니다. 이로 인해 가격이 이동하는 현재 추세 방향을 쉽게 파악할 수 있습니다. 다기능 유틸리티 : 66개 이상의 기능 포함  |   질문이 있으면 저에게 연락하세요   |    MT5 버전 인디케이터 설정에서 다음을 구성할 수 있습니다: 계산 설정: 블록 크기, 포인트 단위; 인디케이터 스타일: 블록 색상; 프로그램 파일은 " Indicators " 디렉토리에 배치해야 합니다. //--------------- 다기능 유틸리티 : 66개 이상의 기능 포함  |   질문이 있으면 저에게 연락하세요   |    MT5 버전
Trend Reborn
Phindile Victoria Qwabe
TREND REBORN is a non-repainting indicator that shows you the trend of the market  can be used as a trend filter or a trade entry or exit  BUY when indicator is blue and SELL when Indicator is Orange only  The indicator can be used alone or with another indicator based on your trading strategy  Timeframe   All Timeframe can be traded  Currency pairs All Currency pairs can be traded 
Spread and Close MT4
Alexander Denisovich Jegorov
Spread & Candle Close Timer Indicator for MT4  Optimize your trading with this lightweight and efficient indicator, designed to display the real-time spread and candle close countdown directly on your MT4 chart. Features: Live Spread Monitoring – Instantly see market conditions. Candle Close Timer – Stay prepared for the next price movement. Simple & Non-Intrusive Design – No unnecessary settings, just clear and accurate data. Ideal for scalpers, day traders, and those who need real-time exec
Price Magnets
Ivan Simonika
Price Magnet — Price Density and Attraction Levels Indicator Price Magnet is a professional analytical tool designed to identify key support and resistance levels based on statistical Price Density. The indicator analyzes a specified historical period and detects price levels where the market spent the most time. These zones act as “magnets,” attracting price action or forming a structural base for potential reversals. Unlike traditional Volume Profile tools, Price Magnet focuses on price-time d
Channels Pro
Alexander Nikolaev
5 (3)
The indicator determines and plots price channels or lines, reading information from multiple timeframes (from current, second and third) simultaneously. Color and width of lines for each timeframe can be customized. It is also possible to set different distance between the Highs and Lows for plotting channels or lines. Parameters History - maximum number of bars to plot channels or lines; Distance - minimum distance from one High (or Low) to another when plotting lines; Shift - shift for sever
Market Trend Catcher
Alexander Fedosov
Market Trend Catcher indicator analyzes the duration of trend movements and, with a certain development of the current trend, offers market entry points in the form of arrows with recommended profit targets. The indicator is very easy to use and does not require a lot of information to understand how it works. It has a minimum of settings and is transparent in understanding the principle of its operation, fully displaying the information on the basis of which it makes decisions on recommending e
Your good friend
Sergei Semenov
Your Good Friends — this is not just an indicator, but your reliable trading assistant, designed for traders who value simplicity, clarity, and stability. It combines the best classic methods of technical analysis — support and resistance levels, reversal signals, visual cues — and presents them in the clearest, most user-friendly format possible. Suitable for both beginners and experienced traders — especially those who want to eliminate chaos, reduce stress, and trade based on clear signals.
Octave Fractal Channel — Dynamic Gann-Based Support/Resistance Levels with Auto-Scaling. This indicator plots a dynamic channel based on the fractal structure of price movement. Channel levels adapt to the current symbol and timeframe, making it suitable for use across various financial instruments — from currency pairs to cryptocurrencies and indices. The indicator can be used in combination with other technical tools, such as the RSI oscillator, to provide additional signal filtering. How to
PABT Pattern Indicator - it's classical system one of the signal patterns. Indicator logic - the Hi & Lo of the bar is fully within the range of the preceding bar, look to trade them as pullback in trend. In the way if indicator found PABT pattern it's drawing two lines and arrow what showing trend way.  - First line - it's entry point and drawing at: 1. On the high of signal bar or on middle of the signal bar (depending from indicator mode) for buy; 2. On the low of signal bar or on middle of t
The arrow indicator without redrawing shows potential entry points into the market in the form of arrows of the appropriate color: the up arrows (usually green) suggest opening a purchase, the red down arrows suggest selling. The appearance of arrows may be accompanied by beeps. It is usually assumed to enter at the next bar after the pointer, but there may be non-standard recommendations. Arrow indicators visually "unload" the price chart and save time for analysis: no signal – no deal, if ther
El indicador "MR BEAST ALERTAS DE LIQUIDEZ" es una herramienta avanzada diseñada para proporcionar señales y alertas sobre la liquidez del mercado basándose en una serie de indicadores técnicos y análisis de tendencias. Ideal para traders que buscan oportunidades de trading en función de la dinámica de precios y los niveles de volatilidad, este indicador ofrece una visualización clara y detallada en la ventana del gráfico de MetaTrader. Características Principales: Canal ATR Adaptativo: Calcula
FVG Indicator MT4
Alexander Denisovich Jegorov
Fair Value Gap (FVG) Indicator with Clear Trendlines Identify Fair Value Gaps (FVGs) like a pro! This powerful MQL4 indicator marks   Bullish   and   Bearish FVGs   with   clear, precise trendlines , giving you a visual edge in spotting high-probability trading opportunities. Key Features: Two Trendlines per FVG : Clearly marks the   top and bottom   of each FVG zone for easy identification. No Rays : Trendlines are clean and concise, ensuring a clutter-free chart. Customizable Colors : Personal
Structural Trend Lines
Vincent Jose Proenca
STRUCTURAL TREND LINES - MT4 Indicator Simple indicator that automatically draws trend lines based on market structure. Features: - 3 degrees of structure detection (short, medium, long term) - Configurable swing strength for each degree - Single color per degree for clean visualization - Adjustable number of lines per degree - Customizable colors and line widths How it works: The indicator identifies swing highs and lows based on the strength parameter, then connects these points to create t
DYJ Alligator SignalSource   is based on Alligator   indicator. It can be used for any currency pair and timeframe. The blue line (Alligator's Jaw) is the Balance Line for the timeframe that was used to build the chart (13-period Smoothed Moving Average, moved into the future by 8 bars); Red Line (Alligator's Teeth) is the Balance Line for the value timeframe of one level lower (8-period Smoothed Moving Average, moved by 5 bars into the future); Green Line (Alligator's Lips) is the Balance Line
Infinity Trend Pro
Yaroslav Varankin
1 (1)
This is a trend indicator without redrawing Developed instead of the binary options strategy (by the color of the Martingale candlestick) Also works well in forex trading When to open trades (binary options) A signal will appear in the place with a candle signaling the current candle It is recommended to open a deal for one candle of the current timeframe M1 and M5 When a blue dot appears, open a deal up When a red dot appears, open a trade down. How to open trades on Forex. When a signal is rec
New, more accurate version of the Xmaster indicator. More than 200 traders from around the world have conducted more than 15,000 tests of different combinations of this indicator on their PCs in order to get the most effective and accurate formula. And here we present to you the "Xmaster formula indicator forex no repaint" indicator, which shows accurate signals and does not repaint. This indicator also sends signals to the trader by email and push. With the arrival of each new tick, it constan
Ozi Arrow
Svyatoslav Kucher
Ozi Arrow is a unique indicator that can display signals in the direction of the main trend and counter trend signals. For calculations, the indicator determines a price channel. If recently the price was at its borders, and all conditions of additional filters are observed, a signal is displayed in the form of arrows. Ozi Arrow is suitable for any timeframe and any pair. The indicator signals do not disappear under any conditions. A distinctive feature is the presence of a trend filter. If the
CHART OBJECTS: Blue box : Bullish Order Blocks (OB) Red box : Bearish OB Orange box : Mitigated OB. Price bounce from this area the made a new high/low Light gray box : Price bounced from this area but did not made a new high/low Dark gray box : Broken OB.  Filled boxes : TimeFrame 1 Order Blocks Unfilled boxes : TimeFrame 2 Order Blocks INDICATOR SETTINGS: Order Block Required Length:  Required number of subsequent candles in the same direction to identify Order Block.   Default value: 5 Imba
Quants 이동 평균 기울기는 방향 표시와 모멘텀을 제공하는 매우 강력한 지표입니다. 표시기가 다시 칠해지지 않습니다. 마각을 효율적으로 계산하고 추세를 찾을 수 있습니다. 신호 촛불이 닫히면 이익 계산이 시작됩니다. 따라서 라이브에서 정확한 결과를 얻을 수 있습니다. 제안된 TimeFrame은 H1에서 그것을 사용하고 있습니다. 표시기의 모든 옵션을 편집할 수 있습니다. 팁 : 거래 스윙 및 추세 브레이크 아웃 방향. 프랙탈, renko 막대 및 볼린저 밴드는 정확도와 수익성을 향상시킬 수 있습니다. 각도 선의 발산 접근법을 사용하여 높고 낮음을 찾을 수 있습니다. 이 지표는 지지 저항, 공급 수요 지표에 대한 추가 확인으로 사용할 수 있습니다. Ma 기울기 정보는 추세 방향으로 입력하고 종료점을 갖는 데 매우 유용합니다. 외환, 주식, 지수에서 작동합니다. PushNotifications / Email / SoundAlerts / PopUpAlerts로 알림을 받을 수
ZLMA Trend Candles indicator uses an enhanced Zero-Lag Moving Average to highlight key trend shifts, repainting candles in real time. It reacts faster than traditional moving averages, helping you spot potential market turns earlier. Gain clear entry and exit signals and filter out market noise with ease! This product is also available for MetaTrader 5 =>  https://www.mql5.com/en/market/product/129278 1. What Is ZLMA Trend Candles? ZLMA Trend Candles is a MetaTrader 4/5 indicator based on the Z
ZhiBiMACD MT4
Qiuyang Zheng
4.5 (2)
This is a unique MACD indicator that is more accurate and easy to use than traditional MACD. It is suitable for any chart cycle and is suitable for any market variety. The red column is the (Buy) band signal, and the blue column is the (Sell) band signal. The yellow and green lines are trend lines, and the two lines never cross. Buy: In the blue column, look at the green line up through the middle 0 axis. Sell: In the red column, look at the yellow line down the middle 0 axis. The MACD's de
Laser Trend
Nicolas Zouein
The trend is your friend! This is what this indicator is all about. Follow this famous saying and be safe. Characteristics: Buy/Sell signals fixed on the close of a bar. Works on all symbols and all timeframes. Clear visual market trend laser line, Buy/Sell signal arrows, market strength meter, TP1 & TP2 boxes. Visual signals when to enter, when to exit the market. No repainting. Compatible with Flexible EA for trading automation. (Ask for a free set file optimized to perform 2010-2018) Parame
Mr Beast Candlestick alerts
Luis Mariano Vazquez Marcos
Indicador "Candlestick Alert Pro" para MetaTrader: Maximiza tu Trading con Alertas de Patrones de Velas El indicador "Candlestick Alert Pro" es una herramienta esencial para traders que desean potenciar su análisis técnico, identificando patrones de velas clave y recibiendo alertas estratégicas en tiempo real. Compatible con MetaTrader, este indicador proporciona una visión detallada de la acción del precio, permitiendo decisiones informadas y oportunas. Características Destacadas: Identificació
이 제품의 구매자들이 또한 구매함
Gann Made Easy
Oleg Rodin
4.83 (162)
Gann Made Easy 는 mr.의 이론을 사용하여 최고의 거래 원칙을 기반으로 하는 전문적이고 사용하기 쉬운 Forex 거래 시스템입니다. W.D. 간. 이 표시기는 Stop Loss 및 Take Profit Levels를 포함하여 정확한 BUY 및 SELL 신호를 제공합니다. PUSH 알림을 사용하여 이동 중에도 거래할 수 있습니다. 구매 후 거래 방법 안내 및 유용한 추가 지표를 무료로 받으시려면 저에게 연락주세요! 아마도 Gann 거래 방법에 대해 이미 여러 번 들었을 것입니다. 일반적으로 Gann의 이론은 초보자 거래자뿐만 아니라 이미 거래 경험이 있는 사람들에게도 매우 복잡한 것입니다. Gann의 거래 방식은 이론적으로 적용하기 쉽지 않기 때문입니다. 나는 그 지식을 연마하고 Forex 지표에 최고의 원칙을 적용하기 위해 몇 년을 보냈습니다. 표시기는 적용하기가 매우 쉽습니다. 차트에 첨부하고 간단한 거래 권장 사항을 따르기만 하면 됩니다. 지표는 지속적으로 시장 분석
The Propfolio Master Suite is the ultimate all-in-one analytical workstation for professional traders. Combining the power of the Beat The Market Maker (BTMM) methodology, Smart Money Concepts (SND/Liquidity), and Advanced Volume Profile, this suite replaces multiple different indicators with one optimized engine. Monitor up to 14 pairs simultaneously from a single chart, instantly identify market cycles, and seamlessly map institutional footprints with the click of a button. The Command Center
M1 Sniper
Oleg Rodin
5 (23)
M1 SNIPER 는 사용하기 쉬운 거래 지표 시스템입니다. M1 시간대에 맞춰 설계된 화살표 지표입니다. 이 지표는 M1 시간대 스캘핑을 위한 단독 시스템으로 사용할 수 있으며, 기존 거래 시스템의 일부로도 사용할 수 있습니다. 이 거래 시스템은 M1 시간대 거래용으로 특별히 설계되었지만, 다른 시간대에도 사용할 수 있습니다. 원래는 XAUUSD와 BTCUSD 거래를 위해 이 방법을 설계했지만, 다른 시장 거래에도 유용하다는 것을 알게 되었습니다. 이 지표의 신호는 추세 방향과 반대로 거래될 수 있습니다. 저는 지표의 신호를 활용하여 양방향으로 거래할 수 있도록 돕는 특별한 거래 기법을 알려드립니다. 이 방법은 특별한 동적 지지선과 저항선 가격 영역을 활용하는 것을 기반으로 합니다. 구매하시면 M1 SNIPER 화살표 지표를 바로 다운로드하실 수 있습니다. 또한, 아래 스크린샷에 표시된 Apollo Dynamic SR 지표는 M1 SNIPER 도구를 사용하는 모든 사용자에게 무료로
PZ Harmonacci Patterns
PZ TRADING SLU
3.17 (6)
Trade smarter, not harder: Empower your trading with Harmonacci Patterns This is arguably the most complete harmonic price formation auto-recognition indicator you can find for the MetaTrader Platform. It detects 19 different patterns, takes fibonacci projections as seriously as you do, displays the Potential Reversal Zone (PRZ) and finds suitable stop-loss and take-profit levels. [ Installation Guide | Update Guide | Troubleshooting | FAQ | All Products  ] It detects 19 different harmonic pric
Auto Optimized Parabolic RSI: 고급 3D 모멘텀 엔진 대부분의 개인 투자자용 보조지표는 시장의 변동성이 변하는 순간 무용지물이 되는 정적인 입력값에 의존하기 때문에 실패합니다. Auto Optimized Parabolic RSI는 자체적인 수학적 우위를 지속적으로 재계산하여 "보조지표 노후화" 문제를 해결하며, 기관급 퀀트 트레이딩의 적응력을 귀하의 MT5 터미널에 직접 제공합니다. 핵심 이점: 맞춤형 인메모리 3D 최적화   표준 자동 최적화 도구들은 일반적인 보조지표 호출로 터미널에 과부하를 일으켜 MT5 플랫폼을 멈추게 하는 경우가 많습니다. 이 도구는 이러한 병목 현상을 완전히 우회합니다. 맞춤형 네이티브 RAM 기반 계산기로 구축된 내부 엔진은 차트를 로드하거나 타임프레임을 변경할 때마다 빛처럼 빠른 3D 그리드 검색을 실행합니다. RSI 기간(주기), SAR 스텝(가속도) 및 SAR 최대치(속도 제한)를 동시에 스캔하여 플랫폼 지연 없이 수만 개의
Scalper Inside PRO
Alexey Minkov
4.74 (69)
Scalper Inside PRO Scalper Inside PRO is an intraday trend and scalping indicator for MetaTrader 4 that uses an exclusive algorithm to quickly detect market direction and key target levels. It automatically calculates entry, exit and multiple profit targets, and shows detailed performance statistics so you can see how different instruments and strategies performed. This helps you choose the most suitable trading instruments for the current market conditions. Additionally, you can easily integrat
PRO Renko System
Oleg Rodin
5 (30)
PRO Renko System 은 RENKO 차트 거래를 위해 특별히 고안된 매우 정확한 거래 시스템입니다. 이것은 다양한 거래 상품에 적용될 수있는 보편적 인 시스템입니다. 체계는 효과적으로 당신에게 정확한 반전 신호에 접근을 주는 소위 시장 소음을 중화합니다. 이 표시기는 사용하기가 매우 쉽고 신호 생성을 담당하는 매개 변수가 하나만 있습니다. 당신은 쉽게 당신의 선택의 어떤 무역 계기에 공구를 적응시킬 수 있고 renko 막대기의 크기. 나는 항상 당신이 내 소프트웨어로 수익성있게 거래 할 수 있도록 추가 지원을 제공 할 준비가되어 있습니다! 나는 당신에게 행복하고 수익성있는 거래를 기원합니다! 구매 후 저에게 연락하십시오! 내 렌코 차트 생성기를 보내드립니다. 또한 내 개인 권장 사항 및 시스템의 다른 모듈을 무료로 공유 할 것입니다!
Quants HL Break
Ferhat Mutlu
5 (2)
LH 및 HL 브레이크아웃을 찾기 위한 순수 가격 조치에 의한 고급 계산. 그것은 당신에게 시장에서 큰 반전 포인트를 줄 것입니다.LH 및 HL 신호는 traingle 브레이크 아웃에도 사용할 수 있습니다. 브레이크 아웃이 발생하면 강한 반전을 나타냅니다. 이동 평균에 대한 좋은 필터입니다. 추세 지표와 함께 사용하는 것이 좋습니다. 지원 및 저항, 공급 수요 지표에 대한 추가 확인으로 사용할 수 있습니다. 자세한 내용은 다음 외환 스레드에서 찾을 수 있습니다. 표시기가 다시 칠해지지 않습니다. Buffers :   SetIndexBuffer ( 0 ,UpBar);      SetIndexBuffer ( 1 ,UpBar2);           SetIndexBuffer ( 2 ,DnBar);      SetIndexBuffer ( 3 ,DnBar2);           SetIndexBuffer ( 4 ,UpBarTop);      SetIndexBuffer ( 5 ,UpBa
Quantum Breakout Indicator PRO
Bogdan Ion Puscasu
4.96 (26)
소개       Quantum Breakout PRO   , 브레이크아웃 존 거래 방식을 변화시키는 획기적인 MQL5 지표! 13년 이상의 거래 경험을 가진 숙련된 트레이더 팀이 개발한   Quantum Breakout PRO는   혁신적이고 역동적인 브레이크아웃 영역 전략으로 거래 여정을 새로운 차원으로 끌어올리도록 설계되었습니다. Quantum Breakout Indicator는 5개의 이익 목표 영역이 있는 브레이크아웃 영역의 신호 화살표와 브레이크아웃 상자를 기반으로 한 손절 제안을 제공합니다. 초보자 거래자와 전문 거래자 모두에게 적합합니다. Quantum EA 채널:       여기를 클릭하세요 MT5 버전 :   여기를 클릭하세요 중요한! 구매 후 설치 매뉴얼을 받으려면 개인 메시지를 보내주십시오. 추천: 기간: M15 통화쌍: GBPJPY, EURJPY, USDJPY,NZDUSD, XAUUSD 계정 유형: 스프레드가 매우 낮은 ECN, Raw 또는 Razo
RFI levels PRO
Roman Podpora
5 (1)
이 지표는 추세 반전 지점과 가격 반등 영역을 정확하게 보여줍니다.       주요 투자자들   . 새로운 트렌드가 형성되는 곳을 파악하고 최대한 정확하게 의사결정을 내리며 모든 거래를 완벽하게 통제합니다. TREND LINES PRO   지표와 함께 사용할 때 최대의 잠재력을 발휘합니다.  VERSION MT5 지표가 보여주는 내용: 새로운 추세의 시작 시 활성화되는 반전 구조 및 반전 수준. 최소한의 위험 대비 수익률을 갖는 이익 실현   (TAKE PROFIT)   및   손절매(STOP LOSS)   레벨 표시       RR 1:2   . 지능형 손실 감소 로직이 적용된 손절매 기능. 지정된 지표에서 두 가지 추세 유형에 대한 반전 패턴을 표시합니다. 지표: 트렌드를 따라   트렌드 라인 프로   (글로벌 트렌드 변화) 트렌드 프로   (빠른 트렌드 변화) 간단하고 효과적입니다       스캐너       실시간 추세 (신규). 다중 시간 프레임 도구 필터링. 표시하다  
Apollo SR Master
Oleg Rodin
5 (2)
Apollo SR Master는 지지/저항 구간에서의 거래를 더욱 쉽고 안정적으로 만들어 주는 특수 기능을 갖춘 지지/저항 지표입니다. 이 지표는 지역 가격의 고점과 저점을 감지하여 시간 지연 없이 실시간으로 지지/저항 구간을 계산합니다. 새롭게 형성된 저항 구간을 확인하기 위해 지표는 해당 저항 구간을 실제 매도 또는 매수 신호로 활용할 수 있음을 나타내는 특수 신호를 표시합니다. 이 경우, 저항 구간의 강도가 높아지고, 따라서 저항 구간에서의 성공적인 거래 가능성도 높아집니다. 이것이 바로 이 지표의 핵심 아이디어입니다. SR 존은 손절매와 이익실현을 더욱 쉽게 할 수 있도록 해줍니다. 신호 방향에 따라 SR 존 위 또는 아래 공간을 손절매로 활용할 수 있습니다. 또한, 반대쪽 SR 존은 잠재적 이익실현 영역으로 활용할 수 있습니다. 또한 Apollo SR Master 지표를 사용하는 모든 사용자에게 "Apollo Price Action System" 지표를 무료로 제공합니다.
이 지표를 구매하면 제 프로페셔널 트레이드 매니저를 무료로 드립니다. 우선 이 거래 시스템이 리페인팅, 리드로잉 및 레이그 인디케이터가 아니라는 점을 강조하는 것이 중요합니다. 이는 수동 및 로봇 거래 모두에 이상적인 것으로 만듭니다. 온라인 강좌, 설명서 및 프리셋 다운로드. "스마트 트렌드 트레이딩 시스템 MT5"은 새로운 및 경험이 풍부한 트레이더를 위해 맞춤형으로 제작된 종합적인 거래 솔루션입니다. 10개 이상의 프리미엄 인디케이터를 결합하고 7개 이상의 견고한 거래 전략을 특징으로 하여 다양한 시장 조건에 대한 다목적 선택이 가능합니다. 트렌드 추종 전략: 효과적인 트렌드 추이를 타기 위한 정확한 진입 및 손절 관리를 제공합니다. 반전 전략: 잠재적인 트렌드 반전을 식별하여 트레이더가 범위 시장을 활용할 수 있게 합니다. 스캘핑 전략: 빠르고 정확한 데이 트레이딩 및 단기 거래를 위해 설계되었습니다. 안정성: 모든 인디케이터가 리페인팅, 리드로잉 및 레이그가 아니므로 신뢰
Advanced Currency Strength28 Indicator
Bernhard Schweigert
4.91 (657)
현재 40% 할인 초보자 또는 전문가 트레이더를 위한 최고의 솔루션! 이 지표는 우리가 독점 기능과 새로운 공식을 통합했기 때문에 독특하고 고품질이며 저렴한 거래 도구입니다. 단 하나의 차트로 28 Forex 쌍의 통화 강도를 읽을 수 있습니다! 새로운 추세 또는 스캘핑 기회의 정확한 트리거 포인트를 정확히 찾아낼 수 있기 때문에 거래가 어떻게 개선될지 상상해 보십시오. 사용 설명서: 여기를 클릭  https://www.mql5.com/en/blogs/post/697384 그것이 첫 번째, 원본입니다! 쓸모없는 지망생 클론을 사지 마십시오. 더 스페셜  강력한 통화 모멘텀을 보여주는 하위 창의 화살표 GAP가 거래를 안내합니다! 기본 또는 호가 통화가 과매도/과매도 영역(외부 시장 피보나치 수준)에 있을 때 개별 차트의 기본 창에 경고 표시가 나타납니다. 통화 강도가 외부 범위에서 떨어질 때 풀백/반전 경고. 교차 패턴의 특별 경고 추세를 빠르게 볼 수 있는 다중 시간
GoldRush Trend Arrow Signal
Kirk Lee Holloway
5 (2)
GoldRush 트렌드 화살표 신호 GoldRush 트렌드 화살표 신호 지표는 XAU/USD 시장에서 고속 단기 스캘핑 트레이더를 위해 설계된 정밀한 실시간 트렌드 분석을 제공합니다. 1분 시간대에 특화되어 설계된 이 도구는 명확한 진입점을 표시하는 방향성 화살표를 제공하여 스캘퍼들이 변동성이 높은 시장 환경에서도 자신 있게 거래할 수 있도록 합니다. 이 지표는 PRIMARY 및 SECONDARY 경고 화살표로 구성됩니다. PRIMARY 신호는 추세 방향의 변화를 나타내는 흰색과 검은색 방향성 화살표이며, SECONDARY 신호는 PRIMARY 화살표가 지시하는 방향을 확인하고 잠재적인 거래 진입점을 표시하는 파란색과 빨간색 화살표입니다. 참고: 추세 방향이 변경된 후 PRIMARY 경고 화살표가 단 하나만 표시될 경우, 다수의 SECONDARY 파란색/빨간색 화살표가 표시될 수 있음을 유의해야 합니다. SECONDARY 신호는 신호 기준을 충족하는 어떤 캔들 이후에도 표시
Day Trader Master
Oleg Rodin
5 (15)
Day Trader Master 는 데이 트레이더를 위한 완벽한 거래 시스템입니다. 시스템은 두 개의 지표로 구성됩니다. 하나의 지표는 매수 및 매도를 위한 화살표 신호입니다. 얻을 수 있는 화살표 표시기입니다. 2차 지표를 무료로 드립니다. 두 번째 지표는 이러한 화살표와 함께 사용하도록 특별히 설계된 추세 지표입니다. 표시기는 반복하지 않고 늦지 않습니다! 이 시스템을 사용하는 것은 매우 간단합니다. 2색 선으로 표시되는 현재 추세 방향의 화살표 신호를 따라가기만 하면 됩니다. 파란색은 구매 추세입니다. 빨간색은 판매 추세입니다. 파란색 화살표는 매수 신호입니다. 빨간색 화살표는 매도 신호입니다. 추세선의 색상과 일치하려면 화살표의 색상과 신호의 방향이 필요합니다. 화살표 표시기는 주로 시간 간격 M5 및 M15에서 일중 거래를 위해 만들어졌습니다. 그러나 기술적으로 시스템은 다른 시간 간격으로 사용할 수 있습니다. 표시기에는 PUSH 메시지 기능이 있는 팝업 경고가 장착되어 있
Market Structure Patterns MT4
Samuel Manoel De Souza
5 (18)
Market Structure Patterns   is an indicator based on   smart money concepts   that displays   SMC/ICT   elements that can take your trading decisions to the next level. Take advantage of the   alerts ,   push notifications   and   email messages   to keep informed from when an element is formed on the chart, the price crosses a level and/or enters in a box/zone. Developers can access the values of the elements of the indicator using the   global variables  what allows the automation of trading d
Advanced Supply Demand
Bernhard Schweigert
4.91 (300)
현재 40% 할인! 초보자나 전문 트레이더를 위한 최고의 솔루션! 이 보조지표는 우리가 다수의 독창적 기능과 새로운 공식을 통합한 독특하고 고품질이며 저렴한 거래 도구입니다. 이 업데이트를 통해 이중 시간대를 표시할 수 있습니다. 더 높은 TF를 표시할 수 있을 뿐만 아니라 차트 TF와 더 높은 TF 모두를 표시할 수 있습니다: 중첩 영역 표시. 모든 Supply Demand 트레이더들이 좋아할 것입니다. :) 중요한 정보 공개 Advanced Supply Demand의 잠재력을 극대화하려면 다음을 방문하십시오. https://www.mql5.com/ko/blogs/post/720245   진입 또는 목표의 명확한 트리거 포인트를 정확히 찾아냄으로 해서 거래가 어떻게 개선될지 상상해 보십시오. 새로운 알고리즘을 기반으로 매수자와 매도자 간의 잠재적인 불균형을 훨씬 더 쉽게 분간할 수 있습니다. 왜냐하면 가장 강한 공급영역과 가장 강한 수요 영역과 과거에 어떻게 진행 되었는지를(이전
PZ Turning Points MT4
PZ TRADING SLU
1 (1)
Identify key turning points with reliable fractal analysis This indicator examines the price structure of fractals of different periods to determine possible reversal points in the market, providing timing to positional traders that already have a fundamental or technical valuation model. Unlike its younger brother, Reversal Fractals , this indicator won't miss reversals because of the period selected, and will find reversal fractals on a zig-zag fashion, ignoring those reversals which do not
Dynamic Scalper System
Vitalyi Belyh
5 (1)
" Dynamic Scalper System " 지표는 추세 파동 내에서 스캘핑 방식으로 거래하도록 설계되었습니다. 주요 통화쌍 및 금에서 테스트되었으며, 다른 거래 상품과의 호환성이 가능합니다. 추가적인 가격 변동 지원을 통해 추세에 따라 단기 포지션 진입 신호를 제공합니다. 지표의 원리 큰 화살표는 추세 방향을 결정합니다. 작은 화살표 형태의 스캘핑 신호를 생성하는 알고리즘은 추세 파동 내에서 작동합니다. 빨간색 화살표는 상승 방향을, 파란색 화살표는 하락 방향을 나타냅니다. 민감한 가격 변동선은 추세 방향으로 그려지며, 작은 화살표의 신호와 함께 작용합니다. 신호는 다음과 같이 작동합니다. 적절한 시점에 선이 나타나면 진입 신호가 형성되고, 선이 있는 동안 미결제 포지션을 유지하며, 완료되면 거래를 종료합니다. 권장되는 작업 시간대는 M1~H4입니다. 화살표는 현재 캔들에 형성되며, 다음 캔들이 이미 시작되었더라도 이전 캔들의 화살표는 다시 그려지지 않습니다. 입력 매개
외환 거래를 한다면, 통화 강도와 통화쌍 상관관계에 대한 상세한 정보를 아는 것은 거래 실력을 한 단계 끌어올리는 데 큰 도움이 됩니다. 상관관계를 분석하면 리스크를 절반으로 줄일 수 있고, 강도 분석을 통해 수익을 극대화할 수 있습니다. 이 지표는 통화 강도 분석과 통화쌍 상관관계를 결합하여 가장 적합한 통화쌍을 선택할 수 있도록 도와주는 하이브리드 접근 방식을 제공합니다. 통화 강도 분석 활용 방법 예를 들어, 당신의 거래 전략이 AUD/JPY 매수 기회를 제공한다고 가정해 봅시다. 하지만 KT 통화 강도 분석을 통해 JPY가 AUD보다 강해지고 있다는 것을 발견했다면, 이 거래는 손실로 끝날 가능성이 높습니다. 이 지표를 사용하면 이러한 손실을 쉽게 피할 수 있습니다. 통화쌍 상관관계 활용 방법 또 다른 예로, 거래 전략이 NZD/USD와 GBP/JPY 두 통화쌍 모두에 대해 매도 기회를 제공한다고 가정해 봅시다. KT 통화쌍 상관관계 분석을 사용하면 이 두 통화쌍 간 상관
현재 26% 할인!! 이 지표는 두 주요 지표( Advanced Currency Strength 28   &  Advanced Currency IMPULSE with ALERT )의 슈퍼 조합입니다. TICK-UNITS에 대한 통화 강도 값과 28개 Forex 쌍에 대한 경고 신호를 보여줍니다. 11개의 다른 틱 단위를 사용할 수 있습니다. 1, 2, 3, 4, 5, 6, 10, 12, 15, 20, 30초입니다. 두 번째 타이머 내에 최소 1틱이 있으면 하위 창의 Tick-Unit 막대가 표시되고 왼쪽으로 이동합니다. 단 하나의 차트로 28 Forex 페어를 스캘핑할 수 있습니다! 스캘핑 기회의 정확한 트리거 포인트를 정확히 찾아낼 수 있기 때문에 스캘핑이 어떻게 개선될지 상상해 보십시오. 그것은 1분보다 낮은 기간에 작동하는 시장의 첫 번째 통화 강도 지표입니다! 그것은 시장에 빠르게 들어오고 나가고 시장에서 작은 핍을 잘라내기를 원하는 빠른 스캘퍼를 위한 것입니다. 사
KURAMA GOLD SIGNAL PRO (MT4) — 7층 필터, 자동 TP/SL, 품질 점수를 탑재한 XAUUSD 완벽 트레이딩 시스템 리페인트 없음. 리드로우 없음. 지연 없음. 모든 신호는 영구적입니다. 보이는 것이 그대로입니다. 보너스: 영구 라이선스 구매자에게 AI Zone Radar ($59 상당) + 전체 PDF 매뉴얼을 무료 제공. 구매 후 메시지를 보내주세요. AI Zone Radar: https://www.mql5.com/en/market/product/175834 트레이더의 신뢰: 활발한 골드 트레이더 커뮤니티에서 이미 사용 중. 정확도와 사용 편의성으로 호평을 받고 있습니다. 당신의 문제 — 그리고 해결책 골드가 하루 $30-50 움직인다는 걸 알고 있죠. 여기서 돈을 벌 수 있다는 것도. 하지만: - 너무 일찍 진입해서 가격이 당신 방향으로 가기 전에 $10 손절당함 - MA 터치마다 진입하지만 절반은 실패 - TP/SL 시스템이 없어서 너무
Master head and shoulders patterns for better trading decisions A head and shoulders pattern is a chart formation that resembles a baseline with three peaks, the outside two are close in height and the middle is highest. It predicts a bullish-to-bearish trend reversal and is believed to be one of the most reliable trend reversal patterns. It is one of several top patterns that signal, with varying degrees of accuracy, that a trend is nearing its end. [ Installation Guide | Update Guide | Trouble
Atomic Analyst
Issam Kassas
5 (6)
우선적으로 언급할 점은이 거래 지표가 다시 그리지 않고 지연되지 않으며 이를 통해 수동 및 로봇 거래 모두에 이상적이라는 점입니다. 사용자 매뉴얼: 설정, 입력 및 전략. Atomic Analyst는 가격의 강도와 모멘텀을 활용하여 시장에서 더 나은 이점을 찾는 PA Price Action Indicator입니다. 고급 필터를 장착하여 잡음과 거짓 신호를 제거하고 거래 잠재력을 높이는 데 도움이 됩니다. 복잡한 지표의 다중 레이어를 사용하여 Atomic Analyst는 차트를 스캔하고 복잡한 수학적 계산을 간단한 신호와 색상으로 변환하여 초보 트레이더가 이해하고 일관된 거래 결정을 내릴 수 있도록합니다. "Atomic Analyst"는 새로운 및 경험이 풍부한 트레이더를위한 종합적인 거래 솔루션입니다. 프리미엄 지표와 최고 수준의 기능을 하나의 거래 전략에 결합하여 모든 종류의 트레이더에 대한 다재다능한 선택지가되었습니다. 인트라데이 거래 및 스캘핑 전략 : 빠르고 정확한 일일
PZ Double Top Bottom
PZ TRADING SLU
5 (1)
Trade double tops and bottoms effectively The PZ Double Top/Bottom Indicator is a technical analysis tool that helps traders identify potential price reversal patterns in the market. These patterns, known as double tops and bottoms, are characterized by two consecutive peaks or valleys in the price of an asset. Double tops and bottoms are often seen as potential reversal patterns because they can signal a change in the direction of the current trend. [ Installation Guide | Update Guide | Troubl
Gold Scalper Super
Aleksandr Makarov
5 (2)
Gold Scalper Super is an easy-to-use trading system. The indicator can be used as a standalone scalping system on the M1 time frame, as well as part of your existing trading system. Bonus: when purchasing an indicator, Trend Arrow Super is provided free of charge, write to us after purchase. The indicator 100% does not repaint!!! If a signal appears, it does not disappear! Unlike indicators with redrawing, which lead to the loss of a deposit, because they can show a signal and then remove it.
Cyclic Impulse
Vitalyi Belyh
차트를 구조화하고 주기적인 가격 변동을 식별하는 기술 지표입니다. 모든 차트에서 작업할 수 있습니다. 다양한 유형의 알림. 그래프 자체에도 추가 화살표가 있습니다. 역사를 재구성하지 않고, 촛불을 닫는 작업에 임한다. M5 이상에서 권장되는 TF입니다. 사용 및 구성이 쉬운 매개변수입니다. 매개변수가 다른 2개의 지표를 사용하는 경우, 다른 지표 없이 해당 지표만 사용할 수 있습니다. 2개의 입력 매개변수가 있습니다 주기성과 신호 지속 시간 이 2개의 매개변수는 차트 구조의 처리와 관련이 있습니다. Cyclicity - 역전 주기가 얼마나 자주 바뀌는지 조절하고 주기를 매끄럽게 합니다. Signal duration - 최소 숫자에서는 가격 움직임의 충격을 감지하고, 최대 숫자에서는 장기적 추세 움직임을 감지합니다.. --------------------------------
KuKl
IGOR KIRIANEN
The indicator is built on a non-standard Zig Zag, it draws accumulations after which if the price leaves this zone and a test of this zone occurs, then a sound signal is given and an arrow appears - after the test candle closes.The indicator does not redraw its signals, it is very easy to use, there are only three settings 1- this is the zig zag parameter 2- this is the minimum price exit from the zone 3- this is the maximum price exit from the zone. The lower the parameter for Zig Zag, the more
Trend Screener
STE S.S.COMPANY
4.79 (95)
트렌드 표시기, 트렌드 트레이딩 및 필터링을 위한 획기적인 고유 솔루션, 하나의 도구 안에 내장된 모든 중요한 트렌드 기능! Forex, 상품, 암호 화폐, 지수 및 주식과 같은 모든 기호/도구에 사용할 수 있는 100% 다시 칠하지 않는 다중 시간 프레임 및 다중 통화 표시기입니다. 기간 한정 특가: 지원 및 저항 스크리너 지표는 단 250 달러에 평생 제공됩니다. (원래 가격 65 달러) (제안 연장) Trend Screener는 차트에 점이 있는 화살표 추세 신호를 제공하는 효율적인 지표 추세 추종 지표입니다. 추세 분석기 표시기에서 사용할 수 있는 기능: 1. 트렌드 스캐너. 2. 최대 이익 분석이 있는 추세선. 3. 추세 통화 강도 측정기. 4. 경고가 있는 추세 반전 점. 5. 경고가 있는 강력한 추세 점. 6. 추세 화살표 Trend Screener Indicator가 있는 일일 분석 예, 일일 신호 성능...등은 여기에서 찾을 수 있습니다.   여기를 클릭하십시오.
Advanced UT BOT ALERTS for MT4 전문가용 다중 필터 추세 탐지 시스템|강화된 UT BOT 엔진 우리는 고품질 지표만 제공합니다. Advanced UT BOT 은 전문가용으로 설계되었으며, 안정적인 신호 로직과 안전한 계산 구조로 지연이나 잘못된 갱신을 방지합니다. 과거 신호를 다시 그리거나, 수정하거나, 삭제하지 않습니다. 모든 BUY / SELL 신호는 캔들이 마감된 후에만 생성되어 고정됩니다. 실시간 거래 중에는 리페인트가 없으며 , 캔들이 닫히는 즉시 신호가 표시됩니다. 한정 기간 할인 중 — 다음 가격은 49달러로 인상됩니다. 가격 인상 전에 지금 바로 확보하세요. 제품 개요 Advanced UT BOT ALERTS   는   UT BOT 의 핵심 로직을 기반으로 완전히 재설계된 차세대 추세 신호 시스템입니다. MT5 환경에 맞게 최적화되었으며, 다중 필터 구조, 실시간 시각화, 정밀 알림 시스템을 통합했습니다. UT Bot 지표는 원래   Yo
제작자의 제품 더 보기
FTR Multi Timeframe
Akaashi Videsh Reedoy
The FTR Multi-Timeframe indicator is a versatile tool that can add great value to your trading arsenal. This indicator is intended to be used to add confluence to your already existing trading strategy, such as, breakout & retest, supply and demand, patterns or continuation trading. FTR Multi-Timeframe  is a continuation indicator. Rules  are attached as a screenshot. Settings for Demo/Strategy Tester: Set Server_Time_Filter to false in indicator settings ( IMPORTANT! ). Tick 'Show object descr
The Auto-Breakeven RR Simple TradingPanel EA is a simple and intuitive tool that will be an asset to your trading arsenal. Have you ever missed the perfect entry because you were busy calculating the lot size? I have. Many times. Which is why I created this EA to simplify and automate risk management as much as I could. A true SET AND FORGET tool - execute your trade and walk away to prevent micromanaging your trade. This tool secures the trade at your specified Risk-to-Reward (RR) level. Tra
Supply and Demand Professional is a powerful tool suited for advanced traders! Easily see levels of supply and demand (or support and resistance) as they develop. *This is a NON-repainting indicator* How this can help you? Levels can be used for stop loss and take profit targets Automatically  identifying key levels in the market  Spotting market imbalances Better entry levels and timing of trades Volume analysis Understanding market sentiment Predicting price movements Risk management Trend co
필터:
리뷰 없음
리뷰 답변