The tip of fate
- 지표
- 버전: 1.0
- 활성화: 5

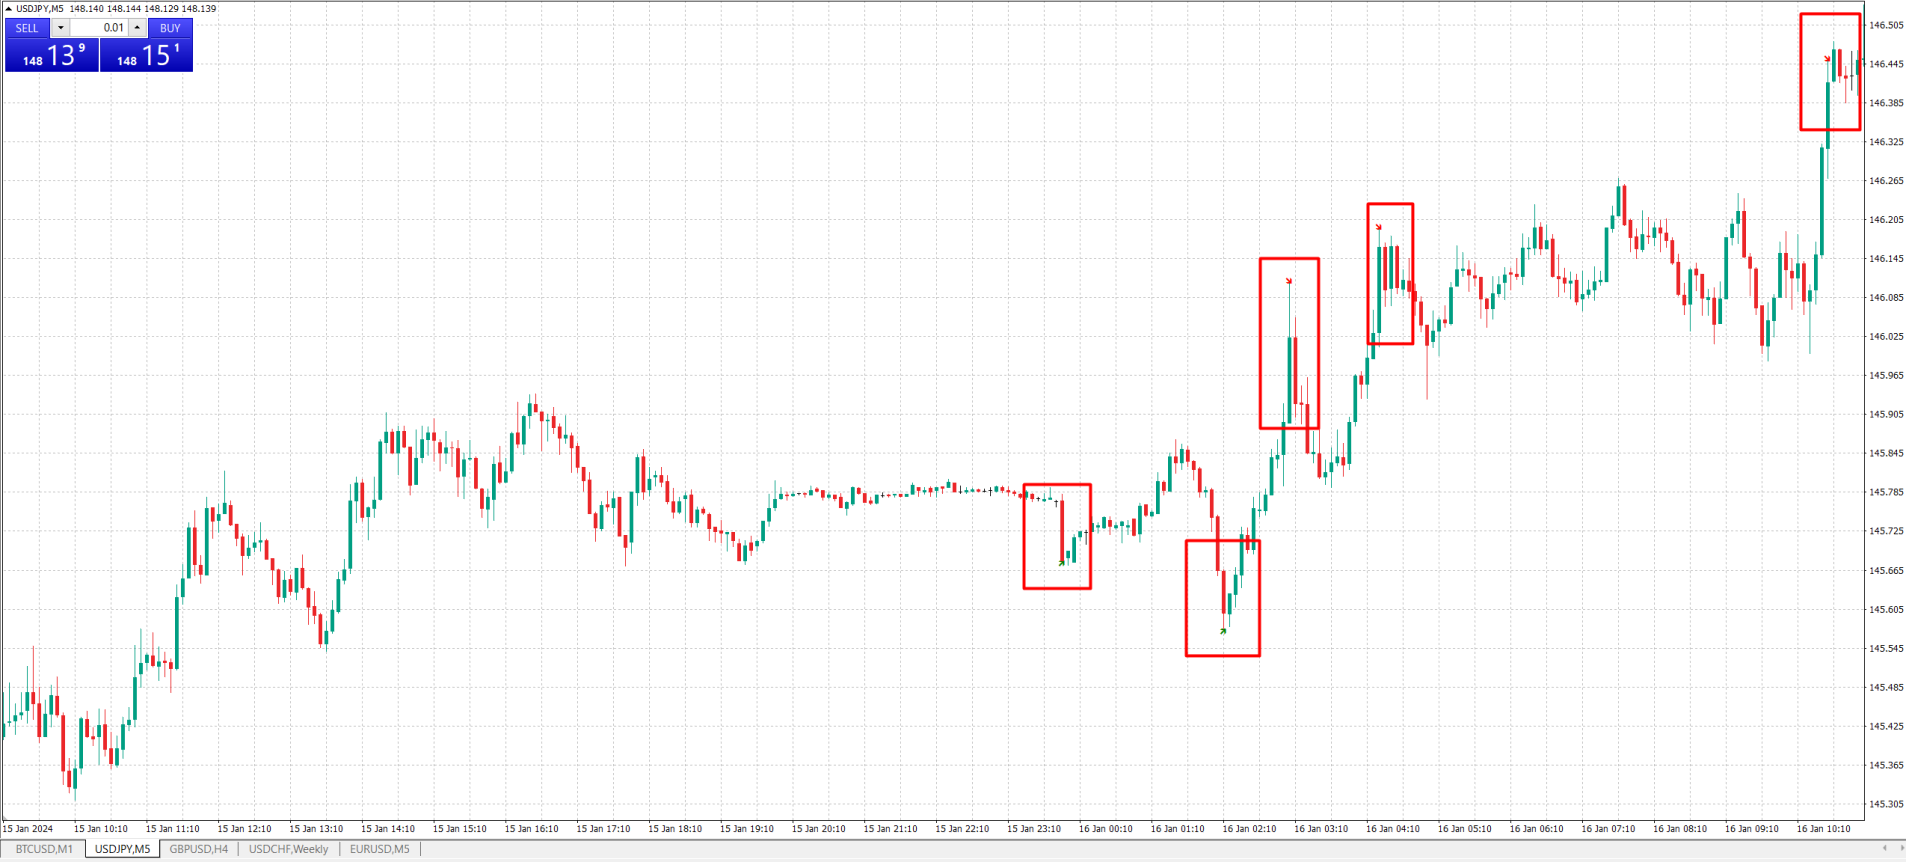
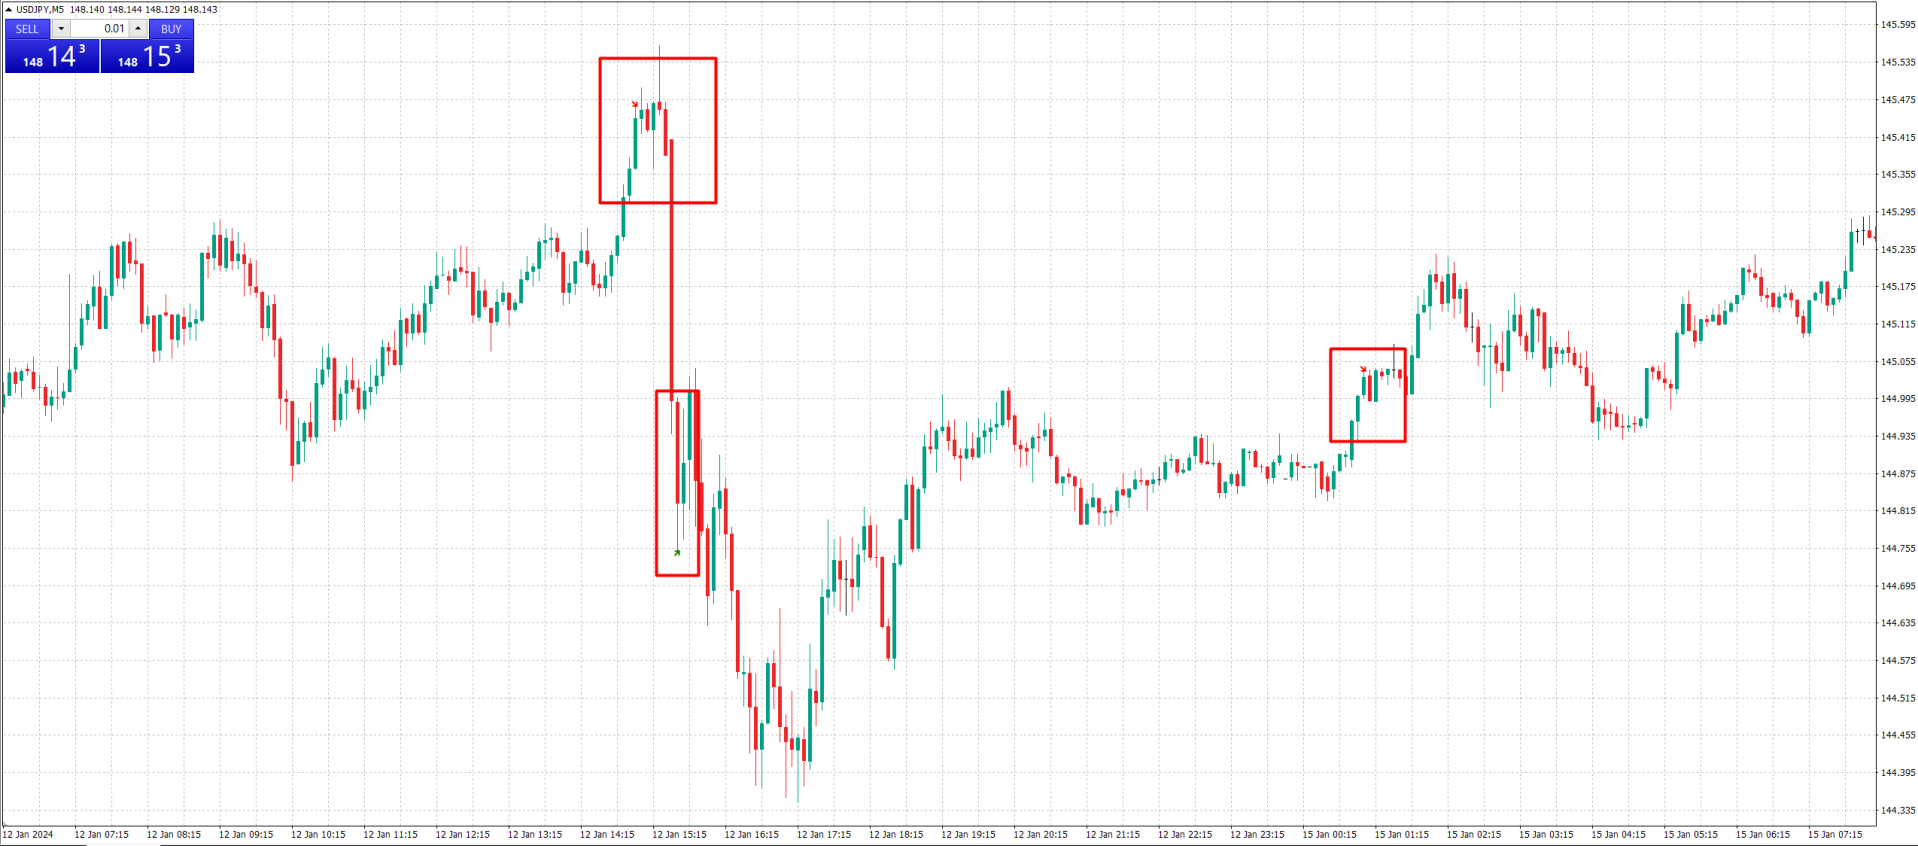
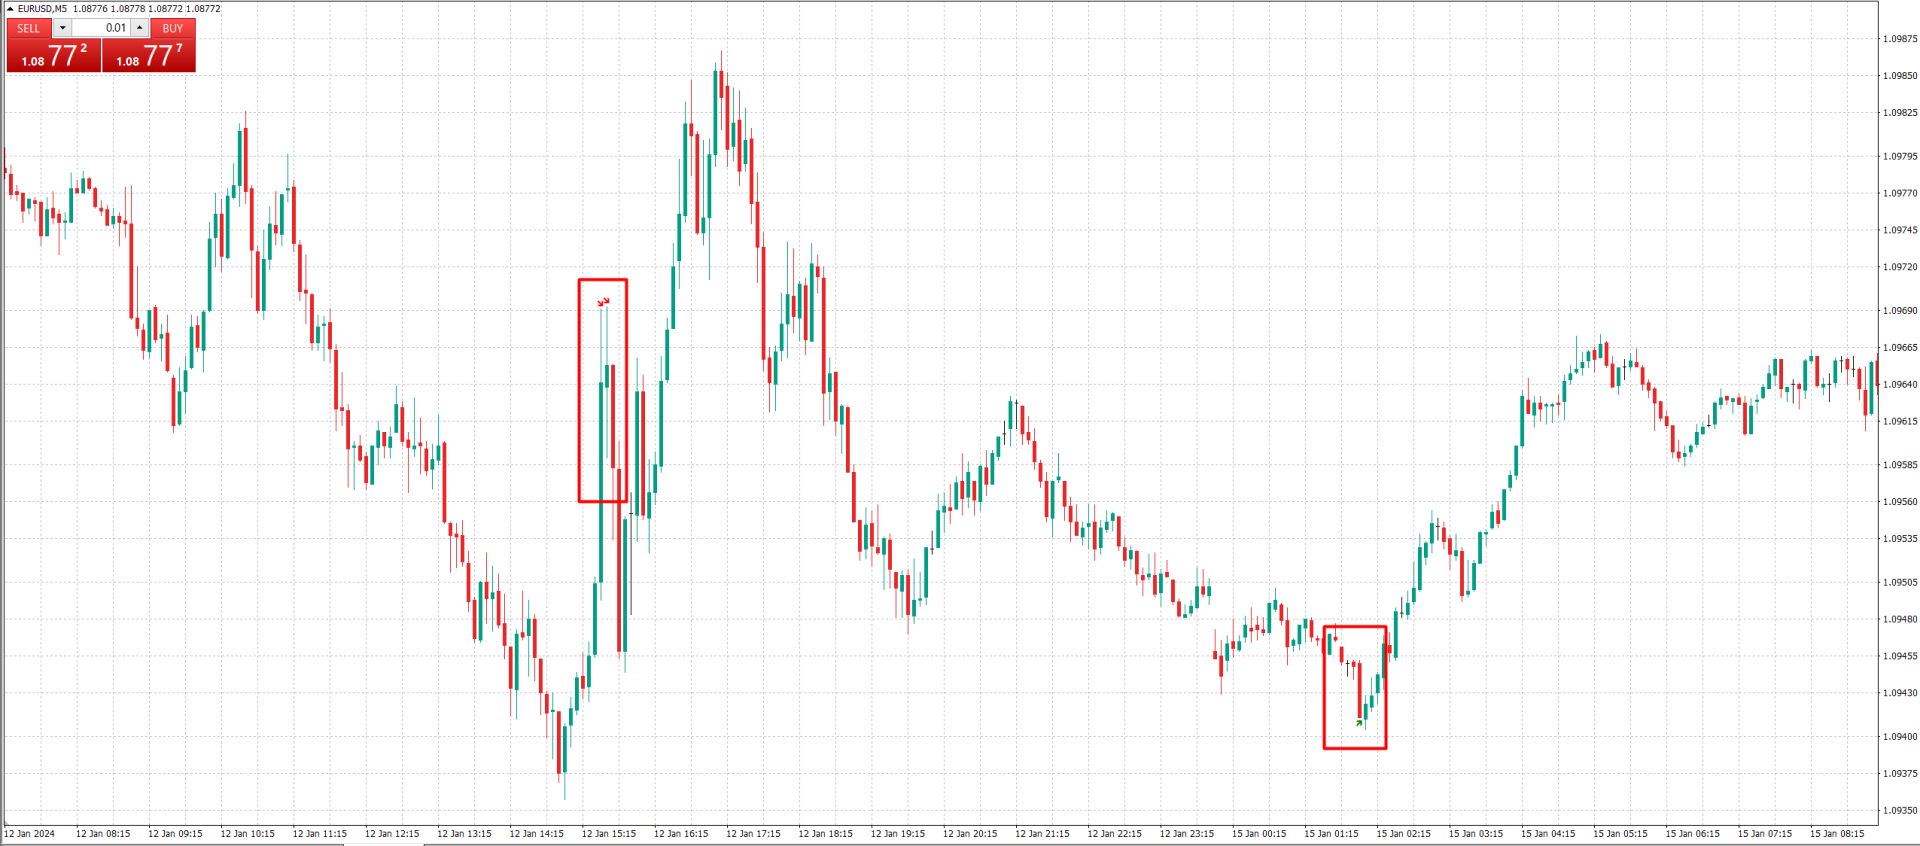
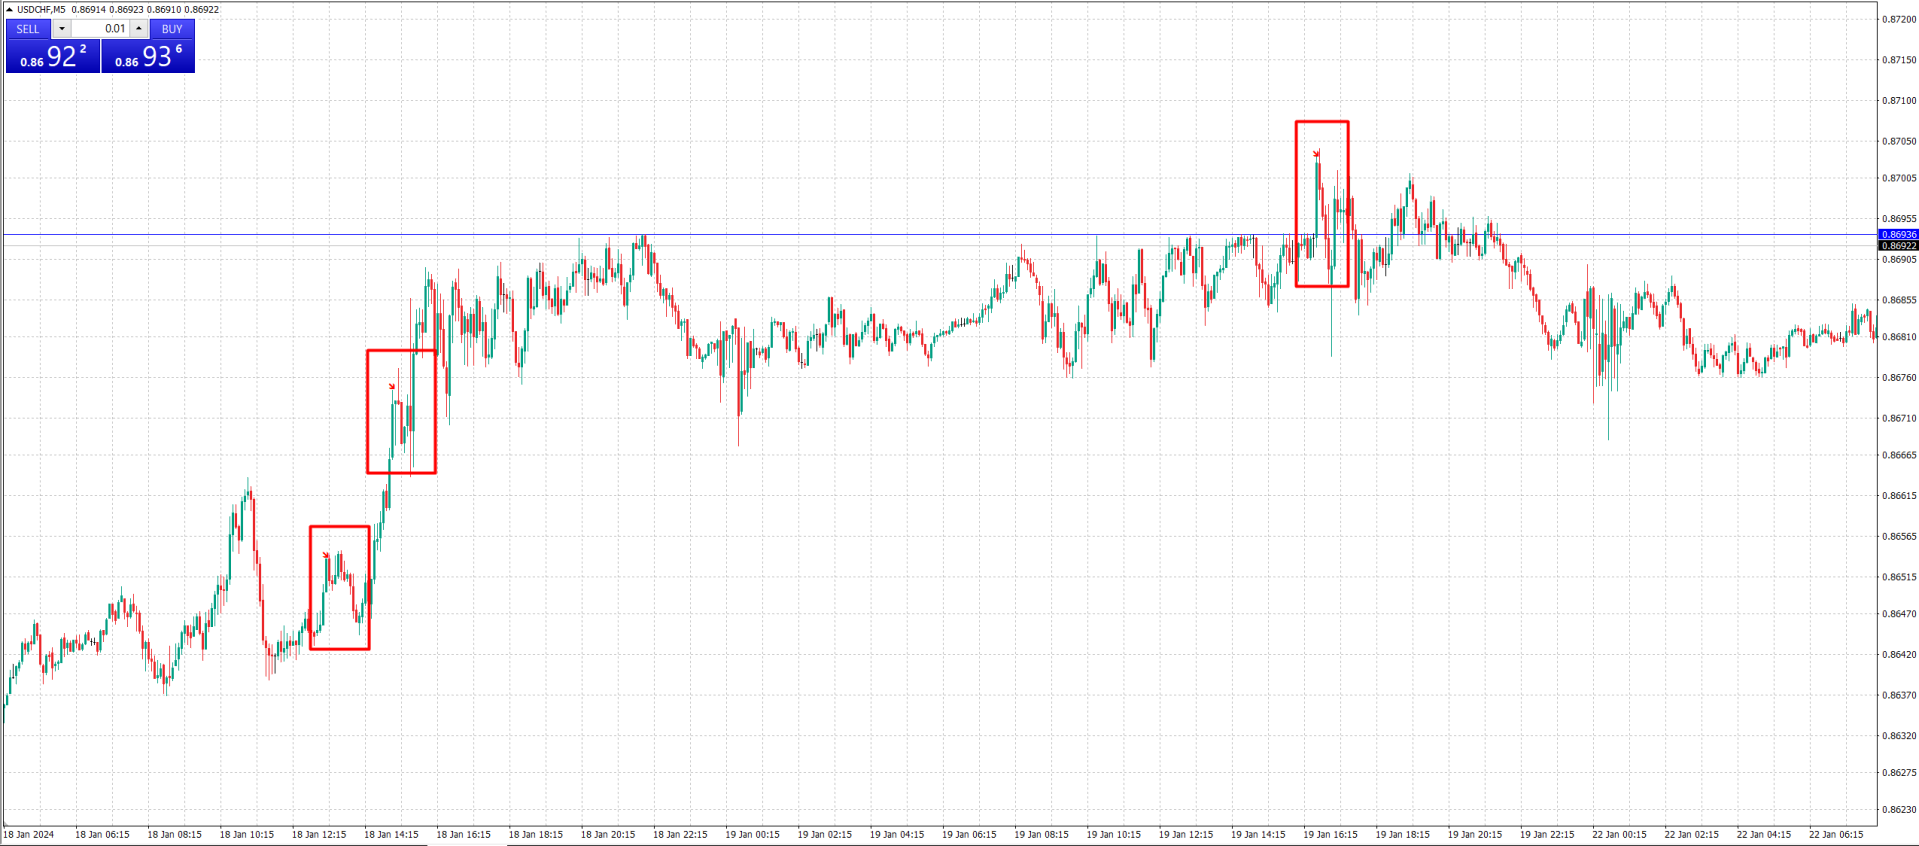
The arrow indicator without redrawing shows potential entry points into the market in the form of arrows of the appropriate color: the up arrows (usually green) suggest opening a purchase, the red down arrows suggest selling. The appearance of arrows may be accompanied by beeps. It is usually assumed to enter at the next bar after the pointer, but there may be non-standard recommendations. Arrow indicators visually "unload" the price chart and save time for analysis: no signal – no deal, if there is a reverse signal, then the current deal should be closed. It is switchers that are considered a good option for beginners who do not have serious experience in technical analysis. It should be understood that any arrow indicator is only a visual form of a signal. As a rule, such Forex indicators contain an entire trading system, process information from several technical tools and the appearance of its "arrow" is the final result of the calculation. The indicator itself evaluates how strong the signal is.