Tick Chart Indicator MT4
- 지표
-
Maksim Neimerik
 If you suddenly came to the desire to earn automatic trading then I am at your service, I will write any robot, indicator or utility in the language of MQL4 or MQL5!
 - 버전: 1.0
- 활성화: 10
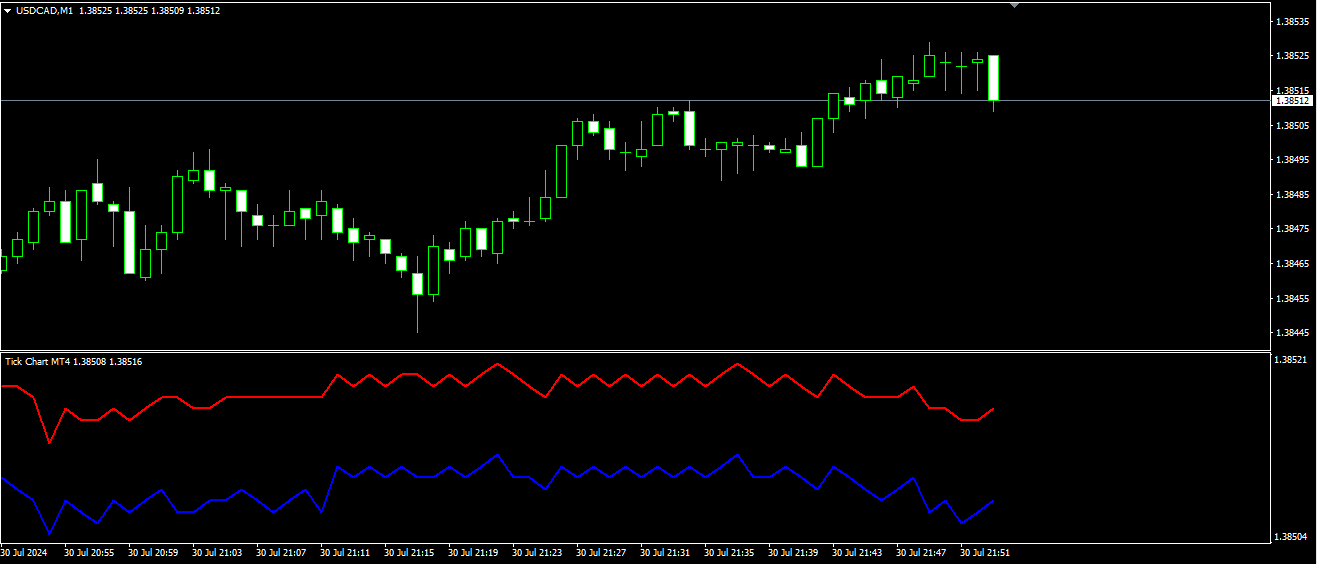
A simple indicator for plotting a tick chart.
This indicator will allow you to track the spread dynamics and the price behavior in general.
In the settings, you can select the price to display on the chart - Bid, Ask or both prices at the same time.
Tick Chart Indicator will definitely be useful when using scalping strategies.
The MT5 version is available here.
Good luck to everyone and successful trading!