Shooting Stars

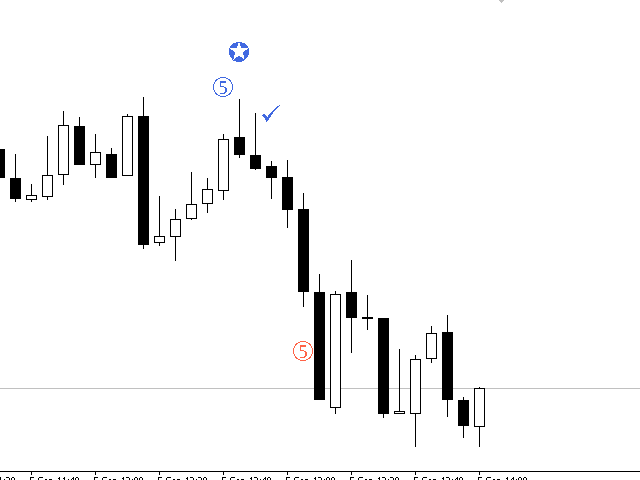
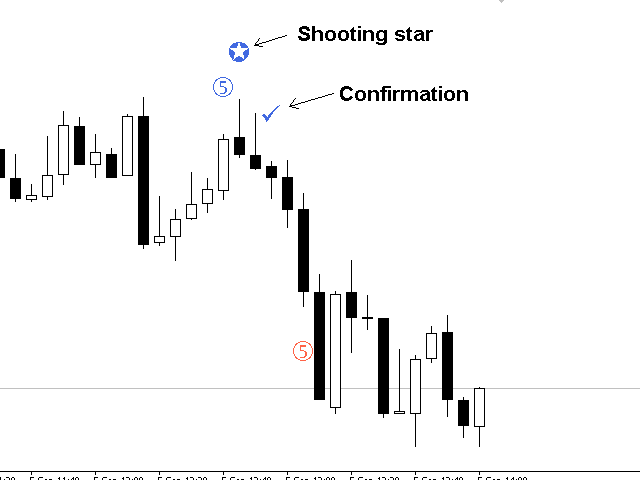
The Shooting Stars indicator is designed to search for the Shooting Star and Hanging Man patterns on charts of any currency pairs.


Features

  • Displays 5 unidirectional candles.
  • This indicator identifies the Shooting Star and Hanging Man patterns.
  • Once a pattern is identified, the indicator shows a confirmation signal.
  • It is possible to disable the alert and unnecessary graphical elements.
  • It is also possible to adjust the number of bars in history, where the graphical elements of the indicator are to be drawn (0 = all available bars).
  • There is an option to change the size of the graphical elements.

This indicator is suitable for trading any currency pairs on any timeframes.


Parameters

  • Size of the indicator label - size of the indicator's graphical label (recommended from 1 to 4).
  • The position of the indicator label (in points) - distance from a candle's High or Low to a graphical label of the indicator.
  • Alert - alert about the appearance of a new graphical label.
  • Number of history bars - the number of bars for calculating the indicator (0 - all history).
  • 5 bullish bars (on / off) - 5 consecutive bullish bars (enable/disable).
  • Shooting star (on / off) - the Shooting Star pattern (enable/disable).
  • Confirmation (on / off) - pattern confirmation (enable/disable).
  • 5 bearish bars (on / off) - 5 consecutive bearish bars (enable/disable).
  • Hanging Man (on / off) - the Hanging Man pattern (enable/disable).
  • Confirmation (on / off) - pattern confirmation (enable/disable).
추천 제품
The indicator detects and displays Shark harmonic pattern (see the screenshot). The pattern is plotted by the extreme values of the ZigZag indicator (included in the resources, no need to install). After detecting the pattern, the indicator notifies of that by a pop-up window, a mobile notification and an email. The indicator highlights the process of the pattern formation and not just the complete pattern. In the former case, it is displayed in the contour triangles. After the pattern is comple
The indicator detects and displays 3 Drives harmonic pattern (see the screenshot). The pattern is plotted by the extreme values of the ZigZag indicator (included in the resources, no need to install). After detecting the pattern, the indicator notifies of that by a pop-up window, a mobile notification and an email. The indicator highlights the process of the pattern formation and not just the complete pattern. In the former case, it is displayed in the contour triangles. After the pattern is com
Rainbow Price Visualizer
Vincent Jose Proenca
Rainbow Price Visualizer v1.21 See where the market really breathes. Turns your MT4 chart into an ultra-precise heatmap that highlights price zones favored by big players. Why it matters 300 price levels at 0.2‑pip resolution — microscopic detail. 8 visual themes (Rainbow, Fire, Ocean…) for instant readibility. Smart opacity: low noise fades, real zones pop. Lightweight rendering with automatic cleanup. Fully customizable: saturation, opacity, resolution, history depth. Bands project into the f
Minotaur Waves Signal
Leandro Bernardez Camero
Minotaur Waves 는 잠재적인 전환점을 감지하고 가격 방향 전환을 높은 정확도로 확인하기 위해 설계된 고급 시장 분석 지표입니다. 이 시스템은 Minotaur Oscillator 의 강력함과 동적인 적응 밴드 구조를 결합하여 명확하고 신뢰할 수 있는 시각적 신호를 제공함으로써 신중한 진입 결정을 돕습니다. 모든 통화 쌍에서 사용 가능하며, 특히 EURUSD, GBPUSD, USDJPY 심볼에서 M1, M5, M15, M30 타임프레임에서 최적의 성능을 발휘합니다. 최신 소식과 가이드를 확인하세요: https://www.mql5.com/en/channels/forexnewadvisor 시스템 주요 구성 요소: 동적 밴드 시스템: 실시간 모멘텀 변화를 감지하고 주요 돌파 구간을 강조 표시 Minotaur Oscillator: 모멘텀 오실레이터로 히스토그램 형태의 극값을 표시하여 전환 구간을 확인 극값 검증: +33(상단) 또는 -33(하단)의 정확한 값으로 확인된 피크에서만
Infinity Trend Pro
Yaroslav Varankin
1 (1)
This is a trend indicator without redrawing Developed instead of the binary options strategy (by the color of the Martingale candlestick) Also works well in forex trading When to open trades (binary options) A signal will appear in the place with a candle signaling the current candle It is recommended to open a deal for one candle of the current timeframe M1 and M5 When a blue dot appears, open a deal up When a red dot appears, open a trade down. How to open trades on Forex. When a signal is rec
Fractal Zig Zag
Mikhail Nazarenko
A   professional version of the ZigZag indicator for visualizing the structure of price movements by fractals. Fractal ZigZag fixes the flaws of the standard version of the ZigZag indicator MT4. It uses Price action and a unique filtering algorithm to determine fractals. Suitable for all types of trading. Ideal for trading according to the WM pattern "Sniper" strategy !!! Features Marks the place of price reversal during the formation of a new fractal with specified parameters. Suitable for al
TrendInChannel
Andriy Sydoruk
This indicator is the undisputed leader among the indicators. And for this statement there is a good reason. The indicator builds a very high quality channel in which it generates signals to enter! What is the ideal strategy for the trader, since the trader always hesitates when choosing a strategy for the job. That is, this indicator will allow you to solve the dilemma of choosing a job by trend or to the channel, since it combines these two basic concepts. Working with the indicator is very
KDJ Index 4   交易实用必备工具指标 波浪自动计算指标,通道趋势交易 完美的趋势-波浪自动计算通道计算 , MT4版本 完美的趋势-波浪自动计算通道计算 , MT5版本 本地跟单复制交易 Easy And Fast Copy , MT4版本 Easy And Fast Copy , MT5版本 本地跟单复制交易 模拟试用 Easy And Fast Copy , MT4 模拟账号运行 Easy And Fast Copy , MT5 模拟账号运行 "Cooperative QQ:556024  "  "Cooperation wechat:556024"  "Cooperative email:556024@qq.com" 强烈推荐趋势指标, 波浪的标准自动计算   和   波浪的标准自动计算MT5版本     KDJ指标又叫 随机指标 ,是一种相当新颖、实用的技术分析指标,它起先用于期货市场的分析,后被广泛用于股市的中短期趋势分析,是期货和股票市场上最常用的技术分析工具。 随机指标KDJ一般是用于股票分析的统计体系,根据统计学原理,通过一个特定的周期(常为9日、9周等)
MA on Fractals
Evgeny Belyaev
MA on Fractals is a professional trend-following indicator for MetaTrader 4 . It builds a moving average using Bill Williams' fractals. We believe that MA on Fractals is much more efficient than a standard moving average. Its combination with other indicators allows receiving more accurate trading signals. It is most suitable for M15, M30, H1 and H4. Advantages Unique indicator. Generates minimum false signals. Suitable for beginners and experienced traders. Simple and easy indicator configurat
The indicator displays the data of the Stochastic oscillator from a higher timeframe on the chart. The main and signal lines are displayed in a separate window. The stepped response is not smoothed. The indicator is useful for practicing "manual" forex trading strategies, which use the data from several screens with different timeframes of a single symbol. The indicator uses the settings that are identical to the standard ones, and a drop-down list for selecting the timeframe. Indicator Paramet
Price Magnets
Ivan Simonika
Price Magnet — Price Density and Attraction Levels Indicator Price Magnet is a professional analytical tool designed to identify key support and resistance levels based on statistical Price Density. The indicator analyzes a specified historical period and detects price levels where the market spent the most time. These zones act as “magnets,” attracting price action or forming a structural base for potential reversals. Unlike traditional Volume Profile tools, Price Magnet focuses on price-time d
Super Reversal Pattern
Parfait Mujinga Ndalika
Super Reversal Pattern Indicator Unlock the power of advanced pattern recognition with our Super Reversal Pattern Indicator. Designed for traders seeking precision and reliability, this indicator identifies one of the most effective reversal patterns in technical analysis, offering a significant edge in your trading strategy. Key Features: Non-Repainting Accuracy: Enjoy the confidence of non-repainting technology. Once a Super Reversal Pattern is detected, it remains static, providing consiste
The   Trendlines Oscillator   helps traders identify trends and momentum based on the normalized distances between the current price and the most recently detected bullish and bearish trend lines. The indicator features bullish and bearish momentum, a signal line with crossings, and multiple smoothing options. USAGE The   Trendlines Oscillator   works by systematically: Identifying pivot highs and lows. Connecting pivots to form bullish (support) and bearish (resistance) trendlines. Measuring
Auto Fibo Pro m
DMITRII GRIDASOV
"Auto FIBO Pro" Crypto_Forex 지표 - 거래에 유용한 보조 도구입니다! - 지표는 자동으로 Fibo 수준과 로컬 추세선(빨간색)을 계산하여 차트에 배치합니다. - Fibonacci 수준은 가격이 반전될 수 있는 주요 영역을 나타냅니다. - 가장 중요한 수준은 23.6%, 38.2%, 50%, 61.8%입니다. - 역전 스캘핑이나 존 그리드 거래에 사용할 수 있습니다. - Auto FIBO Pro 지표를 사용하여 현재 시스템을 개선할 수 있는 기회도 많습니다. - Info Spread Swap Display가 있습니다. 현재 Spread와 Swap이 부착된 외환 쌍을 표시합니다. - 디스플레이에는 계정 잔액, 자본 및 마진도 표시됩니다. - 차트의 어느 모서리에서나 Info Spread Swap Display를 찾을 수 있습니다. 0 - 왼쪽 상단 모서리, 1 - 오른쪽 상단, 2 - 왼쪽 하단, 3 - 오른쪽 하단. 여기를 클릭하여 고품질 트레이딩 로봇과
"Adjustable Fractals Pro"는 프랙탈 지표의 고급 버전으로, 매우 유용한 거래 도구입니다! - 알다시피 표준 프랙탈 mt4 지표에는 설정이 전혀 없습니다. 이는 거래자에게 매우 불편합니다. - Adjustable Fractals Pro는 이 문제를 해결했습니다. 필요한 모든 설정이 있습니다. - 지표의 조정 가능한 기간(권장 값 - 7 이상). - 가격의 고점/저점으로부터의 조정 가능한 거리. - 프랙탈 화살표의 조정 가능한 디자인. - Info Spread Swap Display가 있습니다. 현재 스프레드와 외환 페어의 스왑을 첨부된 위치에 표시합니다. - 디스플레이에는 계정 잔액, 자본 및 마진도 표시됩니다. - 차트의 어느 모서리에서나 Info Spread Swap Display를 찾을 수 있습니다. 0 - 왼쪽 상단 모서리, 1 - 오른쪽 상단, 2 - 왼쪽 하단, 3 - 오른쪽 하단. - 표시기에는 모바일 및 PC 알림 기능이 내장되어 있습니다. 여기를
PZ Divergence Trading
PZ TRADING SLU
5 (2)
Unlock hidden profits: accurate divergence trading for all markets Tricky to find and scarce in frequency, divergences are one of the most reliable trading scenarios. This indicator finds and scans for regular and hidden divergences automatically using your favourite oscillator. [ Installation Guide | Update Guide | Troubleshooting | FAQ | All Products ] Easy to trade Finds regular and hidden divergences Supports many well known oscillators Implements trading signals based on breakouts Display
The Range Directional Force Indicator is designed to help traders analyze market trends, reversals, and directional strength. It focuses on price movements within defined ranges, identifying key moments when the market is gaining momentum or preparing for a shift. By dividing the chart into dynamic price ranges, the indicator detects critical support and resistance levels. It calculates the directional force of price movements, highlighting potential entry and exit points based on market sentim
MT4용 Crypto_Forex 지표 "3 Black Crows 패턴", 리페인트 없음, 지연 없음. - "3 Black Crows 패턴" 지표는 가격 변동 거래에 매우 효과적입니다. - 이 지표는 차트에서 하락세 "3 Black Crows" 패턴을 감지합니다. 차트에 빨간색 화살표 신호가 나타납니다(그림 참조). - PC, 모바일 및 이메일 알림 기능을 제공합니다. - 형제 지표인 상승세 "3 White Soldiers 패턴" 지표도 이용 가능합니다(아래 링크 참조). - "3 Black Crows 패턴" 지표는 지지/저항선과 함께 사용하기에 매우 좋습니다. 여기를 클릭하여 고품질 트레이딩 로봇과 지표를 확인하세요! 이 제품은 MQL5 웹사이트에서만 제공되는 오리지널 상품입니다.
Alpha Trend sign has been a very popular trading tool in our company for a long time. It can verify our trading system and clearly indicate trading signals, and the signals will not drift. Main functions: Based on the market display of active areas, indicators can be used to intuitively determine whether the current market trend belongs to a trend market or a volatile market. And enter the market according to the indicator arrows, with green arrows indicating buy and red arrows indicating se
Concept Mean reversion is a concept in trading based on prices eventually returning to their mean or average level after a period of divergence or departure from the historical mean. Traders deploying mean reversion techniques typically wait for assets to diverge significantly from their mean values and then place trades on the assumption the price will return to the mean at some point in the future- this is also known as re-coupling or convergence. There are several mean reversion based trading
Trend Ray
Andriy Sydoruk
The indicator shows the potential trend direction by cyclical-wave dependence. Thus, all the rays of the intersection will be optimal rays, in the direction of which the price is expected to move, taking into account the indicator period. Rays can be used as a direction for potential market movement. But we must not forget that the approach must be comprehensive, the indicator signals require additional information to enter the market.
Trend Map
Maryna Shulzhenko
The Trend Map indicator is designed to detect trends in price movement and allows you to quickly determine not only the direction of the trend, but also to understand the levels of interaction between buyers and sellers. It has no settings and therefore can be perceived as it signals. It contains only three lines, each of which is designed to unambiguously perceive the present moment. Line # 2 characterizes the global direction of the price movement. If we see that the other two lines are above
Gold Phoenix
Yaroslav Varankin
The perfect tool for Scalng in the Forex markets You can trade both from signal to signal and using take profit  The algorithm does not use Zigzag!  No redrawing!  This is a channel instrument that uses a moving average as a filter. Moving Average  There are 2 parameters for the settings Ma Period = 5 period Moving Average  Channel 1.0 distance of channel lines from the chart Price Signal Filter - calculation of signal opening and filter There is a complete set of Alert There is a multi-timefram
Based on MACD indicator waves with standard parameters Applies Fibonacci levels to the last two MACD waves, positive and negative respectively, if at the moment the MACD indicator runs out of negative Wave - the color is green, if at the moment the MACD indicator runs out of positive Wave - the color is red. The Wave termination criterion is two ticks with a different MACD sign. Applies trend lines on the last four MACD Waves. Works well with the expert Figures MACD   https://www.mql5.com/ru/mar
The   Fibonacci Confluence Toolkit   is a technical analysis tool designed to help traders identify potential price reversal zones by combining key market signals and patterns. It highlights areas of interest where significant price action or reactions are anticipated, automatically applies Fibonacci retracement levels to outline potential pullback zones, and detects engulfing candle patterns. Its unique strength lies in its reliance solely on price patterns, eliminating the need for user-define
캔들의 종가를 예측하는 지표입니다. 지표는 주로 D1 차트에서 사용하기 위한 것이. 이 지표는 전통적인 외환 거래와 바이너리 옵션 거래 모두에 적합합니다. 지표는 독립형 거래 시스템으로 사용하거나 기존 거래 시스템에 추가로 사용할 수 있습니다. 이 표시기는 현재 양초를 분석하여 양초 본체 내부의 특정 강도 요인과 이전 양초의 매개변수를 계산합니다. 따라서 지표는 시장 움직임의 추가 방향과 현재 양초의 종가를 예측합니다. 이 방법 덕분에 지표는 단기 및 중장기 거래 모두에 적합합니다. 지표를 사용하면 시장 상황을 분석하는 동안 지표가 생성할 잠재적 신호의 수를 설정할 수 있습니다. 표시기 설정에는 이를 위한 특별한 매개변수가 있습니다. 또한 인디케이터는 새로운 신호에 대해 차트의 메시지 형태, 이메일 및 PUSH 알림 형태로 알릴 수 있습니다. 구매 후 저에게 꼭 써주세요! 나는 당신에게 지표와 거래에 대한 나의 추천을 줄 것입니다! 또한 보너스를 받으세요!
Trendiness Index
Libertas LLC
5 (3)
"The trend is your friend" is one of the best known sayings in investing, because capturing large trendy price movements can be extremely profitable. However, trading with the trend is often easier said than done, because many indicators are based on price reversals not trends. These aren't very effective at identifying trendy periods, or predicting whether trends will continue. We developed the Trendiness Index to help address this problem by indicating the strength and direction of price trend
The   Trend Duration Forecast MT4   indicator is designed to estimate the probable lifespan of a bullish or bearish trend. Using a Hull Moving Average (HMA) to detect directional shifts, it tracks the duration of each historical trend and calculates an average to forecast how long the current trend is statistically likely to continue. This allows traders to visualize both real-time trend strength and potential exhaustion zones with exceptional clarity. KEY FEATURES Dynamic Trend Detection:   Uti
This product is a part of  ON Trade Waves Patterns Harmonic Elliot Wolfe you can test free version on EURJPY from this link  Wolf Waves Indicator 울프 웨이브(Wolf Waves) 발견하기 - 귀하의 궁극적인 거래 도구! 어떤 시간 프레임에서든 울프 웨이브를 쉽게 찾을 수 있는 강력한 도구를 찾고 계신가요? 더 이상 찾을 필요가 없습니다! 저희의 울프 웨이브 인디케이터는 이 작업을 쉽게 해내며, 여기서 왜 귀하에게 완벽한지 설명하겠습니다: 주요 기능: 자동 감지: 우리의 울프 웨이브 인디케이터는 복잡한 알고리즘을 사용하여 키 포인트를 자동으로 찾아 차트에 해당 선을 그립니다. 수동으로 패턴을 찾아 다니는 번거로움을 이제 더 이상 느낄 필요가 없습니다. 사용자 친화성: 이 인디케이터는 사용하기 간단하게 설계되어 있어 경험이 풍부한 트레이더든 울프 웨이브에 처음 접하는
Crypto_Forex 지표 HTF Ichimoku for MT4. - Ichimoku 지표는 가장 강력한 트렌드 지표 중 하나입니다. HTF는 - Higher Time Frame을 의미합니다. - 이 지표는 트렌드 트레이더와 가격 액션 항목과의 조합에 탁월합니다. - HTF Ichimoku 지표를 사용하면 더 높은 타임프레임의 Ichimoku를 현재 차트에 첨부할 수 있습니다. - 상승 추세 - 파란색 선 위에 빨간색 선(두 선 모두 클라우드 위에 있음) / 하락 추세 - 파란색 선 아래에 빨간색 선(두 선 모두 클라우드 아래에 있음). - 가격이 Ichimoku 클라우드 상단 테두리를 돌파했을 때만 BUY 주문을 엽니다. - 가격이 Ichimoku 클라우드 하단 테두리를 돌파했을 때만 SELL 주문을 엽니다. - HTF Ichimoku 지표는 큰 트렌드를 포착할 수 있는 기회를 제공합니다. 여기를 클릭하여 고품질 트레이딩 로봇과 지표를 확인하세요! 이 MQL5 웹사이트에서만
이 제품의 구매자들이 또한 구매함
Gann Made Easy
Oleg Rodin
4.83 (162)
Gann Made Easy 는 mr.의 이론을 사용하여 최고의 거래 원칙을 기반으로 하는 전문적이고 사용하기 쉬운 Forex 거래 시스템입니다. W.D. 간. 이 표시기는 Stop Loss 및 Take Profit Levels를 포함하여 정확한 BUY 및 SELL 신호를 제공합니다. PUSH 알림을 사용하여 이동 중에도 거래할 수 있습니다. 구매 후 거래 방법 안내 및 유용한 추가 지표를 무료로 받으시려면 저에게 연락주세요! 아마도 Gann 거래 방법에 대해 이미 여러 번 들었을 것입니다. 일반적으로 Gann의 이론은 초보자 거래자뿐만 아니라 이미 거래 경험이 있는 사람들에게도 매우 복잡한 것입니다. Gann의 거래 방식은 이론적으로 적용하기 쉽지 않기 때문입니다. 나는 그 지식을 연마하고 Forex 지표에 최고의 원칙을 적용하기 위해 몇 년을 보냈습니다. 표시기는 적용하기가 매우 쉽습니다. 차트에 첨부하고 간단한 거래 권장 사항을 따르기만 하면 됩니다. 지표는 지속적으로 시장 분석
M1 Sniper
Oleg Rodin
5 (22)
M1 SNIPER 는 사용하기 쉬운 거래 지표 시스템입니다. M1 시간대에 맞춰 설계된 화살표 지표입니다. 이 지표는 M1 시간대 스캘핑을 위한 단독 시스템으로 사용할 수 있으며, 기존 거래 시스템의 일부로도 사용할 수 있습니다. 이 거래 시스템은 M1 시간대 거래용으로 특별히 설계되었지만, 다른 시간대에도 사용할 수 있습니다. 원래는 XAUUSD와 BTCUSD 거래를 위해 이 방법을 설계했지만, 다른 시장 거래에도 유용하다는 것을 알게 되었습니다. 이 지표의 신호는 추세 방향과 반대로 거래될 수 있습니다. 저는 지표의 신호를 활용하여 양방향으로 거래할 수 있도록 돕는 특별한 거래 기법을 알려드립니다. 이 방법은 특별한 동적 지지선과 저항선 가격 영역을 활용하는 것을 기반으로 합니다. 구매하시면 M1 SNIPER 화살표 지표를 바로 다운로드하실 수 있습니다. 또한, 아래 스크린샷에 표시된 Apollo Dynamic SR 지표는 M1 SNIPER 도구를 사용하는 모든 사용자에게 무료로
Scalper Inside PRO
Alexey Minkov
4.74 (69)
Scalper Inside PRO – Since 2020. An exclusive indicator that utilizes an innovative algorithm to swiftly and accurately determine the market trend. The indicator automatically calculates opening, closing, and profit levels, providing detailed trading statistics. With these features, you can choose the most appropriate trading instrument for the current market conditions. Additionally, you can easily integrate your own arrow indicators into Scalper Inside Pro to quickly evaluate their statistics
PRO Renko System
Oleg Rodin
5 (30)
PRO Renko System 은 RENKO 차트 거래를 위해 특별히 고안된 매우 정확한 거래 시스템입니다. 이것은 다양한 거래 상품에 적용될 수있는 보편적 인 시스템입니다. 체계는 효과적으로 당신에게 정확한 반전 신호에 접근을 주는 소위 시장 소음을 중화합니다. 이 표시기는 사용하기가 매우 쉽고 신호 생성을 담당하는 매개 변수가 하나만 있습니다. 당신은 쉽게 당신의 선택의 어떤 무역 계기에 공구를 적응시킬 수 있고 renko 막대기의 크기. 나는 항상 당신이 내 소프트웨어로 수익성있게 거래 할 수 있도록 추가 지원을 제공 할 준비가되어 있습니다! 나는 당신에게 행복하고 수익성있는 거래를 기원합니다! 구매 후 저에게 연락하십시오! 내 렌코 차트 생성기를 보내드립니다. 또한 내 개인 권장 사항 및 시스템의 다른 모듈을 무료로 공유 할 것입니다!
Auto Optimized Parabolic RSI: 고급 3D 모멘텀 엔진 대부분의 개인 투자자용 보조지표는 시장의 변동성이 변하는 순간 무용지물이 되는 정적인 입력값에 의존하기 때문에 실패합니다. Auto Optimized Parabolic RSI는 자체적인 수학적 우위를 지속적으로 재계산하여 "보조지표 노후화" 문제를 해결하며, 기관급 퀀트 트레이딩의 적응력을 귀하의 MT5 터미널에 직접 제공합니다. 핵심 이점: 맞춤형 인메모리 3D 최적화   표준 자동 최적화 도구들은 일반적인 보조지표 호출로 터미널에 과부하를 일으켜 MT5 플랫폼을 멈추게 하는 경우가 많습니다. 이 도구는 이러한 병목 현상을 완전히 우회합니다. 맞춤형 네이티브 RAM 기반 계산기로 구축된 내부 엔진은 차트를 로드하거나 타임프레임을 변경할 때마다 빛처럼 빠른 3D 그리드 검색을 실행합니다. RSI 기간(주기), SAR 스텝(가속도) 및 SAR 최대치(속도 제한)를 동시에 스캔하여 플랫폼 지연 없이 수만 개의
Quantum Breakout Indicator PRO
Bogdan Ion Puscasu
4.96 (26)
소개       Quantum Breakout PRO   , 브레이크아웃 존 거래 방식을 변화시키는 획기적인 MQL5 지표! 13년 이상의 거래 경험을 가진 숙련된 트레이더 팀이 개발한   Quantum Breakout PRO는   혁신적이고 역동적인 브레이크아웃 영역 전략으로 거래 여정을 새로운 차원으로 끌어올리도록 설계되었습니다. Quantum Breakout Indicator는 5개의 이익 목표 영역이 있는 브레이크아웃 영역의 신호 화살표와 브레이크아웃 상자를 기반으로 한 손절 제안을 제공합니다. 초보자 거래자와 전문 거래자 모두에게 적합합니다. Quantum EA 채널:       여기를 클릭하세요 MT5 버전 :   여기를 클릭하세요 중요한! 구매 후 설치 매뉴얼을 받으려면 개인 메시지를 보내주십시오. 추천: 기간: M15 통화쌍: GBPJPY, EURJPY, USDJPY,NZDUSD, XAUUSD 계정 유형: 스프레드가 매우 낮은 ECN, Raw 또는 Razo
Market Makers
Mohamed Hassan
5 (4)
After purchase, contact me privately to receive 1 month of free testing with EA Forex Proton! This advanced MT4 trading robot automatically executes signals from any MT4 indicator, including Market Makers. The latest version also includes AI integration, allowing each trade signal to be analyzed using Artificial Intelligence. Live Signal with EA Forex Proton: Click here Market Makers is a powerful price action trading system designed to identify high-probability Buy and Sell opportunities based
Apex Edge No Repaint MT4용 전문가용 리페인팅 없는 트레이딩 지표 Apex Edge No Repaint는 화살표 리페인팅 현상 없이 명확한 신호를 원하는 진지한 외환 및 암호화폐 트레이더를 위해 설계된 프리미엄급의 깔끔하고 신뢰할 수 있는 트레이딩 도구입니다. 주요 기능: 100% 리페인트 없음 – 신호는 차트에 나타난 후 고정됩니다. 듀얼 신호 시스템: 초기 기회를 위한 RAW 신호와 높은 확률의 확정 진입을 위한 CONF 신호 간편한 원클릭 토글 버튼: RAW 켜기/끄기 및 CONF 켜기/끄기 추세, 강도 백분율 및 신호 상태를 표시하는 전문적인 실시간 대시보드 즉시 알림: 팝업, 소리 및 이메일 알림 모든 CONF 신호에 TP1, TP2 및 손절매 레벨 자동 표시 즉시 시각적 명확성을 위한 깔끔한 색상 코드 화살표: 연두색 → CONF 매수 빨간색 → CONF 매도 청록색 → RAW 매수 자홍색 → RAW 매도 모든 시간대 및 모든 종목에서 작동 장점:
이 지표를 구매하면 제 프로페셔널 트레이드 매니저를 무료로 드립니다. 우선 이 거래 시스템이 리페인팅, 리드로잉 및 레이그 인디케이터가 아니라는 점을 강조하는 것이 중요합니다. 이는 수동 및 로봇 거래 모두에 이상적인 것으로 만듭니다. 온라인 강좌, 설명서 및 프리셋 다운로드. "스마트 트렌드 트레이딩 시스템 MT5"은 새로운 및 경험이 풍부한 트레이더를 위해 맞춤형으로 제작된 종합적인 거래 솔루션입니다. 10개 이상의 프리미엄 인디케이터를 결합하고 7개 이상의 견고한 거래 전략을 특징으로 하여 다양한 시장 조건에 대한 다목적 선택이 가능합니다. 트렌드 추종 전략: 효과적인 트렌드 추이를 타기 위한 정확한 진입 및 손절 관리를 제공합니다. 반전 전략: 잠재적인 트렌드 반전을 식별하여 트레이더가 범위 시장을 활용할 수 있게 합니다. 스캘핑 전략: 빠르고 정확한 데이 트레이딩 및 단기 거래를 위해 설계되었습니다. 안정성: 모든 인디케이터가 리페인팅, 리드로잉 및 레이그가 아니므로 신뢰
이 인디케이터는 엘리어트 파동 이론과 두 가지 방식으로 작동합니다: 자동 작동: 이 모드에서는 인디케이터가 엘리어트 파동 이론에 따라 차트 상의 모든 5개의 모티브 웨이브를 자동으로 감지하고 예측 및 잠재적인 반전 지역을 제공합니다. 또한 중요한 개발 사항을 트레이더에게 알릴 수 있는 경보 및 푸시 메시지를 생성할 수 있는 능력을 갖추고 있습니다. 이 자동 기능은 엘리어트 파동 패턴의 식별과 분석 프로세스를 간소화합니다. 수동 작동: 이 옵션은 엘리어트 파동 이론을 수동으로 다루고 싶은 트레이더를 위해 설계되었습니다. 이를 통해 사용자는 아홉 가지 다른 등급을 사용하여 웨이브를 그릴 수 있습니다. 각 등급은 나타난 후에 차트에 그려진 라인을 조정하여 개별적으로 정의할 수 있습니다. 이 기능은 웨이브를 수동으로 그리는 프로세스를 간소화하며 더 효율적으로 만들어 줍니다. 중요한 점으로 모든 그림 데이터가 미래 참조를 위해 플랫폼 데이터 폴더에 저장된다는 것을 기억해야 합니다. 파라미터:
PZ Harmonacci Patterns
PZ TRADING SLU
3.17 (6)
Trade smarter, not harder: Empower your trading with Harmonacci Patterns This is arguably the most complete harmonic price formation auto-recognition indicator you can find for the MetaTrader Platform. It detects 19 different patterns, takes fibonacci projections as seriously as you do, displays the Potential Reversal Zone (PRZ) and finds suitable stop-loss and take-profit levels. [ Installation Guide | Update Guide | Troubleshooting | FAQ | All Products  ] It detects 19 different harmonic pric
Please send me Direct message on MQL5 CHAT after purchasing the Indicator for Training and Installation Support There are some additional files that is important to use with the Indicator . So be sure to contact me after purchasing the Indicator So that I can add you for training and support . If you find any difficulty with installation then send me Direct message here So that I can connect with you via Anydesk or Teamview for the product installation. " Smart Order Block Indicator " to find m
GoldRush Trend Arrow Signal
Kirk Lee Holloway
5 (2)
GoldRush 트렌드 화살표 신호 GoldRush 트렌드 화살표 신호 지표는 XAU/USD 시장에서 고속 단기 스캘핑 트레이더를 위해 설계된 정밀한 실시간 트렌드 분석을 제공합니다. 1분 시간대에 특화되어 설계된 이 도구는 명확한 진입점을 표시하는 방향성 화살표를 제공하여 스캘퍼들이 변동성이 높은 시장 환경에서도 자신 있게 거래할 수 있도록 합니다. 이 지표는 PRIMARY 및 SECONDARY 경고 화살표로 구성됩니다. PRIMARY 신호는 추세 방향의 변화를 나타내는 흰색과 검은색 방향성 화살표이며, SECONDARY 신호는 PRIMARY 화살표가 지시하는 방향을 확인하고 잠재적인 거래 진입점을 표시하는 파란색과 빨간색 화살표입니다. 참고: 추세 방향이 변경된 후 PRIMARY 경고 화살표가 단 하나만 표시될 경우, 다수의 SECONDARY 파란색/빨간색 화살표가 표시될 수 있음을 유의해야 합니다. SECONDARY 신호는 신호 기준을 충족하는 어떤 캔들 이후에도 표시
Dynamic Scalper System
Vitalyi Belyh
5 (1)
" Dynamic Scalper System " 지표는 추세 파동 내에서 스캘핑 방식으로 거래하도록 설계되었습니다. 주요 통화쌍 및 금에서 테스트되었으며, 다른 거래 상품과의 호환성이 가능합니다. 추가적인 가격 변동 지원을 통해 추세에 따라 단기 포지션 진입 신호를 제공합니다. 지표의 원리 큰 화살표는 추세 방향을 결정합니다. 작은 화살표 형태의 스캘핑 신호를 생성하는 알고리즘은 추세 파동 내에서 작동합니다. 빨간색 화살표는 상승 방향을, 파란색 화살표는 하락 방향을 나타냅니다. 민감한 가격 변동선은 추세 방향으로 그려지며, 작은 화살표의 신호와 함께 작용합니다. 신호는 다음과 같이 작동합니다. 적절한 시점에 선이 나타나면 진입 신호가 형성되고, 선이 있는 동안 미결제 포지션을 유지하며, 완료되면 거래를 종료합니다. 권장되는 작업 시간대는 M1~H4입니다. 화살표는 현재 캔들에 형성되며, 다음 캔들이 이미 시작되었더라도 이전 캔들의 화살표는 다시 그려지지 않습니다. 입력 매개
PZ Trend Trading
PZ TRADING SLU
4.8 (5)
Capture every opportunity: your go-to indicator for profitable trend trading Trend Trading is an indicator designed to profit as much as possible from trends taking place in the market, by timing pullbacks and breakouts. It finds trading opportunities by analyzing what the price is doing during established trends. [ Installation Guide | Update Guide | Troubleshooting | FAQ | All Products ] Trade financial markets with confidence and efficiency Profit from established trends without getting whips
GOLD Impulse with Alert
Bernhard Schweigert
4.67 (12)
이 지표는 Advanced Currency IMPULSE with ALERT  +   Currency Strength Exotics  의 2가지 제품의 슈퍼 조합입니다. 그것은 모든 시간 프레임에 대해 작동하며 8개의 주요 통화와 하나의 기호에 대한 강약의 충동을 그래픽으로 보여줍니다! 이 표시기는 금, 이국적인 쌍, 상품, 지수 또는 선물과 같은 기호에 대한 통화 강도 가속을 표시하는 데 특화되어 있습니다. 금, 은, 오일, DAX, US30, MXN, TRY, CNH 등의 진정한 통화 강도 가속(충동 또는 속도)을 표시하기 위해 9번째 줄에 모든 기호를 추가할 수 있습니다. 새로운 기본 알고리즘을 기반으로 구축되어 잠재적인 거래를 훨씬 더 쉽게 식별하고 확인할 수 있습니다. 이는 통화의 강세 또는 약세가 가속되는지 여부를 그래픽으로 표시하고 가속 속도를 측정하기 때문입니다. 자동차의 속도계처럼 생각하면 됩니다. 가속화할 때 Forex 시장에서 동일한 일이 분명히 더 빠르
Advanced Supply Demand
Bernhard Schweigert
4.91 (300)
현재 40% 할인! 초보자나 전문 트레이더를 위한 최고의 솔루션! 이 보조지표는 우리가 다수의 독창적 기능과 새로운 공식을 통합한 독특하고 고품질이며 저렴한 거래 도구입니다. 이 업데이트를 통해 이중 시간대를 표시할 수 있습니다. 더 높은 TF를 표시할 수 있을 뿐만 아니라 차트 TF와 더 높은 TF 모두를 표시할 수 있습니다: 중첩 영역 표시. 모든 Supply Demand 트레이더들이 좋아할 것입니다. :) 중요한 정보 공개 Advanced Supply Demand의 잠재력을 극대화하려면 다음을 방문하십시오. https://www.mql5.com/ko/blogs/post/720245   진입 또는 목표의 명확한 트리거 포인트를 정확히 찾아냄으로 해서 거래가 어떻게 개선될지 상상해 보십시오. 새로운 알고리즘을 기반으로 매수자와 매도자 간의 잠재적인 불균형을 훨씬 더 쉽게 분간할 수 있습니다. 왜냐하면 가장 강한 공급영역과 가장 강한 수요 영역과 과거에 어떻게 진행 되었는지를(이전
Gold Scalper Super
Aleksandr Makarov
5 (2)
Gold Scalper Super is an easy-to-use trading system. The indicator can be used as a standalone scalping system on the M1 time frame, as well as part of your existing trading system. Bonus: when purchasing an indicator, Trend Arrow Super is provided free of charge, write to us after purchase. The indicator 100% does not repaint!!! If a signal appears, it does not disappear! Unlike indicators with redrawing, which lead to the loss of a deposit, because they can show a signal and then remove it.
CRT Candle Range Theory HTF MT4.   Ultimate CRT Indicator: Advanced ICT Concepts and Malaysian SnR Trading System Discounted   Price   $50  !!     Secure your lifetime access   now   before it switches to   subscription-only ! Master the Market Maker's Footprints with the Most Advanced Candle Range Theory Indicator Unlock the true power of   Smart Money Concepts (SMC)   and trade precisely like the institutions with the   Ultimate CRT Indicator . Built exclusively for serious traders, this indic
PZ Turning Points MT4
PZ TRADING SLU
1 (1)
Identify key turning points with reliable fractal analysis This indicator examines the price structure of fractals of different periods to determine possible reversal points in the market, providing timing to positional traders that already have a fundamental or technical valuation model. Unlike its younger brother, Reversal Fractals , this indicator won't miss reversals because of the period selected, and will find reversal fractals on a zig-zag fashion, ignoring those reversals which do not
PZ Support Resistance
PZ TRADING SLU
3.33 (3)
Unlock key market insights with automated support and resistance lines Tired of plotting support and resistance lines? This is a multi-timeframe indicator that detects and plots supports and resistance lines in the chart with the same precision as a human eye would. As price levels are tested over time and its importance increases, the lines become thicker and darker, making price leves easy to glance and evaluate. [ Installation Guide | Update Guide | Troubleshooting | FAQ | All Products ] Boos
Apex Break PRO MT4
Kestutis Balciunas
Apex Break PRO는 MetaTrader 4용 비재도색 피봇 추세선 돌파 지표입니다. 피봇 고점과 피봇 저점을 감지하고, 연속 피봇 사이에 동적 경사 추세선을 그리며, 확정된 봉 마감 시 가격이 해당 추세선을 돌파할 때 매수 및 매도 신호를 생성합니다. 모든 신호는 최대 4개의 독립적인 컨플루언스 레이어——EMA 추세, RSI 경계값, 거래량 급증 감지, ADX 추세 강도——를 통해 필터링되며, 트레이더가 몇 가지 조건이 일치했는지 즉시 확인할 수 있도록 스타 평가 시스템으로 등급이 매겨집니다. ATR 기반 손절매와 3개의 이익실현 레벨이 각 신호에 대한 체계적인 리스크 관리를 제공하며, 실시간 대시보드는 방향, 필터 상태, 도달 체크 표시가 포함된 거래 레벨 추적을 표시합니다. MT5 버전 확인:  Apex Break PRO MT5 더 많은 제품 보기:   전체 제 품 목록 실시간 예제와 새로운 도구를 확인하려면 프로필을 방문하여 업데이트를 놓치지 않도록 친구 요청을 보내세
They say history repeats itself. What if you could prove it in real-time? The Propfolio Ghost Pattern is an advanced algorithmic pattern-matching engine. It empowers you to select any current price action structure on your chart and instantly scan thousands of historical candles to find the exact moment in the past where the market did the exact same thing. Once it finds the highest probability match, it projects the historical outcome into the future as "Ghost Candles"—giving you a highly calcu
현재 26% 할인!! 이 지표는 두 주요 지표( Advanced Currency Strength 28   &  Advanced Currency IMPULSE with ALERT )의 슈퍼 조합입니다. TICK-UNITS에 대한 통화 강도 값과 28개 Forex 쌍에 대한 경고 신호를 보여줍니다. 11개의 다른 틱 단위를 사용할 수 있습니다. 1, 2, 3, 4, 5, 6, 10, 12, 15, 20, 30초입니다. 두 번째 타이머 내에 최소 1틱이 있으면 하위 창의 Tick-Unit 막대가 표시되고 왼쪽으로 이동합니다. 단 하나의 차트로 28 Forex 페어를 스캘핑할 수 있습니다! 스캘핑 기회의 정확한 트리거 포인트를 정확히 찾아낼 수 있기 때문에 스캘핑이 어떻게 개선될지 상상해 보십시오. 그것은 1분보다 낮은 기간에 작동하는 시장의 첫 번째 통화 강도 지표입니다! 그것은 시장에 빠르게 들어오고 나가고 시장에서 작은 핍을 잘라내기를 원하는 빠른 스캘퍼를 위한 것입니다. 사
Atomic Analyst
Issam Kassas
5 (5)
우선적으로 언급할 점은이 거래 지표가 다시 그리지 않고 지연되지 않으며 이를 통해 수동 및 로봇 거래 모두에 이상적이라는 점입니다. 사용자 매뉴얼: 설정, 입력 및 전략. Atomic Analyst는 가격의 강도와 모멘텀을 활용하여 시장에서 더 나은 이점을 찾는 PA Price Action Indicator입니다. 고급 필터를 장착하여 잡음과 거짓 신호를 제거하고 거래 잠재력을 높이는 데 도움이 됩니다. 복잡한 지표의 다중 레이어를 사용하여 Atomic Analyst는 차트를 스캔하고 복잡한 수학적 계산을 간단한 신호와 색상으로 변환하여 초보 트레이더가 이해하고 일관된 거래 결정을 내릴 수 있도록합니다. "Atomic Analyst"는 새로운 및 경험이 풍부한 트레이더를위한 종합적인 거래 솔루션입니다. 프리미엄 지표와 최고 수준의 기능을 하나의 거래 전략에 결합하여 모든 종류의 트레이더에 대한 다재다능한 선택지가되었습니다. 인트라데이 거래 및 스캘핑 전략 : 빠르고 정확한 일일
구매 후 저에게 연락하여 이 지표를 기반으로 한 보너스 EA를 받으십시오. Self Optimizing Double MA Strategy는 파라미터 추측을 없애기 위해 설계된 전문가 수준의 트레이딩 도구입니다. 내장된 자동 최적화 엔진으로 구동되며, 통계적 우위를 유지하기 위해 백그라운드에서 수천 개의 파라미터 조합을 시뮬레이션하여 변화하는 시장 조건에 지속적으로 적응합니다. 정적이고 구식인 설정에 의존하는 대신, 이 인디케이터는 자체 로직을 동적으로 업데이트하여 현재 시간대와 종목에 가장 수익성 있는 구성을 찾습니다. 주요 기능 내장된 자동 최적화: 시스템은 단기 MA, 장기 MA 및 RSI 기간을 주기적으로 다시 계산하여, 선택한 업데이트 빈도에 따라 설정이 항상 현재 시장 리듬과 일치하도록 보장합니다. MA 다이버전스 필터: 이동평균선이 활발하게 발산(확장)할 때만 시그널을 검증하는 핵심 추세 강도 지표입니다. 이는 평균선이 수렴하거나 평탄한 횡보장에서는 잘못된 진입을 방지합
Advanced Currency Strength28 Indicator
Bernhard Schweigert
4.91 (657)
현재 40% 할인 초보자 또는 전문가 트레이더를 위한 최고의 솔루션! 이 지표는 우리가 독점 기능과 새로운 공식을 통합했기 때문에 독특하고 고품질이며 저렴한 거래 도구입니다. 단 하나의 차트로 28 Forex 쌍의 통화 강도를 읽을 수 있습니다! 새로운 추세 또는 스캘핑 기회의 정확한 트리거 포인트를 정확히 찾아낼 수 있기 때문에 거래가 어떻게 개선될지 상상해 보십시오. 사용 설명서: 여기를 클릭  https://www.mql5.com/en/blogs/post/697384 그것이 첫 번째, 원본입니다! 쓸모없는 지망생 클론을 사지 마십시오. 더 스페셜  강력한 통화 모멘텀을 보여주는 하위 창의 화살표 GAP가 거래를 안내합니다! 기본 또는 호가 통화가 과매도/과매도 영역(외부 시장 피보나치 수준)에 있을 때 개별 차트의 기본 창에 경고 표시가 나타납니다. 통화 강도가 외부 범위에서 떨어질 때 풀백/반전 경고. 교차 패턴의 특별 경고 추세를 빠르게 볼 수 있는 다중 시간
Cyclic Impulse
Vitalyi Belyh
차트를 구조화하고 주기적인 가격 변동을 식별하는 기술 지표입니다. 모든 차트에서 작업할 수 있습니다. 다양한 유형의 알림. 그래프 자체에도 추가 화살표가 있습니다. 역사를 재구성하지 않고, 촛불을 닫는 작업에 임한다. M5 이상에서 권장되는 TF입니다. 사용 및 구성이 쉬운 매개변수입니다. 매개변수가 다른 2개의 지표를 사용하는 경우, 다른 지표 없이 해당 지표만 사용할 수 있습니다. 2개의 입력 매개변수가 있습니다 주기성과 신호 지속 시간 이 2개의 매개변수는 차트 구조의 처리와 관련이 있습니다. Cyclicity - 역전 주기가 얼마나 자주 바뀌는지 조절하고 주기를 매끄럽게 합니다. Signal duration - 최소 숫자에서는 가격 움직임의 충격을 감지하고, 최대 숫자에서는 장기적 추세 움직임을 감지합니다.. --------------------------------
KuKl
IGOR KIRIANEN
The indicator is built on a non-standard Zig Zag, it draws accumulations after which if the price leaves this zone and a test of this zone occurs, then a sound signal is given and an arrow appears - after the test candle closes.The indicator does not redraw its signals, it is very easy to use, there are only three settings 1- this is the zig zag parameter 2- this is the minimum price exit from the zone 3- this is the maximum price exit from the zone. The lower the parameter for Zig Zag, the more
Day Trader Master
Oleg Rodin
5 (15)
Day Trader Master 는 데이 트레이더를 위한 완벽한 거래 시스템입니다. 시스템은 두 개의 지표로 구성됩니다. 하나의 지표는 매수 및 매도를 위한 화살표 신호입니다. 얻을 수 있는 화살표 표시기입니다. 2차 지표를 무료로 드립니다. 두 번째 지표는 이러한 화살표와 함께 사용하도록 특별히 설계된 추세 지표입니다. 표시기는 반복하지 않고 늦지 않습니다! 이 시스템을 사용하는 것은 매우 간단합니다. 2색 선으로 표시되는 현재 추세 방향의 화살표 신호를 따라가기만 하면 됩니다. 파란색은 구매 추세입니다. 빨간색은 판매 추세입니다. 파란색 화살표는 매수 신호입니다. 빨간색 화살표는 매도 신호입니다. 추세선의 색상과 일치하려면 화살표의 색상과 신호의 방향이 필요합니다. 화살표 표시기는 주로 시간 간격 M5 및 M15에서 일중 거래를 위해 만들어졌습니다. 그러나 기술적으로 시스템은 다른 시간 간격으로 사용할 수 있습니다. 표시기에는 PUSH 메시지 기능이 있는 팝업 경고가 장착되어 있
제작자의 제품 더 보기
Oblivion
Maksim Neimerik
4.67 (3)
Requirement for the EA use : the EA needs a low spread (recommended spread value is 2) and minimum slippage! Systems that operate based on Bollinger waves signals are considered to be among the systems with the best results and reliability. The Oblivion Expert Advisor also belongs to such systems. In addition to Bollinger waves, the Expert Advisor uses the following indicators: Stochastic and Moving Average. The EA does not use Martingale and grid systems! Recommended Expert Advisor operation t
FREE
MA Color
Maksim Neimerik
4.67 (3)
Moving Average Color Moving Average (MA) is a trend indicator, which is a curved line that is calculated based on price changes. Accordingly, the moving average is the trader’s assistant, which confirms the trend. On the chart it looks like a bending line that repeats the price movement, but more smoothly. Moving Average Color it is a standard moving average indicator with a color change when the trend direction changes. The ability to set additional levels has also been added. It is a handy too
FREE
Introduction Welcome to the world of Forex trading, where every tick of the market can be influenced by news events. Introducing our expert advisor for MetaTrader, your ultimate tool for navigating the complexities of news trading. This innovative advisor is specifically designed to automate your trading strategy during key macroeconomic releases, ensuring you never miss an opportunity.  When important indicators are announced, volatility often spikes, creating potential for profit. Our expert
FREE
This simple but useful script calculates the lot in % of the deposit. It is indispensable for risk management. There is only one customizable parameter: MaxRisk - risk in % for lot calculation. The product works as a standard script. Launch it once on an appropriate chart and start trading using the calculated lot value. Genious is simplicity! Happy trading!
FREE
Divergence Reader
Maksim Neimerik
Divergence Reader - индикатор который поможет Вам идентифицировать на графике дивергенцию и конвергенцию. Настройки Type - выбор типа сигнала (дивергенция, конвергенция, оба сигнала); Minimum length of divergence (Candle) - минимальная длинна сигнала (в свечах); MACD SETTINGS - настройки индикатора МАСD; Важно! Индикатор не рисует графику на истории! Для визуальной проверки индикатора рекоммендую использовать тестер.
FREE
Info Line
Maksim Neimerik
Утилита Info Line представляет собой горизонтальную линию которая показывает общую прибыль (убыток) по всех ордерах открытых по валютной паре на график которой она установлена.  Отображаемая информация: Количество пунктов от текущей цены до линии; Общая прибыль (убыток) по всех ордерах графика; Общее количество BUY лотов; Общее количество SELL лотов; Кроме того утилита "умеет" ставить стопы на выбранную цену (цену линии). В настройках можно выбрать: Отображать информацию только по BUY ордерам; О
FREE
BarsStreet
Maksim Neimerik
Features This indicator determines the consecutive bullish and bearish bars; It graphically displays from 4 to 12 consecutive bullish and bearish bars with an alert; It is possible to disable the alert and unnecessary graphical elements; It is also possible to adjust the number of bars in history, where the graphical elements of the indicator are to be drawn (0 = all available bars); There is an option to change the size of the graphical elements. This indicator is well suited for trading binary
Night Raven Martin
Maksim Neimerik
2.8 (5)
Requirement for the EA use: the EA needs a low spread (recommended spread value is 2) and minimum slippage! The EA is a system that trades the signals generated by the following indicators: Bollinger Bands, Stochastic and Moving Average. The EA works from 00:05 to 08:00, terminal time. By default, all orders are closed at 23:59 (can be modified). Important!!! The EA operation start time should match the American trading session close time, while the operation end time should coincide with the E
Features This indicator determines consecutive bullish and bearish bars; Determines the High and Low for the last N bars (N can be changed in the settings); It shows the Buy and Sell signals based on the values of other indicators, such as Bollinger Bands, Stochastic and MACD; It graphically displays from 4 to 12 consecutive bullish and bearish bars with an alert; It is possible to disable the alert and unnecessary graphical elements; It is also possible to adjust the number of bars in history,
MA Signal
Maksim Neimerik
It is a simple indicator showing the moments of intersection of two Moving Averages, and it can be an indefensible tool for use in some trading systems. When the MAs intersect, the indicator draws arrows in accordance with the crossover direction and generates and alert. Indicator parameters Period Fast MA - fast Moving Average period; Period Slow MA - slow Moving Average period; Method MA - Moving Average method; Apply to - price used for MA calculation; Alert - alert; Number of history bars -
Eclipse
Maksim Neimerik
This is a versatile Expert Advisor for trading on any currency pairs. The EA applies only Moving Average in trading. When a price retreats to a preset distance, the robot places a grid of pending orders and averages the profit while they are opened. A news filter has been added to the Expert Advisor! Recommended Usage Low spread; Currency pair - any (recommended - EURUSD and GBPUSD); Timeframe - М30; In the news filter settings, it is recommended to set 30 minutes before and 30 minutes after the
The indicator is a good tool for scalping. The entry points are defined using auxiliary indicators, such as Stochastic and Simple Moving Average. The indicator is represented by arrows showing the likely market direction. The signal appears right after the current candle close. Recommended parameters: Currency pair - any; Timeframe - no less than М5. Parameters Size of the indicator labe - graphical label size; The position of the indicator label (in points) - label position relative to the cur
This utility is a functional panel for manual trading. A special feature provided by the panel is the possibility to choose the stealth mode, in which operation is invisible to the broker! In this mode, a trader can open one sell and one buy order (in future updates, the number of orders will be increased). Any number of orders can be opened in the normal mode. In the assistant parameters, you can set stop loss, take profit, trailing stop, etc. In addition, you can control drawdown and limit it
Synevir
Maksim Neimerik
5 (1)
Requirement for the EA use: the EA needs a low spread (recommended spread value is 2) and minimum slippage! Systems that operate based on Bollinger waves signals are considered to be among the most popular well performing systems. This Expert Advisor belongs to such systems. In addition to Bollinger waves, the Expert Advisor uses the following indicators: Stochastic, RSI and Moving Average. Recommended Expert Advisor operation time is from 00:05 to 08:00 (the interval between the close of the A
Fibonacci System
Maksim Neimerik
The system applies Fibo levels. Apart from basic Fibo levels (23.6; 38.2; 50.0; 61.8; 100.0;), the EA features custom levels (34.0; 36.0; 64.0; 66.0;). You can decide the levels trading is to be performed from. Sample trade: when the market is bullish and the price rolls back to the levels (as we remember, we select the levels on our own), the EA opens buy orders. The opposite is true for sell orders. The EA can work in three modes. Each of the modes is a separate Fibo levels construction method
I present you an Expert Advisor based on the Martingale system. The trading volume used for opening positions depends on the parameters Lot and Multiplier. Martingale system, which proportionally increases the trade volume according to set parameters, is applied when you open a trade. Please note that the EA features the ability to select the trading direction: Buy or Sell. Recommendations: Currency pair: any; Timeframe: the EA is optimized for Н1, but any timeframe can be used. Other: the trad
Black Square
Maksim Neimerik
This is an Expert Advisor with the elements of graphics trading. It performs trading operations using the "Rectangle" (or "Square") shape. The Expert Advisor automatically draws a square and opens a Buy or Sell orders when the price crosses its lower or upper bounds respectively. The shape can be drawn manually. For this purpose you should disable the auto drawing feature in the Expert Advisor settings. If the price moves in the wrong direction, the Expert Advisor sets up to four orders in accor
Day By Day
Maksim Neimerik
Day By Day Требования к использованию советника: Для работы даного советника никакие требования не предусмотрены! Советник представляет собой систему, которая работает по сигналам индикатора RSI. Работает советник по времени терминала с 10:00 по 10:20, это значит что в это время он пытается войти в рынок, если по истечении этого времени войти не удается - ждет следующего дня. Рекомендуемая валюта: EURUSD, USDJPY; Таймфрейм : H1; Мониторинг:   https://www.mql5.com/ru/signals/557506 Оптимальные на
Solaris
Maksim Neimerik
Представляю Вашему вниманию советник Solaris, который торгует по принципу выставления разнонаправленых отложеных ордеров. Подробную информацию о системе торговли Вы можете увидеть на скриншоте ниже (скриншот 1). Рекомендации: Для данного советника не предусмотрено никаких особых рекомендаций, единственное, как и для большинства советников, желательно использовать инструменты с наименьшим спредом! Параметры работы советника можно использовать по умолчанию. Время работы выбрано период наибольшей
FV Stage II
Maksim Neimerik
FV 4005 Stage II Представляю Вашему вниманию новый автоматический советник основанный на базе индикатора Bollinger Bands. Данный эксперт принимает торговые решения основываясь на показаниях линий Боллинжера.  Торговые рекомендации: Тайм Фрейм - М15; Валютная пара - EURUSD (по мере тестирования и обновления валютные пары и настройки для них будут добавляться в комментариях); Настройки: Dynamic Lot - динамический лот; Start deposit - объем Вашего начального депозита; Lot - лот в расчете на  Start
Multi Trade
Maksim Neimerik
Комплексный индикатор который работает на основе 4-х стандартных индикаторов МТ4: Moving Average, Stochastic, Bollinger Bands, RSI (в дальнейшем список индикаторов будет расширятся). Показания индикаторов берутся из 7-и тайм фреймов от М1 до D1. Строка Average показывает средние значения индикаторов в разрезе тайм фреймов. Сигналы индикаторов: Moving Average: быстрая скользящая выше медленной скользящей - покупка; быстрая скользящая ниже медленной скользящей - продажа; данные берутся из последне
The Screen Shooter utility will help you take screenshots of your trading process. How it works: The program is a small panel with two modes of operation: the first mode "All Open Charts" - allows you to create screenshots of all charts open in the terminal; the second mode "All TF Curr Chart" - creates, accordingly, screenshots of all timeframes of the current chart (to which this tool is attached). In the second mode, the user can disable unnecessary timeframes using the buttons on the panel (
Telegram Informer A simple and reliable utility for monitoring your account. To make it work, you just need to add the following commands to your telegram bot: show_info - Show account information buy_sl_del -   Delete   Stop Loss for Buy orders buy_tp_del - Delete Take Profit for Buy orders sell_sl_del -   Delete   Stop Loss for Sell orders sell_tp_del - Delete Take Profit for Sell orders all_sl_del - Delete all Stop Loss all_tp_del - Delete all Take Profit breakeven - Convert to breakeven (eac
A simple indicator for plotting a tick chart. This indicator will allow you to track the spread dynamics and the price behavior in general. In the settings, you can select the price to display on the chart - Bid, Ask or both prices at the same time. Tick Chart Indicator will definitely be useful when using scalping strategies. The MT5 version is available here . Good luck to everyone and successful trading!
Pending orders system is a small trading panel created for quick setting of hidden pending stop orders. Its functionality is simple and at the same time very necessary in the day-to-day work of a trader. The main function of this panel is to set hidden pending stop orders with one click of the mouse at the desired place on the chart. If necessary, the user can pre-register lot, stop loss and take profit in the corresponding fields. If the lot is not specified, it will be set at the level of the
Recovery System
Maksim Neimerik
Recovery System EA The advisor is designed to automate the process of recovering losses on the current symbol. It can be used if there is a current loss, as well as to accompany other advisors. This product can also be used as a stand-alone advisor. Recovery System EA contains in the settings an option to select the operating mode: Recovery MA Cross Stochastic Bollinger Bands Non-indicators When working in Recovery mode, the advisor removes a losing position from a drawdown using the method sho
Telegram Informer A simple and reliable utility for monitoring your account. To make it work, you just need to add the following commands to your telegram bot: show_info - Show account information buy_sl_del -   Delete   Stop Loss for Buy position buy_tp_del - Delete Take Profit for Buy position sell_sl_del -   Delete   Stop Loss for Sell position sell_tp_del - Delete Take Profit for Sell position all_sl_del - Delete all Stop Loss all_tp_del - Delete all Take Profit breakeven - Convert to breake
A simple indicator for plotting a tick chart. This indicator will allow you to track the spread dynamics and the price behavior in general. In the settings, you can select the price to display on the chart - Bid, Ask or both prices at the same time. Tick Chart Indicator will definitely be useful when using scalping strategies. The MT4 version is available here . Good luck to everyone and successful trading!
ZigZagHHLL
Maksim Neimerik
A simple Zig Zag indicator with added visualization of Higher High, Lower High, Higher Low, Lower Low. This indicator will be very helpful when working with support/resistance levels. The ZigZag indicator is a fundamental tool that will significantly help you navigate complex situations in the financial markets. By providing a clear visual representation of price movements and trends, it simplifies the analysis process and improves decision-making capabilities. Its role in identifying trends and
BarsStreet MT5
Maksim Neimerik
In the dynamic world of forex trading, technical analysis is an essential tool for traders seeking to navigate the complexities of the currency markets. One key element of this analysis is the interpretation of candlestick patterns, particularly the phenomenon of consecutive one-sided candles. These candles, characterized by a uniform direction — either completely bullish or bearish — offer significant insight into market sentiment and potential future movements. Understanding the implications o
필터:
Itnas
334
Itnas 2019.11.09 09:52 
 

사용자가 평가에 대한 코멘트를 남기지 않았습니다

sunnychow
9043
sunnychow 2018.12.03 16:52 
 

사용자가 평가에 대한 코멘트를 남기지 않았습니다

Natalija_Best
69
Natalija_Best 2017.10.04 15:52 
 

사용자가 평가에 대한 코멘트를 남기지 않았습니다

리뷰 답변