BS Time Band

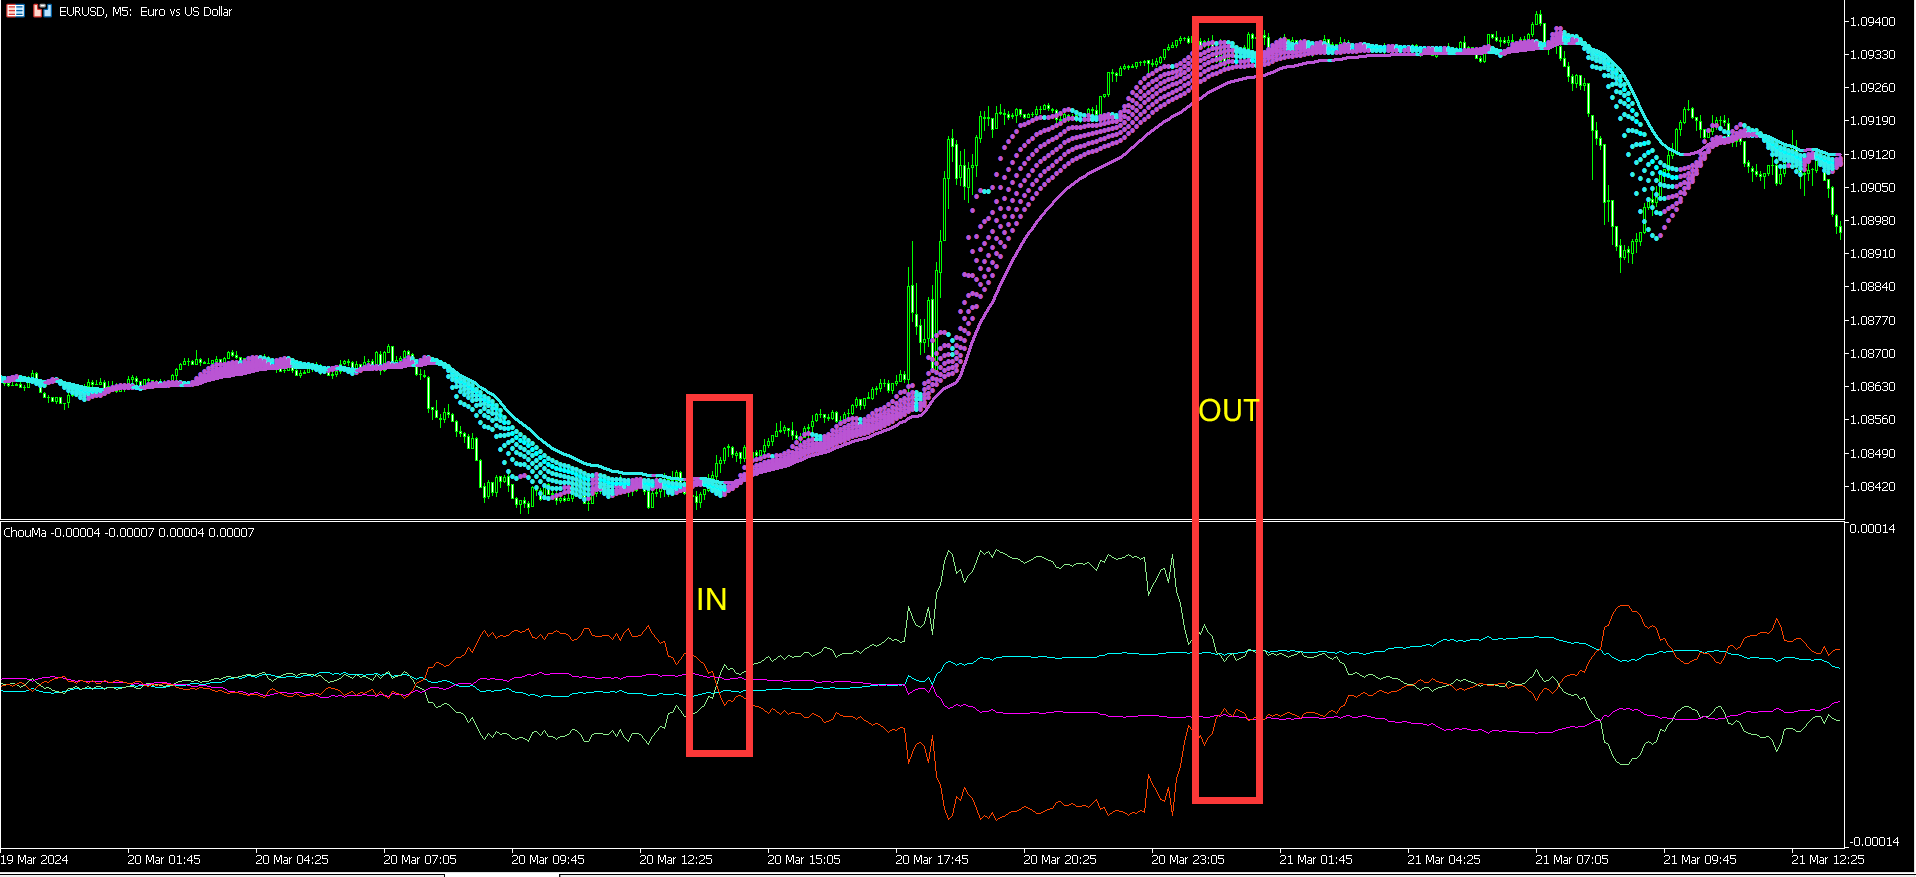
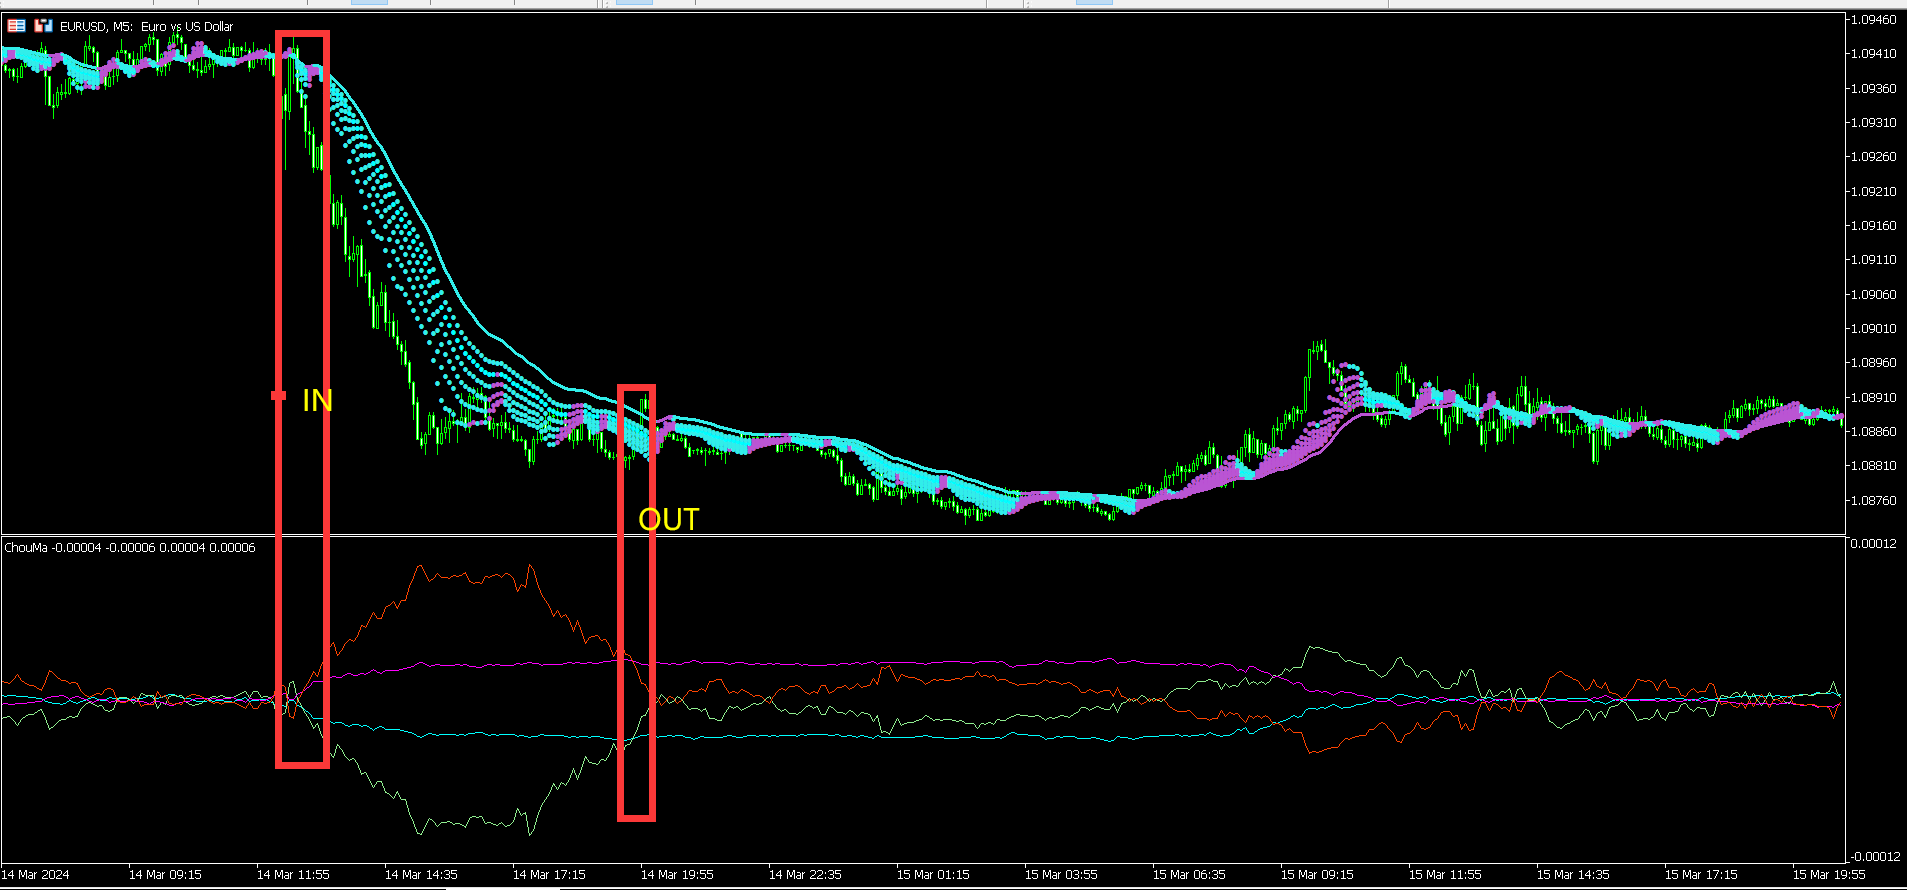
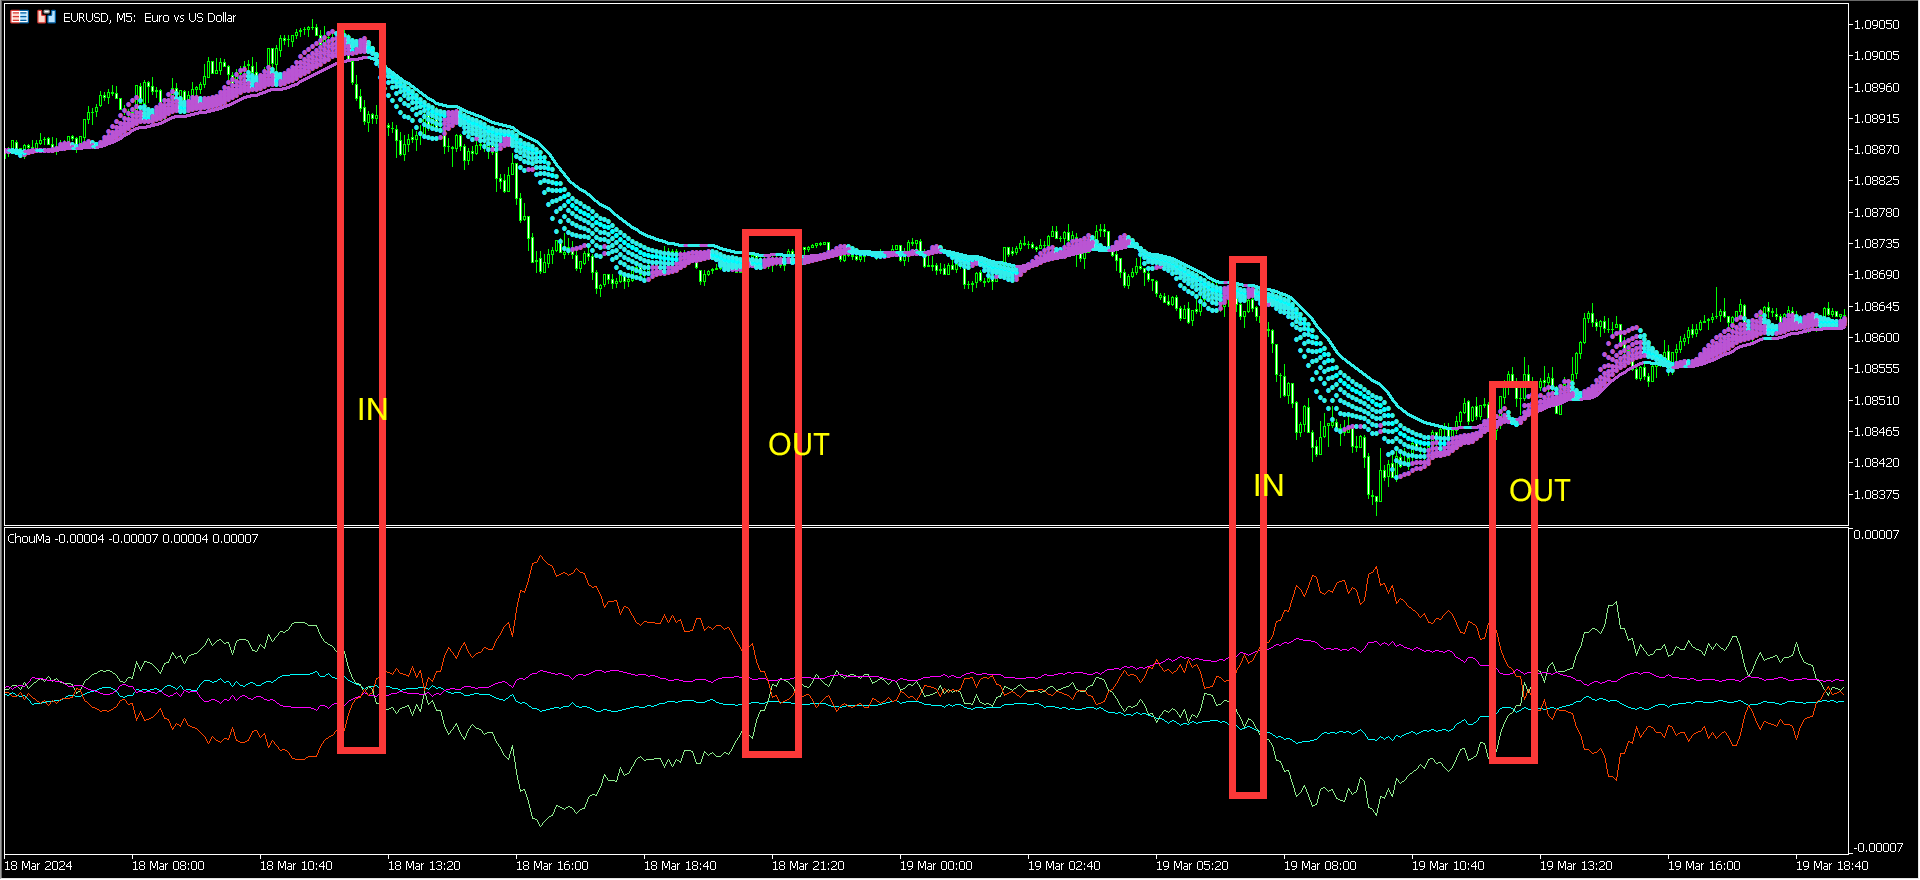
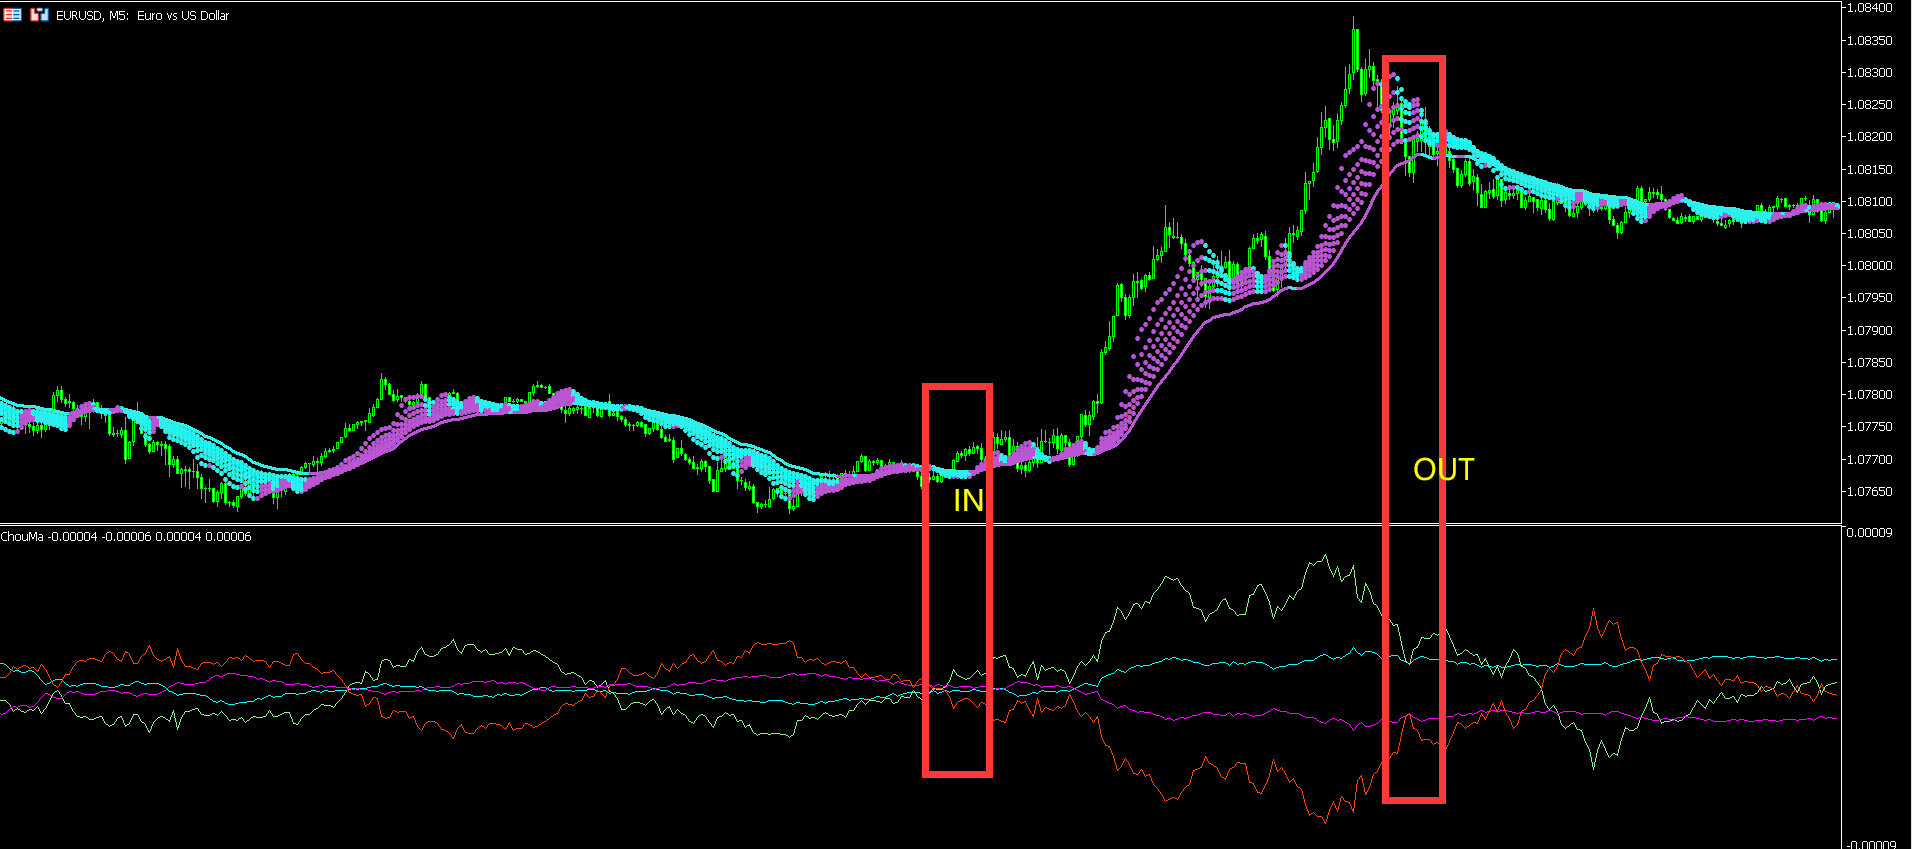
BS Time Band是一个很好的波段交易指示器,这个指标可以单独使用,但是最好是配合StartPoint一起使用效果更好,适用于任何时间框架,非常适合喜欢做波段交易的朋友。它能很好的体现出一个波段的完整信息,你可以很快的从这个指示器上寻找到最佳的预警区域,然后配合StartPoint找到最佳的buy位置和最佳的sell位置,也能很好根据指示器去坚守自己的持仓定订单。指标不含有未来函数,不会重新绘制,不仅能够应用到自己的手动交易过程中,还能完全可以写入到自己的EA中。(如果你感觉到这个指标能够帮助你进行更准确的交易,请帮忙给个好评,希望我的作品能够帮助更多有需要的人)

=================参考使用方法===================

此指标可以适用于任何交易品种。

做波段建议参数

timeFame:M5

如果配合 StartPoint 建议 StartPoint 的参数为(240,60)


추천 제품
Orderflow Super Candles - Simple Footprint Chart Indicator Platform: MetaTrader 5 (MT5)  (The last screenshot shows the use of the DOM tool in conjunction with the product.) 1. Product Introduction Orderflow Super Candles is a professional charting tool based on underlying Tick data analysis, designed to provide traders with a deep "X-ray" view of the market. By parsing the buy and sell volume distribution within each candlestick, this indicator visualizes the hidden market microstructure. It
ICT Kill zones
Israr Hussain Shah
ICT Kill zones Professional Automate your ICT & Smart Money analysis with precise, dynamic session tracking and liquidity pivots. Product Description Stop wasting time drawing boxes and lines every single day.   ICT Killzones Professional   is the ultimate session management tool designed specifically for traders utilizing Inner Circle Trader (ICT) concepts, Smart Money Concepts (SMC), and Liquidity-based strategies. This indicator automatically highlights the key trading sessions— Asia, London,
Hot Trend Zone
Tiofelo Da Olga Gilbert Teles
1. CONSTITUTION Hot Trend Zone is momentum indicator composed of one oscillator and its respective signal. The crossover between the oscillator and the signal generates the Bullish Trend Zone, Bearish Trend Zone, and Neutral Zone. 2. OPERATION As trend filter: bullish filter: if is bullish trending, search for bullish moves. bearish filter: if is bearish trending, search for bearish moves. As entry signal: When combined with a trend filter [preferably the Currency Strength Meter], it provides ve
The indicator determines a special pattern of Joe Dinapoli. It gives very high probability buy and sell signals. Indicator does not repaint. Indicator Usage Buy Signal ''B'' Entry : Market buy order at signal bar close Stop : Low of signal bar Take Profit : First swing high Sell Signal ''S'' Entry : Market sell order at signal bar close Stop : High of signal bar Take Profit : First swing low Indicator Parameters Fast EMA : External Parameter (should be kept as default) Slow EMA: External Param
Ultimate Double Top & Bottom (Pro Volume Matrix) Stop trading retail breakouts. Start trading Institutional Traps. The   Ultimate Double Top & Bottom   is not a standard, lagging pattern scanner. It is a highly advanced, non-repainting structural engine equipped with a proprietary   3-Leg Volume Matrix . Designed exclusively for Smart Money Concepts (SMC) and order flow traders, this indicator mathematically dissects the tick volume inside M and W patterns to reveal true institutional intent:  
Extremum levels
VLADISLAV AKINDINOV
이 지표는 전일, 주, 월의 최고 및 최저 가격을 보여줍니다. 극한 지점의 돌파를 식별하고 거래 진입 방향을 결정하도록 설계되었습니다. 반전 수준을 보다 정확하게 결정하기 위해 피보나치 수준을 표시할 수 있습니다. 또한 이전 청구 기간 동안의 가격 변동을 보다 명확하게 보여주기 위해 최고 가격과 최저 가격 사이의 공간에 표시할 수도 있습니다. 현재 캔들(바)이 닫힐 때까지의 시간을 나타냅니다. 버전 2.0에는 3가지 새로운 지그재그 반전 신호 레벨이 추가되었으며 각 레벨에 대한 경보를 제공합니다. This indicator shows the maximum and minimum prices of the previous day, week and month. Designed to identify breakouts of extreme points and determine the direction of entry into a trade. To more accurately determine
Smart Money Trap Detector 는 스윙 고점과 스윙 저점에서 유동성 함정을 식별합니다 . 가격이 핵심 수준을 돌파한 후 반전할 때 기관 투자자가 설정한 잠재적 불 트랩 또는 베어 트랩을 감지합니다 . 각 감지된 트랩은 꼬리 크기 , 반전 속도 , 거래량에 기반한 1~5 의 강도 점수를 받습니다 .   작동 원리 인디케이터는 설정 가능한 룩백 기간을 사용하여 스윙 고저점을 추적합니다 . 가격이 스윙 고점 또는 저점을 돌파하면 , 설정된 확인 캔들 수 내에 가격이 수준을 다시 통과하여 반전하는지 모니터링합니다 . 돌파 꼬리가 최소 ATR 비율 임계값을 충족하고 가격이 범위 내로 되돌아 마감하면 트랩이 확인됩니다 . 모든 신호는 리페인팅을 방지하기 위해 확인된 종가 바에 배치됩니다 .   시각적 기능 차트의 화살표가 확인된 불 트랩 ( 위쪽 화살표 ) 과 베어 트랩 ( 아래쪽 화살표 ) 을 표시 . 유동성 영역이 스윙 포인트 주변에 색상 사각형으로 그려짐 . 텍스트 레이블
Trendicator
Nico Deuscher
Functions Analyzes the current market trend Displays a numbering system based on trend structure (see below) Colors the chart background depending on trend direction Displays the ZigZag indicator Display Fibonacci Retracement with custom defined levels at the lates corrective trend movement Display Fibonacci Expansions with custom defined levels at the latest progressive trend movement Buffers for all relevant Trend parameters so EAs can access the trend information Background Information The
Neuro Future
Sergey Rozhnov
신경망 지표       학습 기능이 내장되어 있습니다. 이 시스템은 다단계 맞춤형 퍼셉트론과 고급 학습 설정을 통해 미래 가격 변동을 예측하는 진정한 자율형 인공지능 시스템입니다   . 모든 금융 종목에 대해 지표를 직접 학습시킬 수 있으며, 머신러닝에 대한 특별한 지식은 필요하지 않습니다. 필요한 모든 것이 이 도구에 수집되어 있으며, 자동 모드와 사전 설정을 통해 편리하게 구현됩니다. 주요 업데이트 버전 2.0-2.5 가 출시되었습니다. 고급 입력 기능:지표에 대한 지원이 추가되었습니다. 이제 더 깊은 시장 분석을 위해 원시 가격 데이터를 세 가지 기술 지표와 결합하거나 가격이없는 지표 만 사용할 수 있습니다. 차단하지 않고 라이브 교육:지능형 학습 알고리즘은 백그라운드에서 비동기 적으로 작동합니다. 메타 트레이더 5 터미널은 완전히 반응하여 신경망을 학습하면서 시장을 계속 거래하고 분석 할 수 있습니다. 특징: 간편 시작   . 자동 모드로 빠르게 시작할 수 있는 간단한 설
Adjustable Consecutive Fractals  looks for 2 or more fractals in one direction and sends out a on screen alert, sound alert and push notification, for strong reversal points . Adjustable Consecutive Fractals, shows the fractals on chart along with a color changing text for buy and sell signals when one or more fractals appear on one side of price. Adjustable Consecutive Fractals is based Bill Williams Fractals . The standard Bill Williams fractals are set at a non adjustable 5 bars, BUT withe th
This Indicator adding power to traditional zigzag indicator. With High-Low numbers in vision it will be easier to estimate change of trend by knowing the depth of each wave. Information including points, pips, percentage%, and #bars can be displayed based on configuration. All information is real-time update. This indicator is especially useful in sideway market to buy low sell high.
The ZigZag Buy Level is a specialized tool for traders who utilize market structure and classic ZigZag patterns to define key support and entry points. It automatically identifies "Main Highs"—significant highs confirmed by the subsequent price action—and then calculates a high-probability "Buy Level" based on a specified percentage pullback from that Main High to the last corrective low. This indicator helps you anticipate deep retracement entries, clearly marking them on the chart with labels
이 지표는 실제 거래에 완벽한 자동 파동 분석 지표입니다! 사례... 참고:   웨이브 그레이딩에 서양식 이름을 사용하는 데 익숙하지 않습니다. Tang Lun(Tang Zhong Shuo Zen)의 명명 규칙의 영향으로 기본 웨이브를   펜   으로 명명하고 2차 웨이브 밴드를   세그먼트   로 명명했습니다. 동시에, 세그먼트에는 추세 방향이 있습니다.   주요 추세 세그먼트에는   이름이 지정되지만(이 이름 지정 방법은 향후 노트에서 사용됩니다. 먼저 말씀드리겠습니다.) 알고리즘은 굴곡 이론과 거의 관련이 없으므로 그렇게 해서는 안 됩니다. 이는 나의 시장 분석을   통해 요약된 끊임없이 변화하고 복잡한 운영 규칙을   반영합니다. 밴드는 더 이상 사람마다 다르지 않도록 표준화되고 정의되었습니다. 인위적인 간섭의 드로잉 방법은 시장 진입을 엄격하게 분석하는 데 핵심적인 역할을 합니다. 이 지표를 사용하는 것은 거래 인터페이스의 미학을 개선하고 원래의 K-line 거래를
Deviation trend
VLADISLAV AKINDINOV
Indicator of trend deviation with a static level. The deviation coefficient is set for the trend histogram. Signals are the intersection of the level trend histogram in the direction of the trend or during a trend reversal - the option is selected in the indicator settings by the "Revers" parameter. There are all the necessary settings for the design of the indication and sending messages to mail or a mobile terminal. All input parameters have an intuitive name. Analog for MT4: https://www.mql5.
Super Scanner
Li Wei Huang
【Super Scanner】Indicator Introduction : The color of the Super Scanner which is green and climbing up means that the price trend is going up.The color of the Super Scanner is red and going down means that the price trend is going down. It is very simple to use it to judge the market trend! What's even better is that the open parameters of the indicators allow investors to adjust. You can adjust【Super Scanner】according to your needs. Adjust it faster to be closer to short-term market fluctuatio
This is the Super Trend Dashboard MT5. This dashboard will scan multiple timeframes in MT5 platform, from M1 chart to D1 chart. It will send the buy/sell signals by alert on the platform or sending notification to your phone or message you via a email. The buy signal is generated when the super trend line flip from SELL to BUY. The sell signal is is generated when the super trend line flip from BUY to SELL. The up trend color will be displayed depending on the current Super Trend value.
A useful scanner/dashboard that shows the RSI values for multiple symbols and Time-frames. It can be easily hidden/displayed with a simple click on the scanner man top left of the dashboard. You can input upper and lower RSI values and the colours can be set to show when above/below these values. The default values are 70 and 30. There are also input colours for when the RSI is above or below 50 (but not exceeding the upper/lower levels Symbols and time-frames are input separated by commas. S
Here’s a tight ~300-character text : A trendline break signals a potential shift in market direction. However, entry should only be taken after a confirmation candle. A strong bullish or bearish close beyond the trendline validates the breakout and reduces false signals, improving trade accuracy and confidence.    ShowPatterns ShowBullEngulf ShowBearEnguIf ShowHammer ShowShootingStar ShowMorningStar ShowEveningStar ShowMarubozu
Introduction This indicator detects volume spread patterns for buy and sell opportunity. The patterns include demand and supply patterns. You might use each pattern for trading. However, these patterns are best used to detect the demand zone (=accumulation area) and supply zone (=distribution area). Demand pattern indicates generally potential buying opportunity. Supply pattern indicates generally potential selling opportunity. These are the underlying patterns rather than direct price action. T
VVWAP Bandas
Edipaulo Zanella
Daily VWAP, continues for a period of hours (eg, 10 hours of history), with color to indicate change of direction and bands to map good entry and exit points. The indicator was created to map the center of the market, and find good buying moments, trend analysis or market correction points are easily detected, allowing you to understand moments of exhaustion and buying and selling points Copyright (c) <year> <copyright holders> Permission is hereby granted, free of charge, to any person obtaini
AUC Super Trends
Alfonso Urbano Cardenas
AUC - Super Trends 는 가격 움직임을 기반으로 시각적 라인을 통해 시장 방향을 표시하는 지표입니다. 이 지표는 가격 추적 시스템을 사용하여 상승 및 하락 구간의 변화를 나타냅니다. 라인은 시장 변화에 따라 자동으로 조정됩니다. 외환, 지수, 금과 같은 다양한 금융 상품과 여러 시간대에서 사용할 수 있습니다. ----------------------------------------------------------- 기능 시장 방향 시각화 가격 움직임 변화 식별 추세 분석 지원 ------------------------------------------------------------ 특징 상승 및 하락 구간의 시각적 표현 가격에 대한 자동 조정 이해하기 쉬운 구조 다양한 시간대 지원 여러 금융 상품에서 사용 가능 참고 이 지표는 시장 분석을 위한 보조 도구이며, 위험 관리나 사용자의 의사 결정을 대체하지 않습니다.
FREE
Harami Cross Trading System for MetaTrader 5 Harami Cross Trading System is a price action indicator for MT5 designed to detect 2-bar doji cross reversal patterns and generate structured trade setups after confirmation. A detailed user guide is available on the author’s MQL5 Blog . Additional updates are available through the author’s   MQL5 Channel . Depending on the current support policy, buyers may receive additional access to selected companion tools developed by the author. Overview Haram
A complex of indicators of recognizing reversal moments. Detects the peaks and hollows according to the combinations of candles after they deduct from two MA. Applicable for trading systems when using early inputs. You can use a trend for scalping and intraday trade, and for detecting a trend in the early stages. Possibilities The parameters provide flexible settings for any time floms and trading tools. There are several types of warning for signals. Yellow arrow - Sell signal , pink arrow -
In the context of trading, Malaysia SNR (Support and Resistance) refers to the technical analysis of support and resistance levels in financial markets, particularly for stocks, indices, or other assets traded. This is single timeframe version. Multiple timeframe version is avaiable here . There are three type of Malaysia SNR level Classic , GAP and Flipped 1. Classic Support is the price level at which an asset tends to stop falling and may start to rebound. It acts as a "floor" where demand is
LR Pivots Combo Statistics That Show You Where the Market Stands! Key Features (updated V2.1) 1. Auto-Plotting Linear Regression Channel Trend Direction — Uses slope (normalized by ATR) to identify whether the market is in an uptrend, downtrend, or ranging sideways. Trend Quality (R-Squared) — Tells you if the trend is statistically consistent (Stable) or just noise (Volatile). Useful for filtering out unreliable setups. Standard Deviation Bands — Shows how far price has deviated from the regre
Introduction to Fractal Pattern Scanner Fractal Indicator refers to the technical indicator that makes use of the fractal geometry found in the financial market. Fractal Pattern Scanner is the advanced Fractal Indicator that brings the latest trading technology after the extensive research and development work in the fractal geometry in the financial market. The most important feature in Fractal Pattern Scanner is the ability to measure the turning point probability as well as the trend probabil
MT5용 Crypto_Forex 지표 "추세 진입 히스토그램", 리페인트 없음. - 추세 진입 히스토그램 지표는 Entry_bar가 나타나면 추세 방향 진입 신호를 찾는 데 사용할 수 있습니다. - 이 지표는 가격과 거래량을 모두 고려하여 계산하는 고유한 특징을 가지고 있습니다. - 추세 진입 히스토그램은 두 가지 색상으로 제공됩니다. 빨간색은 약세 추세, 파란색은 강세 추세입니다. - 안정적인 추세(동일한 색상의 히스토그램 막대가 최소 10개 연속 표시)가 나타나면 Entry_bar가 표시될 때까지 기다리세요. - 진입 신호는 히스토그램에서 반대 색상의 열 하나와 초기 추세 색상의 다음 열입니다(그림 참조). - 숏 목표가를 사용하세요. 현재 추세에 따라 차트에서 가장 가까운 고가/저가를 사용하세요. - 지표에는 모바일 및 PC 알림 기능이 내장되어 있습니다. 사용 방법: - 매수 신호: 안정적인 강세 추세(파란색 히스토그램 막대) + 히스토그램의 빨간색 막대 1개 + 파란색
HIGH and LOW OTT
Mohammad Taher Halimi Tabrizi
This product is converted form Trading View of Kivanc Ozbilgic to be used on MT5 and below are descriptions of developer on Trading View: Anıl Özekşi's latest development on his precious OTT - Optimized Trend Tracker: In this version, there are two lines of OTT which are derived from HIGHEST price values (HOTT) and LOVEST price values (LOTT) which were originally sourced to CLOSE values on default OTT. Another significant difference is there is no Support Line (Moving Average) in this version
Elevate Your Trading Experience with the famous UT Bot Alert Indicator! Summary: The UT Bot Alert Indicator by Quant Nomad has a proven track record and is your gateway to a more profitable trading journey. It's a meticulously crafted tool designed to provide precision, real-time insights, and a user-friendly experience.  Key Features: 1. Precision Analysis: Powered by advanced algorithms for accurate trend identification, pinpointing critical support and resistance levels. 2. Real-time Alert
Mutliple MA
Bambang Arief
The Moving Average indicator remains one of the most popular tools in trading due to its simplicity, adaptability, and effectiveness in identifying market trends. Its role as a foundational tool for other technical indicators further cements its importance in both traditional and modern trading strategies. The Multi MA indicator has 8 Moving Averages which can be plotted simultaneously using a unique set up of each MA. Make Your Trading Simple dan Profit Again ! 
이 제품의 구매자들이 또한 구매함
ARIPoint
Temirlan Kdyrkhan
1 (1)
ARIPoint is a powerful trading companion designed to generate high-probability entry signals with dynamic TP/SL/DP levels based on volatility. Built-in performance tracking shows win/loss stats, PP1/PP2 hits, and success rates all updated live. Key Features: Buy/Sell signals with adaptive volatility bands Real-time TP/SL/DP levels based on ATR Built-in MA Filter with optional ATR/StdDev volatility Performance stats panel (Success, Profit/Loss, PP1/PP2) Alerts via popup, sound, push, or email Cu
Divergence Bomber
Ihor Otkydach
4.9 (86)
이 지표를 구매하신 분께는 다음과 같은 혜택이 무료로 제공됩니다: 각 거래를 자동으로 관리하고, 손절/익절 수준을 설정하며, 전략 규칙에 따라 거래를 종료하는 전용 도우미 툴 "Bomber Utility" 다양한 자산에 맞게 지표를 설정할 수 있는 셋업 파일(Set Files) "최소 위험", "균형 잡힌 위험", "관망 전략" 모드로 설정 가능한 Bomber Utility의 셋업 파일 이 전략을 빠르게 설치, 설정, 시작할 수 있도록 돕는 단계별 영상 매뉴얼 주의: 위의 모든 보너스를 받기 위해서는 MQL5 개인 메시지 시스템을 통해 판매자에게 연락해 주세요. 독창적인 커스텀 지표인 “Divergence Bomber(다이버전스 봄버)”를 소개합니다. 이 지표는 MACD 다이버전스(괴리) 전략을 기반으로 한 올인원(All-in-One) 거래 시스템입니다. 이 기술 지표의 주요 목적은 가격과 MACD 지표 간의 다이버전스를 감지하고, **향후 가격이 어느 방향으로 움직일지를 알려주는
Entry In The Zone and SMC Multi Timeframe is a real-time 2-in-1 market analysis tool that combines market structure analysis and a No Repaint BUY / SELL signal system into a single indicator, built on Smart Money Concepts (SMC) — a widely adopted framework used by professional traders to understand market structure. This indicator helps you see the market more clearly, make decisions based on structure rather than guesswork, and focus on high-probability zones where price is more likely to react
Quantum TrendPulse
Bogdan Ion Puscasu
5 (23)
SuperTrend   ,   RSI   ,   Stochastic   의 힘을 하나의 포괄적인 지표로 결합하여 트레이딩 잠재력을 극대화하는 궁극의 트레이딩 도구   인 Quantum TrendPulse를   소개합니다. 정밀성과 효율성을 추구하는 트레이더를 위해 설계된 이 지표는 시장 추세, 모멘텀 변화, 최적의 진입 및 종료 지점을 자신 있게 식별하는 데 도움이 됩니다. 주요 특징: SuperTrend 통합:   주요 시장 추세를 쉽게 따라가고 수익성의 물결을 타세요. RSI 정밀도:   매수 과다 및 매도 과다 수준을 감지하여 시장 반전 시점을 파악하는 데 적합하며 SuperTrend 필터로 사용 가능 확률적 정확도:   변동성이 큰 시장에서 숨겨진 기회를 찾기 위해 확률적 진동   을 활용하고 SuperTrend의 필터로 사용 다중 시간대 분석:   M5부터 H1 또는 H4까지 다양한 시간대에 걸쳐 시장을 최신 상태로 유지하세요. 맞춤형 알림:   맞춤형 거래 조건이 충족되면
이 지표를 구매하면 제 프로페셔널 트레이드 매니저를 무료로 드립니다. 우선 이 거래 시스템이 리페인팅, 리드로잉 및 레이그 인디케이터가 아니라는 점을 강조하는 것이 중요합니다. 이는 수동 및 로봇 거래 모두에 이상적인 것으로 만듭니다. 온라인 강좌, 설명서 및 프리셋 다운로드. "스마트 트렌드 트레이딩 시스템 MT5"은 새로운 및 경험이 풍부한 트레이더를 위해 맞춤형으로 제작된 종합적인 거래 솔루션입니다. 10개 이상의 프리미엄 인디케이터를 결합하고 7개 이상의 견고한 거래 전략을 특징으로 하여 다양한 시장 조건에 대한 다목적 선택이 가능합니다. 트렌드 추종 전략: 효과적인 트렌드 추이를 타기 위한 정확한 진입 및 손절 관리를 제공합니다. 반전 전략: 잠재적인 트렌드 반전을 식별하여 트레이더가 범위 시장을 활용할 수 있게 합니다. 스캘핑 전략: 빠르고 정확한 데이 트레이딩 및 단기 거래를 위해 설계되었습니다. 안정성: 모든 인디케이터가 리페인팅, 리드로잉 및 레이그가 아니므로 신뢰
Azimuth Pro
Ottaviano De Cicco
5 (6)
Azimuth Pro V2: Synthetic Fractal Structure and Confirmed Entries for MT5 Overview Azimuth Pro is a multi-level swing structure indicator by Merkava Labs . Four nested swing layers, swing-anchored VWAP, ABC pattern detection, three-timeframe structural filtering, and closed-bar confirmed entries — one chart, one workflow from micro-swings to macro-cycles. This is not a blind signal product. It is a structure-first workflow for traders who care about location, context, and timing. V2 Launch Offe
OmniSync Projection
Antonio-alin Teculescu
5 (1)
Chronos Fractal Engine is an innovative price projection indicator for MetaTrader 5, designed to transform your technical analysis by intelligently identifying and projecting historical price patterns. Built upon an advanced correlation algorithm and the fractal principles of the market, this powerful tool visualizes potential future price movements, giving you a unique edge in your trading decisions. What is Chronos Fractal Engine? At its core, the Chronos Fractal Engine employs a sophisticat
FX Trend MT5 NG
Daniel Stein
5 (4)
FX Trend NG: 차세대 멀티 마켓 트렌드 인텔리전스 개요 FX Trend NG 는 다중 시간 프레임 기반의 전문 트렌드 분석 및 시장 모니터링 도구입니다. 몇 초 만에 전체 시장 구조를 파악할 수 있도록 설계되었습니다. 여러 차트를 일일이 전환할 필요 없이, 어떤 종목이 추세에 있는지, 어디에서 모멘텀이 약화되고 있는지, 그리고 어떤 시간 프레임이 서로 정렬되어 있는지 즉시 확인할 수 있습니다. 출시 기념 특별 혜택 – FX Trend NG 를 $30 (6개월) 또는 $80 평생 라이선스 로 이용할 수 있습니다. 이미 Stein Investments 고객이신가요? -> 메시지를 보내 전용 고객 그룹에 참여하세요. 설정이나 사용 방법이 필요하신가요? -> Stein Investments 공식 페이지 를 방문하세요. 1. FX Trend NG가 특별한 이유 3단계 추세 로직 – 단순한 Buy / Sell이 아닙니다 • 대부분의 지표는 Buy 또는 Sell 두 가지 상태만 제
Trend Screener Pro MT5
STE S.S.COMPANY
4.85 (104)
트렌드 표시기, 트렌드 트레이딩 및 필터링을 위한 획기적인 고유 솔루션, 하나의 도구 안에 내장된 모든 중요한 트렌드 기능! Forex, 상품, 암호 화폐, 지수 및 주식과 같은 모든 기호/도구에 사용할 수 있는 100% 다시 칠하지 않는 다중 시간 프레임 및 다중 통화 표시기입니다. Trend Screener는 차트에 점이 있는 화살표 추세 신호를 제공하는 효율적인 지표 추세 추종 지표입니다. 추세 분석기 표시기에서 사용할 수 있는 기능: 1. 트렌드 스캐너. 2. 최대 이익 분석이 있는 추세선. 3. 추세 통화 강도 측정기. 4. 경고가 있는 추세 반전 점. 5. 경고가 있는 강력한 추세 점. 6. 추세 화살표 Trend Screener Indicator가 있는 일일 분석 예, 일일 신호 성능...등은 여기에서 찾을 수 있습니다. 여기를 클릭하십시오. LIMITED TIME OFFER : Trend Screener Indicator는 50$ 및 평생 동안만 사용할 수 있습니다.
Grabber System MT5
Ihor Otkydach
4.83 (23)
탁월한 기술적 지표인 Grabber를 소개합니다. 이 도구는 즉시 사용 가능한 “올인원(All-Inclusive)” 트레이딩 전략으로 작동합니다. 하나의 코드 안에 강력한 시장 기술 분석 도구, 매매 신호(화살표), 알림 기능, 푸시 알림이 통합되어 있습니다. 이 인디케이터를 구매하신 모든 분들께는 다음의 항목이 무료로 제공됩니다: Grabber 유틸리티: 오픈 포지션을 자동으로 관리하는 도구 단계별 영상 매뉴얼: 설치, 설정, 그리고 실제 거래 방법을 안내 맞춤형 세트 파일: 인디케이터를 빠르게 자동 설정하여 최고의 성과를 낼 수 있도록 도와줍니다 다른 전략은 이제 잊어버리세요! Grabber만이 여러분을 새로운 트레이딩의 정점으로 이끌어 줄 수 있습니다. Grabber 전략의 주요 특징: 거래 시간 프레임: M5부터 H4까지 거래 가능한 자산: 어떤 자산이든 사용 가능하지만, 제가 직접 테스트한 종목들을 추천드립니다 (GBPUSD, GBPCAD, GBPCHF, AUDCAD, AU
Power Bar MT5
Daniel Stein
실제 자금을 투입하기 전에 어떤 전략이 내 심볼에서 효과적인지 확인하세요. Power Bar는 모든 심볼과 모든 타임프레임에서 극단적인 가격 바 를 감지한 다음, 3가지 다른 트레이딩 전략을 즉시 백테스트하여 승률, 수익 팩터, 손익을 나란히 비교할 수 있습니다. 모든 것이 하나의 인터랙티브 패널에 담겨 있습니다. 추측 없음. 커브 피팅 없음. 오직 데이터뿐입니다. Power Bar가 특별한 이유 대부분의 인디케이터는 신호를 주고 그것이 효과가 있는지는 추측에 맡깁니다. Power Bar는 한 걸음 더 나아갑니다 - 모든 신호를 세 가지 전략 에 대해 테스트하고 통계를 보여줍니다. FlipFlop, Momentum, Reversal을 원클릭으로 전환하고 숫자가 즉시 변하는 것을 확인하세요. FlipFlop - 항상 포지션 유지. 신호에 진입하고, 반대 신호에 청산. 당사의 연구에 따르면 US30, US500, DAX와 같은 추세가 있는 지수에서 가장 효과적입니다. Momentum
CGE Trading Suite
Carl Gustav Johan Ekstrom
5 (2)
Institutional-Grade Analytics for MT5 C GE Trading Suite delivers the analytical edge typically reserved for professional trading desks. The platform integrates a full suite of analytical tools into one seamless workflow: dynamic grid mapping, liquidity behavior analysis, ECM, trend lines, MIDAS, trade cycles, and directional channel projections. Together, these provide a unified view of market structure and momentum. Directional clarity is further enhanced by the capital flow index, which meas
SignalTech MT5
Yue Wang
5 (2)
SignalTech MT5 is a trading system for EURUSD, USDCHF, USDJPY, AUDUSD, NZDUSD, EURJPY, AUDJPY, NZDJPY, CADJPY H2 and H3 Timeframe.  It can generate signals with Buy/Sell Arrows and Pop-Up/Sound Alerts. Each signal has clear Entry and Stop Loss levels, which should be automatically flagged on the chart, as well as potential Targets 1, 2, and 3. The Entry and TP levels are fixed after the trade is taken. The exit level is dynamic. If there are signs of a potential short-term trend reversal, the
Atomic Analyst MT5
Issam Kassas
3.94 (31)
우선적으로 언급할 점은이 거래 지표가 다시 그리지 않고 지연되지 않으며 이를 통해 수동 및 로봇 거래 모두에 이상적이라는 점입니다. 사용자 매뉴얼: 설정, 입력 및 전략. Atomic Analyst는 가격의 강도와 모멘텀을 활용하여 시장에서 더 나은 이점을 찾는 PA Price Action Indicator입니다. 고급 필터를 장착하여 잡음과 거짓 신호를 제거하고 거래 잠재력을 높이는 데 도움이 됩니다. 복잡한 지표의 다중 레이어를 사용하여 Atomic Analyst는 차트를 스캔하고 복잡한 수학적 계산을 간단한 신호와 색상으로 변환하여 초보 트레이더가 이해하고 일관된 거래 결정을 내릴 수 있도록합니다. "Atomic Analyst"는 새로운 및 경험이 풍부한 트레이더를위한 종합적인 거래 솔루션입니다. 프리미엄 지표와 최고 수준의 기능을 하나의 거래 전략에 결합하여 모든 종류의 트레이더에 대한 다재다능한 선택지가되었습니다. 인트라데이 거래 및 스캘핑 전략 : 빠르고 정확한 일일
FX Power MT5 NG
Daniel Stein
5 (31)
FX Power: 통화 강세 분석으로 더 스마트한 거래 결정을 개요 FX Power 는 어떤 시장 상황에서도 주요 통화와 금의 실제 강세를 이해하기 위한 필수 도구입니다. 강한 통화를 매수하고 약한 통화를 매도함으로써 FX Power 는 거래 결정을 단순화하고 높은 확률의 기회를 발견합니다. 트렌드를 따르거나 극단적인 델타 값을 사용해 반전을 예측하고자 한다면, 이 도구는 귀하의 거래 스타일에 완벽히 적응합니다. 단순히 거래하지 말고, FX Power 로 더 스마트하게 거래하세요. 1. FX Power가 거래자에게 매우 유용한 이유 통화와 금의 실시간 강세 분석 • FX Power 는 주요 통화와 금의 상대적 강세를 계산하고 표시하여 시장 역학에 대한 명확한 통찰력을 제공합니다. • 어떤 자산이 앞서고 있고 어떤 자산이 뒤처지는지 모니터링하여 보다 현명한 거래 결정을 내릴 수 있습니다. 포괄적인 멀티 타임프레임 뷰 • 단기, 중기 및 장기 타임프레임에서 통화와 금의 강세를
Btmm state engine pro
Garry James Goodchild
5 (4)
BTMM State Engine Pro is a MetaTrader 5 indicator for traders who use the Beat The Market Maker approach: Asian session context, kill zone timing, level progression, peak formation detection, and a multi-pair scanner from a single chart. It combines cycle state logic with a built-in scanner dashboard so you do not need the same tool on many charts at once. What it does Draws the Asian session range; session times can follow broker server offset or be set in inputs. Tracks level progression (L
소개       Quantum Breakout PRO   , 브레이크아웃 존 거래 방식을 변화시키는 획기적인 MQL5 지표! 13년 이상의 거래 경험을 가진 숙련된 트레이더 팀이 개발한       퀀텀 브레이크아웃 PRO       혁신적이고 역동적인 브레이크아웃 존 전략으로 거래 여정을 새로운 차원으로 끌어올리도록 설계되었습니다. Quantum Breakout Indicator는 5개의 이익 목표 영역이 있는 브레이크아웃 영역의 신호 화살표와 브레이크아웃 상자를 기반으로 한 손절 제안을 제공합니다. 초보자 거래자와 전문 거래자 모두에게 적합합니다. Quantum EA 채널:       여기를 클릭하세요 중요한! 구매 후 설치 매뉴얼을 받으려면 개인 메시지를 보내주십시오. 추천: 기간: M15 통화쌍: GBPJPY, EURJPY, USDJPY,NZDUSD, XAUUSD 계정 유형: 스프레드가 매우 낮은 ECN, Raw 또는 Razor 브로커 시간: GMT +3 중개인 :
Bill Williams Advanced
Siarhei Vashchylka
5 (11)
Bill Williams Advanced is designed for automatic chart analysis using Bill Williams' "Profitunity" system. The indicator analyzes four timeframes at once. Manual (Be sure to read before purchasing) Advantages 1. Analyzes the chart using Bill Williams' "Profitunity" system. Signals are displayed in a table in the corner of the screen and on the price chart. 2. Finds all known AO and AC signals, as well as zone signals. Equipped with a trend filter based on the Alligator. 3. Finds "Divergence Bar
Berma Bands
Muhammad Elbermawi
5 (8)
Berma Bands(BBs) 지표는 시장 동향을 파악하고 이를 활용하려는 트레이더에게 귀중한 도구입니다. 가격과 BBs 간의 관계를 분석함으로써 트레이더는 시장이 추세 단계인지 범위 단계인지를 분별할 수 있습니다. 자세한 내용을 알아보려면 [ Berma Home Blog ]를 방문하세요. 버마 밴드는 세 개의 뚜렷한 선으로 구성되어 있습니다. 어퍼 버마 밴드, 미들 버마 밴드, 로어 버마 밴드입니다. 이 선들은 가격 주위에 그려져 전체 추세에 대한 가격 움직임을 시각적으로 표현합니다. 이 밴드들 사이의 거리는 변동성과 잠재적인 추세 반전에 대한 통찰력을 제공할 수 있습니다. 버마 밴드 라인이 각각에서 분리될 때, 그것은 종종 시장이 횡보 또는 범위 이동 기간에 접어들고 있음을 시사합니다. 이는 명확한 방향 편향이 없음을 나타냅니다. 트레이더는 이러한 기간 동안 추세를 파악하기 어려울 수 있으며 더 명확한 추세가 나타날 때까지 기다릴 수 있습니다. 버마 밴드 라인이 단일 라인으로
Meridian Pro
Ottaviano De Cicco
5 (1)
Meridian Pro: Professional Multi-Timeframe Trend Matrix for MT5 Overview Meridian Pro is a multi-timeframe trend matrix by Merkava Labs that compresses directional state, strength, momentum condition and matrix agreement into one compact panel. One adaptive engine, applied consistently from M1 to W1. No per-symbol tuning. No indicator stacking. One structured readout across every asset and every timeframe. Launch Offer — Get Meridian Pro for USD 99 (introductory). Regular price: USD 149. 1. Why
ARICoins
Temirlan Kdyrkhan
ARICoin is a powerful trading companion designed to generate high-probability entry signals with dynamic TP/SL/DP levels based on volatility. Built-in performance tracking shows win/loss stats, PP1/PP2 hits, and success rates all updated live. Key Features: Buy/Sell signals with adaptive volatility bands Real-time TP/SL/DP levels based on ATR Built-in MA Filter with optional ATR/StdDev volatility Performance stats panel (Success, Profit/Loss, PP1/PP2) Alerts via popup, sound, push, or email Cust
Volume flow Profile
Israr Hussain Shah
Master Edition은 거래량과 자금 흐름의 관점을 통해 시장 구조를 시각화하도록 설계된 전문가급 분석 도구입니다. 표준 거래량 지표와 달리, 이 도구는 차트에 일일 거래량 프로필을 직접 표시하여 가격 발견이 발생한 위치와 "스마트 머니"가 위치한 곳을 정확하게 볼 수 있게 합니다. 이 Master Edition은 명확성과 속도를 위해 설계되었으며, 로드 시 차트 레이아웃을 즉시 아름답게 만드는 독특한 자동 테마 동기화 시스템을 특징으로 합니다. 주요 기능: 진정한 자금 흐름 계산: 표준 틱 거래량을 넘어섭니다. "Use Money Flow"를 활성화하면 거래량이 가격에 따라 가중치가 부여되어 특정 가격 수준에서의 실제 자본 투입을 드러냅니다. 가치 영역(VA) 시각화: 가치 영역(기본값: 거래량의 70%)을 자동으로 계산합니다. VA Fill: 통제 구역을 즉시 식별하기 위해 가치 영역 배경을 음영 처리합니다. 주요 수준: 통제점(POC), 가치 영역 고점(VAH), 가치 영
ON Trade Gann Squares MT5
Abdullah Alrai
5 (2)
간 스퀘어 지표는 W.D. 간이 쓴 "시장 예측을 위한 수학적 공식" 기사에 기반한 강력한 시장 분석 도구입니다. 이 도구는 수학적 개념과 간 이론을 사용하여 정확한 시장 분석을 수행합니다. 144, 90, 52의 제곱과 9의 제곱을 사용합니다. 또한 의 9의 제곱근 및 해당 제곱의 채널 및 스타 패턴과의 관련성을 통합합니다. 사용자 메뉴얼 및 적용: 이 지표를 사용하기 전에 사용자 메뉴얼을 읽고 질문이 있을 경우 문의하시기 바랍니다. 전체 메뉴얼은 웹사이트에서 제공됩니다. MT5의 전체 버전을 구매하거나 MT4의 무료 버전을 테스트할 수 있습니다. 두 버전 모두 링크에서 확인하실 수 있습니다. 주요 기능 및 기능: 간 스퀘어 지표는 정확한 결정을 위해 기하학적 개념과 간 이론을 활용하는 시장 분석을 위한 포괄적인 도구 집합을 제공합니다. 주요 기능은 다음과 같습니다. 9의 제곱 분석:   이 지표는 9의 제곱에 대한 수평 선, 스타 패턴, 그리드 및 간 팬을 그릴 수 있습니다. 간
Cvd Divergence
Thalles Nascimento De Carvalho
CVD Divergence – 전문적인 주문 흐름 및 다이버전스 분석 CVD Divergence는 가격과 Cumulative Delta Volume(CVD) 사이의 신뢰할 수 있는 다이버전스를 감지하기 위해 개발된 기술적 지표입니다. 실제 주문 흐름이 가격 움직임을 확인하지 않을 때를 정확하게 포착하여, 잠재적 추세 전환, 매수·매도 세력의 소진, 기관의 시장 조작 가능성을 보여줍니다. 이 지표는 공격적인 거래량 분석과 가격 구조 해석을 결합해 명확하고 객관적이며 빠른 신호를 제공합니다. 지표 기능 CVD Divergence는 누적 델타 거래량을 사용하여 주문 흐름의 방향과 가격 방향을 비교합니다. 두 값이 크게 괴리될 경우 차트에 시각적 표시를 남기고 다이버전스 방향을 명확하게 보여줍니다. 다음과 같은 상황을 감지합니다: 강세 다이버전스 (가격이 하락하지만 CVD가 상승할 때) 약세 다이버전스 (가격이 상승하지만 CVD가 하락할 때) 매수·매도 세력의 힘 고갈 기관 주문 불균형으로
FX Volume MT5
Daniel Stein
4.79 (24)
FX Volume: 브로커 시각에서 바라보는 진짜 시장 심리 간단 요약 트레이딩 접근 방식을 한층 더 향상시키고 싶으신가요? FX Volume 는 소매 트레이더와 브로커의 포지션을 실시간으로 파악할 수 있게 해 줍니다. 이는 COT 같은 지연된 보고서보다 훨씬 빠릅니다. 꾸준한 수익을 추구하는 분이든, 시장에서 더 깊은 우위를 원하시는 분이든, FX Volume 을 통해 대규모 불균형을 찾아내고, 돌파 여부를 확인하며 리스크 관리를 정교화할 수 있습니다. 지금 시작해 보세요! 실제 거래량 데이터가 의사결정을 어떻게 혁신할 수 있는지 직접 경험해 보시기 바랍니다. 1. 트레이더에게 FX Volume이 매우 유익한 이유 탁월한 정확도를 지닌 조기 경보 신호 • 다른 사람들보다 훨씬 앞서, 각 통화쌍을 매수·매도하는 트레이더 수를 거의 실시간으로 파악할 수 있습니다. • FX Volume 은 여러 리테일 브로커에서 추출한 실제 거래량 데이터를 종합해 명확하고 편리한 형태로 제공하는
우선적으로, 이 거래 도구는 전문적인 거래에 이상적인 비-다시 그리기 및 지연되지 않는 지표입니다.  온라인 강좌, 사용자 매뉴얼 및 데모. 스마트 가격 액션 컨셉트 인디케이터는 신규 및 경험 많은 트레이더 모두에게 매우 강력한 도구입니다. Inner Circle Trader Analysis 및 Smart Money Concepts Trading Strategies와 같은 고급 거래 아이디어를 결합하여 20가지 이상의 유용한 지표를 하나로 결합합니다. 이 인디케이터는 스마트 머니 컨셉트에 중점을 두어 대형 기관의 거래 방식을 제공하고 이동을 예측하는 데 도움을 줍니다.  특히 유동성 분석에 뛰어나 기관이 어떻게 거래하는지 이해하는 데 도움을 줍니다. 시장 트렌드를 예측하고 가격 변동을 신중하게 분석하는 데 탁월합니다. 귀하의 거래를 기관 전략에 맞추어 시장의 동향에 대해 더 정확한 예측을 할 수 있습니다. 이 인디케이터는 시장 구조를 분석하고 중요한 주문 블록을 식별하고 다양
Gartley Hunter Multi
Siarhei Vashchylka
5 (11)
Gartley Hunter Multi - An indicator for searching for harmonic patterns simultaneously on dozens of trading instruments and on all possible timeframes. Manual (Be sure to read before purchasing) | Version for MT4 Advantages 1. Patterns: Gartley, Butterfly, Shark, Crab. Bat, Alternate Bat, Deep Crab, Cypher 2. Simultaneous search for patterns on dozens of trading instruments and on all possible timeframes 3. Search for patterns of all possible sizes. From the smallest to the largest 4. All fou
Basic Harmonic Patterns Dashboard MT5
Mehran Sepah Mansoor
4.36 (11)
이 대시보드는 선택한 심볼에 대해 사용 가능한 최신 고조파 패턴을 표시하므로 시간을 절약하고 더 효율적으로 사용할 수 있습니다 /   MT4 버전 . 무료 인디케이터:   Basic Harmonic Pattern 인디케이터 열 Symbol :   선택한 심볼이 나타납니다 Trend :   강세 또는 약세 Pattern :   패턴 유형(가틀리, 나비, 박쥐, 게, 상어, 사이퍼 또는 ABCD) Entry :   진입 가격 SL:   스톱로스 가격 TP1:   1차 테이크프로핏 가격 TP2:   2차 테이크프로핏 가격 TP3:   3차 테이크프로핏 가격 Current price:   현재 가격 Age (in bars):   마지막으로 그려진 패턴의 나이 주요 입력 Symbols :   "28개 주요 통화쌍" 또는 "선택한 심볼" 중에서 선택합니다. Selected Symbols :   쉼표로 구분하여 모니터링하려는 원하는 심볼("EURUSD,GBPUSD,XAUUSD")을 선택
Weltrade Spike Sentinel
Batsirayi L Marango
5 (1)
Introducing Indicator for PainX and GainX Indices Traders on Weltrade Get ready to experience the power of trading with our indicator, specifically designed for Weltrade   broker's PainX and GainX Indices.  Advanced Strategies for Unbeatable Insights Our indicator employs sophisticated strategies to analyze market trends, pinpointing optimal entry and exit points.  Optimized for Maximum Performance To ensure optimal results, our indicator is carefully calibrated for 5-minute timeframe charts on
Presenting one-of-a-kind Gann Indicator for XAUUSD IQ Gold Gann Levels is a non-repainting, precision tool designed exclusively for XAUUSD/Gold intraday trading. It uses W.D. Gann’s square root method to plot real-time support and resistance levels, helping traders spot high-probability entries with confidence and clarity. William Delbert Gann (W.D. Gann) was an exceptional market analyst whose trading technique was based on a complex blend of mathematics, geometry, astrology, and ancient calcul
제작자의 제품 더 보기
SourcePoint是一个很好的中长线交易指示器,他能独立使用,也可以去其他趋势型指标独立使用,可以很明确的给出趋势走向,很好的指出最佳的buy和sell位置,指标不含有未来函数,不会重新绘制,不仅能够应用到自己的手动交易过程中,还能完全可以写入到自己的EA中,如果你需要 MT5版本 可以去( https://www.mql5.com/zh/market/product/101744?source=Site +Market+My+Products+Page#description) 。 (如果你感觉到这个指标能够帮助你进行更准确的交易,请帮忙给个好评,希望我的作品能够帮助更多有需要的人) ===================参数列表===================== fastP: 96 slowP:208 avgP:72 =================参考使用方法=================== 此指标可以适用于任何交易品种,能够用在任何周期。 个人建议:短线交易选择M5,中长线交易选择M15 每次形成一个交点,就是一个交易机会,同时也是一个持仓平仓点位。建议配合
BS Trend Line For MT4是一款很好的买卖指示器,不含有未来函数,不会重绘,新版本已经加入了更好的过滤算法,开单成功率有了很大的提高,是一个很好的波段交易提示器,尤其是配合 SourcePoint For MT4 会有更明显的效果,它能帮你过滤掉接近70%以上的无效交易信号。 ===================参数列表===================== timeframe:M5 gip:30 sip:6 up line:80 down line:20 ===================使用方法===================== 配合 SourcePoint For MT4 使用时, SourcePoint For MT4 的参数 fastP: 96 slowP:208 avgP:72
BS Trend Line是一款很好的买卖指示器,不含有未来函数,不会重绘,新版本已经加入了更好的过滤算法,开单成功率有了很大的提高,是一个很好的波段交易提示器,尤其是配合 SourcePoint 会有更明显的效果,它能帮你过滤掉接近70%以上的无效交易信号。 ===================参数列表===================== timeframe:M1 gip:30 sip:6 up line:80 down line:20 ===================使用方法===================== 配合 SourcePoint 使用时, SourcePoint 的参数 fastP: 96 slowP:208 avgP:72
BestPointOfInitiation是一个很好的短线交易指示器,能与 ShortBS ( https://www.mql5.com/zh/market/product/96796 )完美的配合,可以很好的指出最佳的buy和sell位置,指标不含有未来函数,不会重新绘制,不仅能够应用到自己的手动交易过程中,还能完全可以写入到自己的EA中。(如果你感觉到这个指标能够帮助你进行更准确的交易,请帮忙给个好评,希望我的作品能够帮助更多多有需要的人) ===================参数列表===================== fastPeriod: 9 slowPeriod:30 PassivationCoefficient:5 =================参考使用方法=================== 此指标可以适用于任何交易品种,能够用在任何周期。
TradingDirection是一个针对中长线交易的趋势指标。在图上你能很清晰的看到什么时候是上涨趋势,什么时候是下跌趋势,同时在趋势中,你能看到很明显的补仓位置和减仓位置。同时它与 BestPointOfInitiation( https://www.mql5.com/zh/market/product/96671 )指标可以形成完美的配合,两个指标相互配合更能很好的把握开单时机。 ===================参数列表===================== fastPeriod: 9 slowPeriod:30 PassivationCoefficient:5 =================参考使用方法=================== 此指标可以适用于任何交易品种,能够用在任何周期。
ShortBS
Yan Qi Zhu
ShortBS是一个很好的短线交易指示器,能很好与 BestPointOfInitiation ( https://www.mql5.com/zh/market/product/96671 )配合,能让你找到最合适的buy和sell位置,指标不含有未来函数,不会重新绘制。是一个针对(如果你感觉到这个指标能够帮助你进行更准确的交易,请帮忙给个好评,希望我的作品能够帮助更多有需要的人) ===================参数列表===================== maPeriod: 25 slowPeriod:20 fastPeriod:10 stepPeriod:5 =================参考使用方法=================== 此指标可以适用于任何交易品种,能够用在任何周期。
HighQualityMap是一个很好的中长线交易指示器,这个指标可以单独使用,尤其是用在M30或者大于M30的时间框架下,它能很好的体现出趋势的走向,以及转折点,你可以很快的从这个指示器上寻找到最佳的buy和sell位置,同时也能很好根据指示器去坚守自己的持仓定订单。指标不含有未来函数,不会重新绘制,不仅能够应用到自己的手动交易过程中,还能完全可以写入到自己的EA中。(如果你感觉到这个指标能够帮助你进行更准确的交易,请帮忙给个好评,希望我的作品能够帮助更多有需要的人) ===================参数列表===================== 所有参数均采用默认参数即可,无需更改,若为激进型交易者,可以根据自己的需要来调整参数。 =================参考使用方法=================== 此指标可以适用于任何交易品种,使用周期框架大于M30相对更准确。
SourcePoint是一个很好的中长线交易指示器,他能独立使用,也可以去其他趋势型指标独立使用,可以很好的指出最佳的buy和sell位置,指标不含有未来函数,不会重新绘制,不仅能够应用到自己的手动交易过程中,还能完全可以写入到自己的EA中。建议配合BS TrendLine( https://www.mql5.com/zh/market/product/96476?source=Site+Market+My+Products+Page ) 一起使用。 (如果你感觉到这个指标能够帮助你进行更准确的交易,请帮忙给个好评,希望我的作品能够帮助更多有需要的人) ===================参数列表===================== fastP: 12 slowP:26 avgP:9 =================参考使用方法=================== 此指标可以适用于任何交易品种,能够用在任何周期。 每次形成一个交点,就是一个交易机会,同时也是一个持仓平仓点位。建议配合大小周期一起使用,这样更容易让你找到更精准的入场位置和出场位置
StartPoint
Yan Qi Zhu
StartPoint是一个很好的短线交易指示器,这个指标可以单独使用,但是最好是配合 HighQualityMap 一起使用,适用于任何时间框架,喜欢超短线的朋友可以使用M5时间框架。它能很好的体现出短期趋势的启动点,你可以很快的从这个指示器上寻找到最佳的buy和sell位置,同时也能很好根据指示器去坚守自己的持仓定订单。指标不含有未来函数,不会重新绘制,不仅能够应用到自己的手动交易过程中,还能完全可以写入到自己的EA中。(如果你感觉到这个指标能够帮助你进行更准确的交易,请帮忙给个好评,希望我的作品能够帮助更多有需要的人) ===================参数列表===================== 所有参数均采用默认参数即可,无需更改,若为激进型交易者,可以根据自己的需要来调整参数。 =================参考使用方法=================== 此指标可以适用于任何交易品种。
GoldPorter는 XAUUSD에만 적용됩니다. 골드포터(GoldPorter)는 당사 팀이 XAUUSD를 위해 특별히 제작한 전문 상용 EA(전문가 어드바이저)입니다. 지속적인 안정성이 가장 큰 특징입니다. 단기간에 폭발적인 수익을 추구하신다면, 안타깝게도 이 EA는 적합하지 않습니다. 시장에서 지속적이고 안정적으로 이익을 얻는 것이 당사의 목표입니다. GoldPorter는 여러분의 시간과 정력을 완전히 해방시켜 여행, 가족과의 시간, 삶을 즐기는 등 다른 일에 집중할 수 있게 합니다. 거래는 GoldPorter에게 맡기세요. 오직 거래에만 전념합니다. 복잡한 설정으로 번거롭지 않도록, 프로그램 내에서 가능한 많은 설정을 자동화하여 필수적인 최소한의 설정만 남겼습니다. 모든 주문에는 대응하는 익절과 손절이 설정되어 있으며, 트레일링 스탑 기능을 추가해 얻은 수익이 다시 손실로 전환되는 것을 방지하여 사용자에게 매우 친화적입니다. ​ 제품 사양:​ ​ 거래 상품: XAUUSD 시간
필터:
리뷰 없음
리뷰 답변