Deviation trend
- 지표
- 버전: 7.61
- 업데이트됨: 28 8월 2023
- 활성화: 5

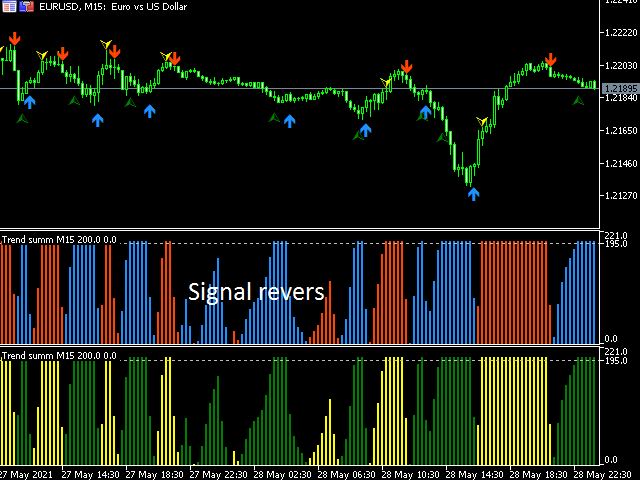
Indicator of trend deviation with a static level. The deviation coefficient is set for the trend histogram. Signals are the intersection of the level trend histogram in the direction of the trend or during a trend reversal - the option is selected in the indicator settings by the "Revers" parameter. There are all the necessary settings for the design of the indication and sending messages to mail or a mobile terminal. All input parameters have an intuitive name.
Analog for MT4: https://www.mql5.com/ru/market/product/67339
Link to an Expert Advisor for this indicator: https://www.mql5.com/en/market/product/62057