Retracement Reversals and SR Pro

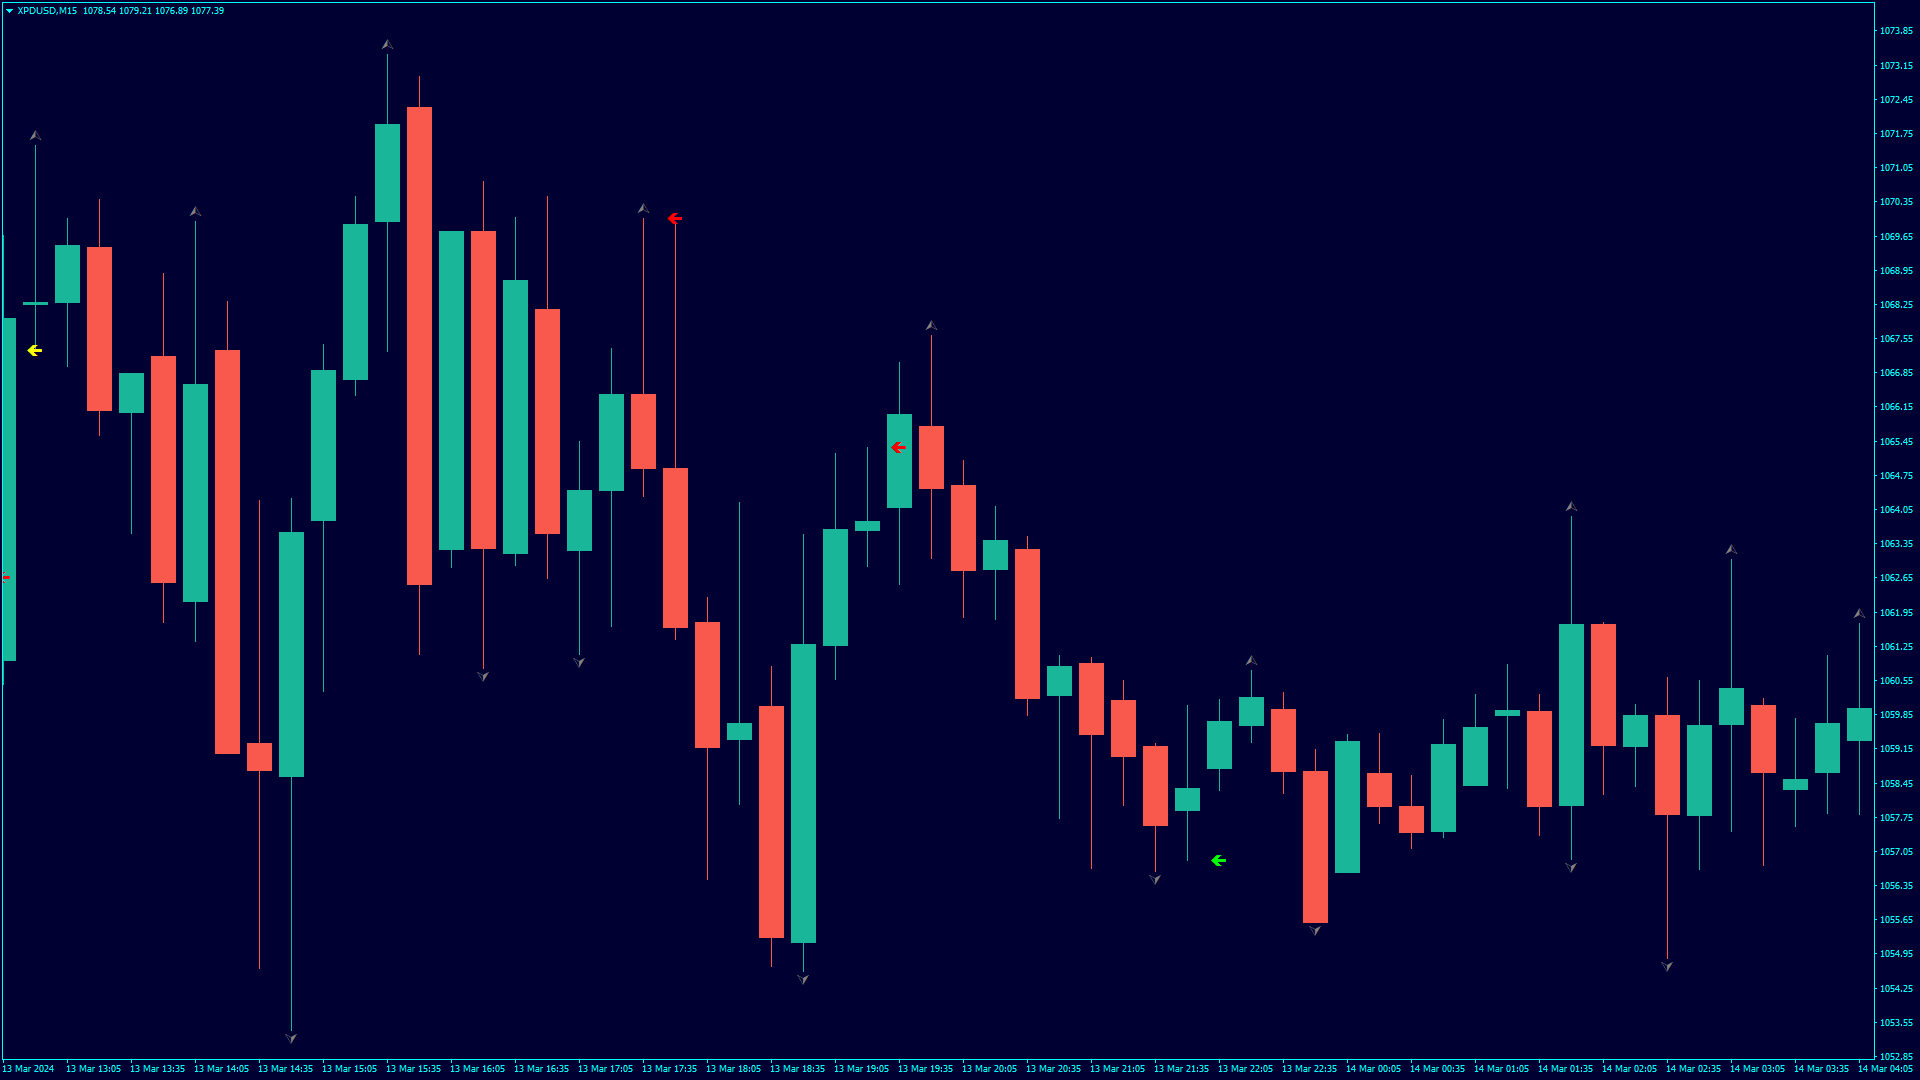
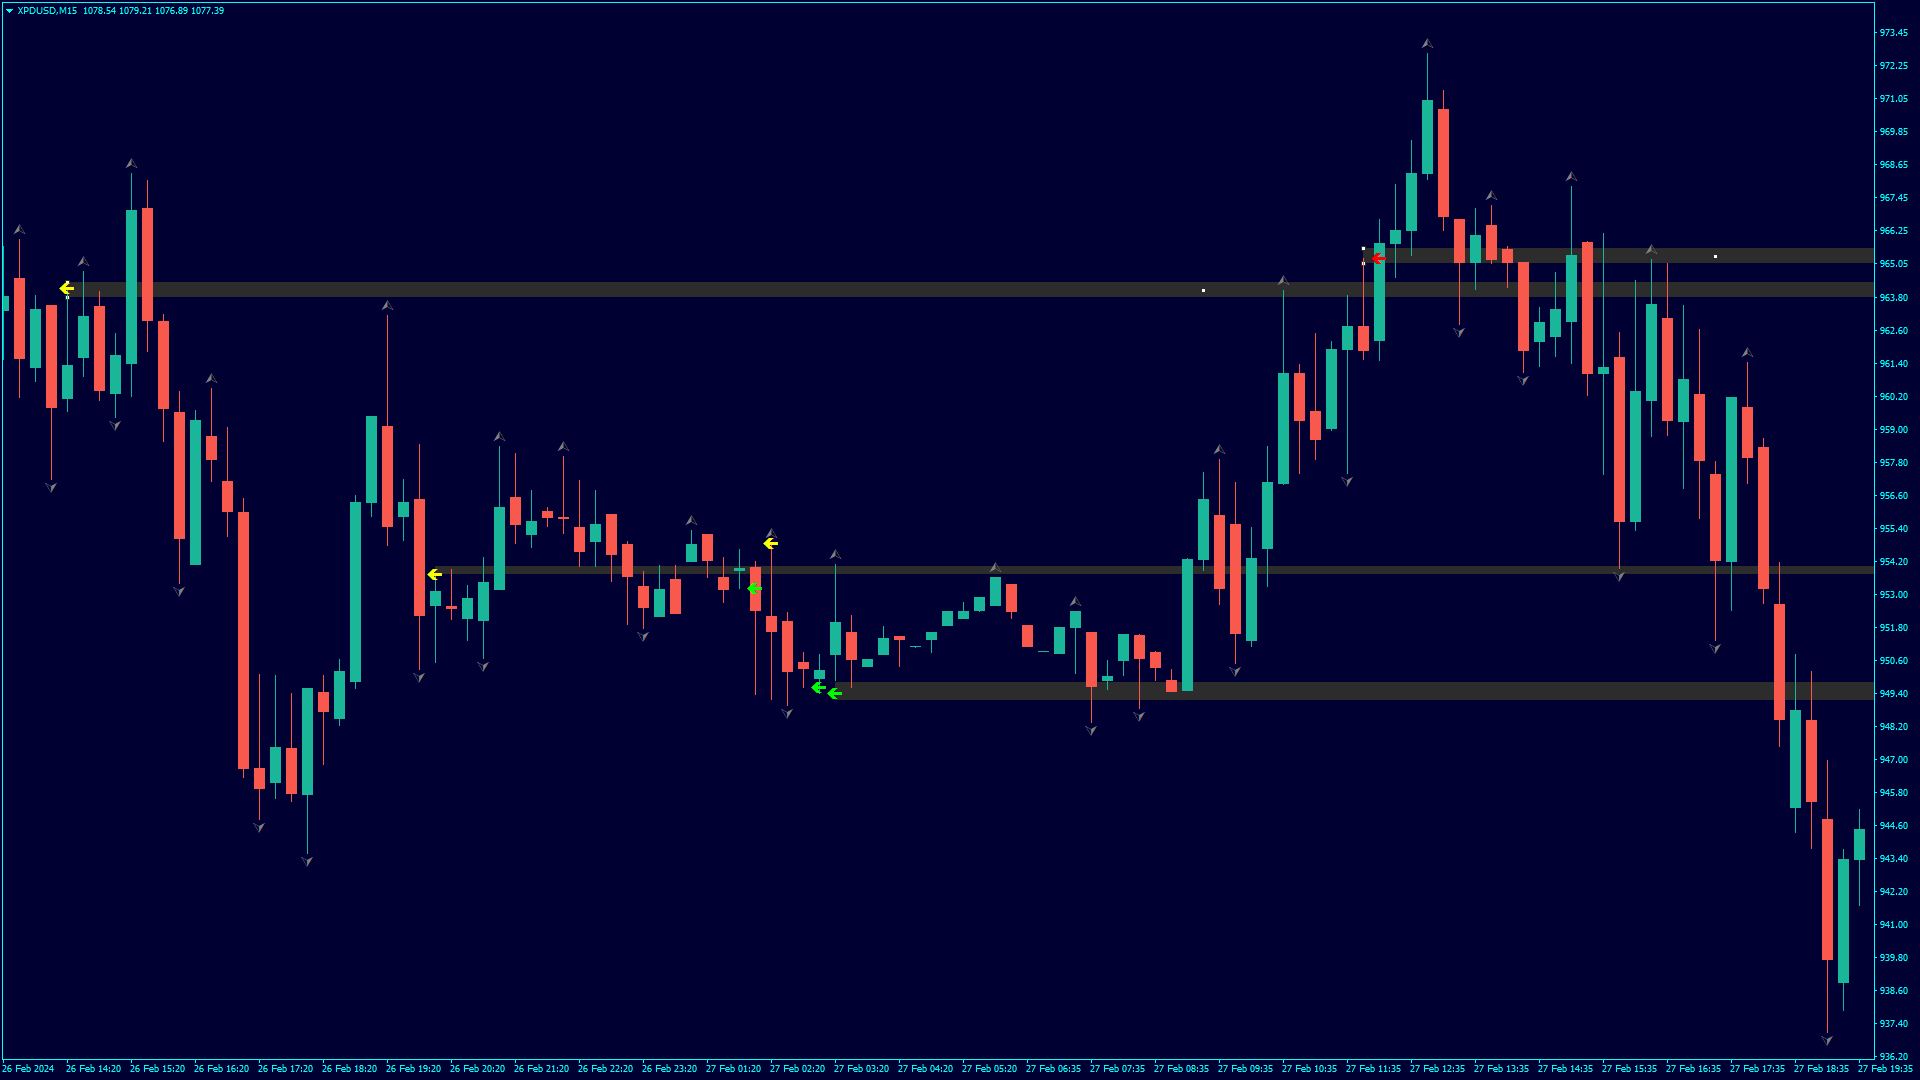
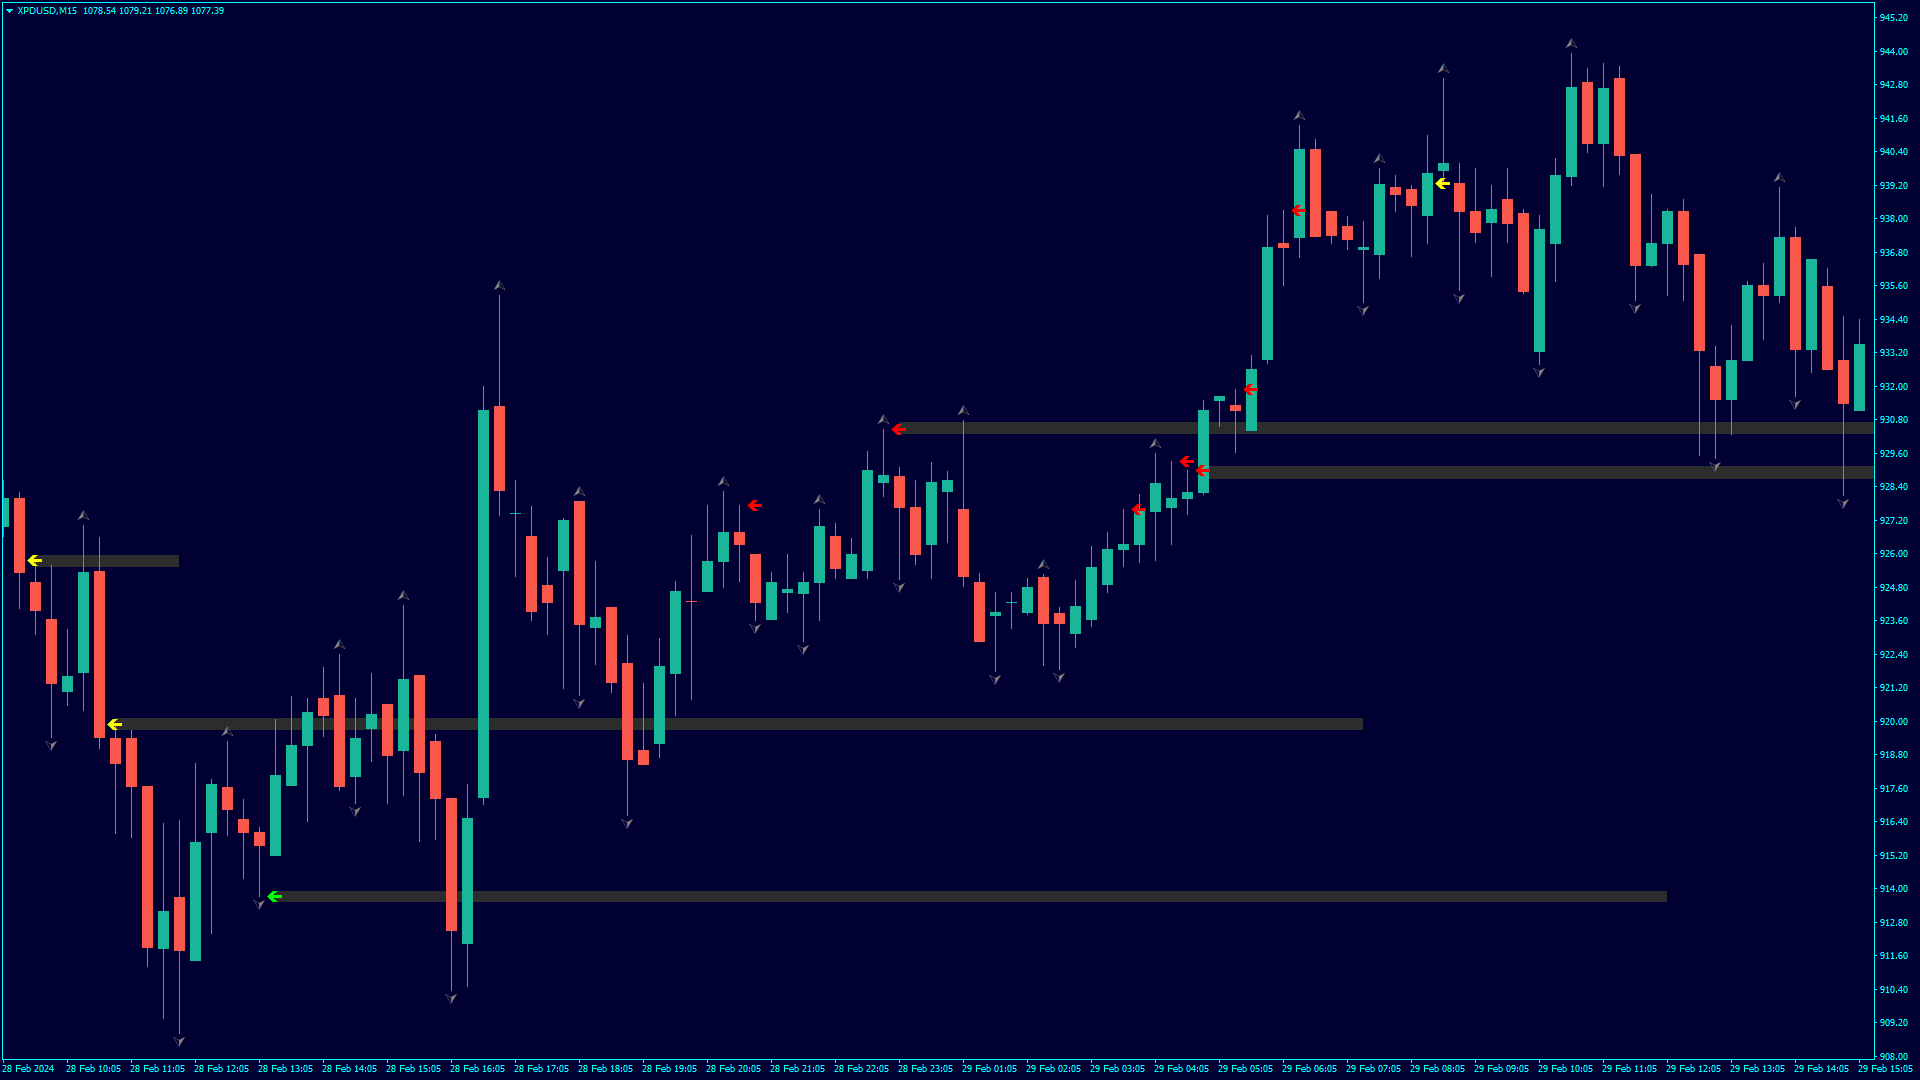
Retracement Reversal and Support and Resistance Pro is based on a formula used by Proprietary trading firms and other big institutions on WallStreet including on my Company and used by my traders here in the capital of the world. This indicator will create Red and Green arrows on a possible mayor Retracement level,  Reversal Level and future Support and Resistance levels and  Yellow arrows on a possible minor Retracement level,  Reversal Level and future Support and Resistance levels. This indicator works on every market/Pair.

Features:

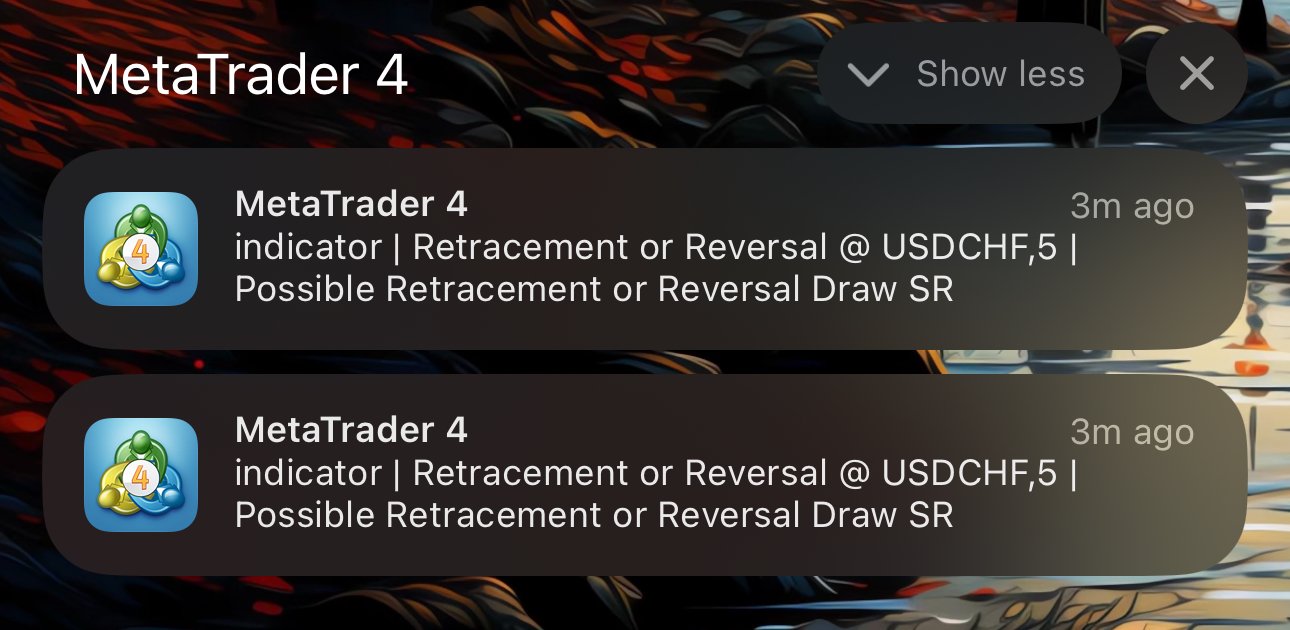
  1. Push Notifications to your Mt4 & MT5 Mobile App
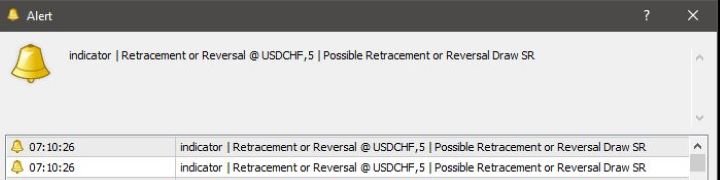
  2. Audio and Box notification on your Mt4 Terminal
  3. Use Can customize type of arrow (is recommended to not change the arrow but is an option for the user).
  4. user can customize push notification message.
  5. User can customize how many candles to scan.
  6. This indicator will provide an instant alert

Best Practices:

  1. Use this indicator with your current analysis.
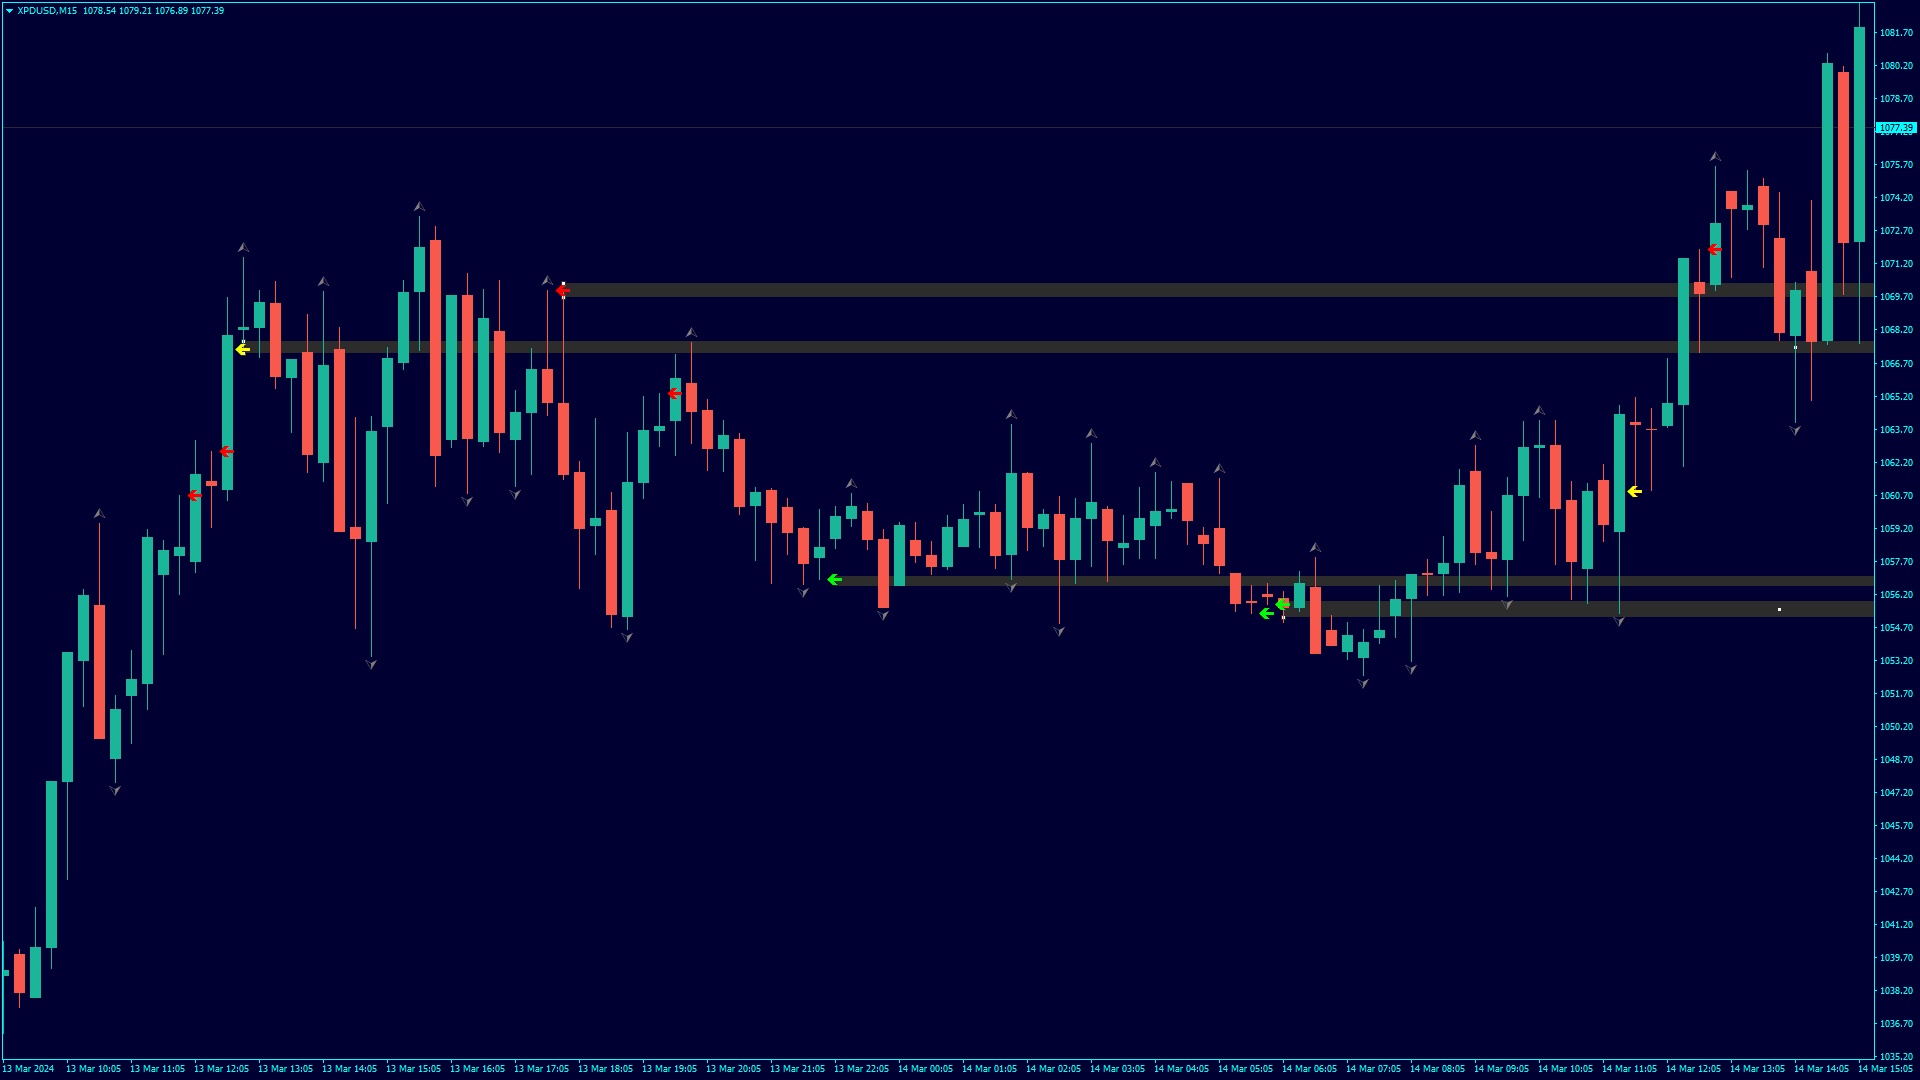
  2. When an arrow appears draw a Rectangular Box from the top of the arrow to the bottom of the arrow and drag it to the right. Usually the area will become Support and Resistance in the future and will hold for 1 or 3 trends


For Technical support after purchase contact me here via MQL5

PLEASE TAKE NOTICE: For best results use this indicator as an extra tools after you have completed your regular analysis and use it for alerts based on such analysis.


추천 제품
Wicks UpDown Target GJ Wicks UpDown Target GJ is specialized in GJ forex pairs. Choppy movement up and down on the opening range every day.  Trading breakouts on London session and New York session is recommended. Guideline Entry Strategy Idea: Step 1 - Breakout Forming (Warning! Trade on London Session and New York Session) Step 2 - Breakout Starting (Take Action on your trading plan) Step 3 - Partial Close your order & set breakeven (no-risk) Step 4 - Target complete Step 5 - Don't trade
FREE
WH Price Wave Pattern MT4
Wissam Hussein
4.4 (5)
Welcome to our   Price Wave Pattern   MT4 --(ABCD Pattern)-- The ABCD pattern is a powerful and widely used trading pattern in the world of technical analysis. It is a harmonic price pattern that traders use to identify potential buy and sell opportunities in the market. With the ABCD pattern, traders can anticipate potential price movements and make informed decisions on when to enter and exit trades. EA Version : Price Wave EA MT4 MT5 version : Price Wave Pattern MT5 Features :  Automatic
FREE
Free automatic fibonacci
Tonny Obare
4.67 (49)
Free automatic Fibonacci is an indicator that automatically plots a Fibonacci retracement based on the number of bars you select on the BarsToScan setting in the indicator. The Fibonacci is automatically updated in real time as new highest and lowest values appears amongst the selected bars. You can select which level values to be displayed in the indicator settings. You can also select the color of the levels thus enabling the trader to be able to attach the indicator several times with differe
FREE
Follow The Line
Oliver Gideon Amofa Appiah
3.94 (16)
FOLLOW THE LINE GET THE FULL VERSION HERE: https://www.mql5.com/en/market/product/36024 This indicator obeys the popular maxim that: "THE TREND IS YOUR FRIEND" It paints a GREEN line for BUY and also paints a RED line for SELL.  It gives alarms and alerts of all kinds. IT DOES NOT REPAINT and can be used for all currency pairs and timeframes. Yes, as easy and simple as that. Even a newbie can use it to make great and reliable trades. NB: For best results, get my other premium indicators for more
FREE
Wise Men Indicator demo
Bohdan Kasyanenko
3 (2)
The indicator displays signals according to the strategy of Bill Williams on the chart. Demo version of the indicator has the same features as the paid, except that it can work only on a demo account . Signal "First Wise Man" is formed when there is a divergent bar with angulation.  Bullish divergent bar - with lower minimum and closing price in the upper half. Bearish divergent bar - higher maximum and the closing price at the bottom half. Angulation is formed when all three lines of Alligator
FREE
PZ Three Drives
PZ TRADING SLU
5 (2)
This indicator finds Three Drives patterns. The Three Drives pattern is a 6-point reversal pattern characterised by a series of higher highs or lower lows that complete at a 127% or 161.8% Fibonacci extension. It signals that the market is exhausted and a reversal can happen. [ Installation Guide | Update Guide | Troubleshooting | FAQ | All Products ] Customizable pattern sizes Customizable colors and sizes Customizable breakout periods Customizable 1-2-3 and 0-A-B ratios It implements visual/s
FREE
Extremum Reverse Bar
Yurij Izyumov
2.8 (5)
This indicator has been created for finding the probable reversal points of the symbol price. A small candlestick reversal pattern is used it its operation in conjunction with a filter of extremums. The indicator is not redrawn! If the extremum filter is disabled, the indicator shows all points that have a pattern. If the extremum filter is enabled, the condition works – if the history Previous bars 1 candles back contains higher candles and they are farther than the Previous bars 2 candle, such
FREE
This indicator shows the latest untouched support and resistance as horizontal lines. The indicator can show support/resistance from higher timeframes. With this indicator you can e.g. easily see the support/resistance of the timeframes H4, D1 and W1 on a H1 chart, which can be a big advantage while time your entry on H1. This is the FREE version of the indicator: Support Resistance Multi Time Frame The free version works only on EURUSD and GBPUSD! Parameters referenceTF: the timeframe from whi
FREE
마진 모니터로 MT4 트레이딩을 혁신하세요: 즉각적인 마진 인사이트를 확인하세요! MT4의 부족한 마진 정보 때문에 어려움을 겪으셨나요? 이제 지루한 수동 계산과 추측은 그만! 정확하고 간편한 리스크 관리를 원하는 트레이더를 위해 특별히 설계된 최고의 MT4 지표, 마진 모니터를 소개합니다. 차트에서 포지션별 마진을 명확하게 확인하여 더욱 스마트하고 빠른 결정을 손쉽게 내릴 수 있습니다. 마진 모니터가 혁신적인 이유: 간편한 마진 추적: 복잡한 공식이나 스프레드시트 없이도 각 포지션의 마진 사용량을 즉시 확인할 수 있습니다. 이제 거래에만 집중하세요! 종합적인 대시보드: 기본적으로 유형, 심볼, 로트 수, 포지션별 마진, 수익 등의 필수 열을 표시합니다. 티켓, 손절매(SL), 익절매(TP), 개시 가격 등을 추가하여 맞춤형 대시보드를 구성할 수도 있습니다. 주요 계정 지표: 총 사용 마진, 사용 가능 마진, 마진 레벨 비율을 항상 확인할 수 있으며, 하단에는 전체 손익 요약이
FREE
The Magic SMA indicator is of great help in determining trend direction. It can be an excellent addition to your existing strategy or the basis of a new one. We humans can make better decisions when we see better visually. So we designed it to show a different color for rising and falling trends. Everyone can customize this in the way that suits them best. By setting the Trend Period, we can optimize it for longer or shorter trends for our strategy. It is great for all time frames. IF YOU NEED
FREE
Forecast System Gift
Peter Maggen
5 (1)
--- FREE VERSION - WORKS ONY ON EURUSD ------------------------------------------------------------------- This is a unique breakout strategy that is used for determination of the next short term trend/move. The full system is available on MQL5 under the name "Forecast System". Here is the link -->  https://www.mql5.com/en/market/product/104166?source=Site Backtest is not possible, because calculations are done based on the data of all timeframes/periods. Therefore I propose you use the technolo
FREE
Fibomathe for MT4
Almaquio Ferreira De Souza Junior
Fibomathe Indicator: Support and Resistance Tool for MT4 The Fibomathe Indicator is a technical analysis tool designed for MetaTrader 4 (MT4) that assists traders in identifying support and resistance levels, take-profit zones, and additional price projection areas. It is suitable for traders who use structured approaches to analyze price action and manage trades. Key Features Support and Resistance Levels: Allows users to define and adjust support and resistance levels directly on the chart. L
FREE
.....................................hi....................... ................for showing high s and low s and support and resistanses .....................we have a lot of ways............................... it can be helpful for finding trends , higher highs , higher lows , lower highs , lower lows .......................today i write on of thems.......................... ........................you can enter the number of last support and resistanses .........................and it will dra
FREE
Smart FVG indicator MT4
Ahmad Kazbar
4.67 (3)
Smart FVG 인디케이터 MT4 – MetaTrader 4를 위한 고급 Fair Value Gap 탐지 Smart FVG 인디케이터 MT4는 MetaTrader 4 차트에서 Fair Value Gap(FVG)을 전문적으로 탐지하고, 모니터링하며, 알림까지 제공하는 도구입니다. ATR 기반 필터링과 시장 구조를 인식하는 로직을 결합하여 노이즈를 줄이고, 유동성 환경에 맞게 자동으로 적응하며, 매매 의사결정에 중요한 불균형 구간만 남겨 줍니다. 주요 장점 정확한 FVG 탐지: 단순한 캔들 갭이 아닌 실제 시장 비효율 구간을 식별합니다. ATR 기반 정밀도: 다양한 상품과 시간 프레임에서 저품질 신호를 걸러내는 적응형 민감도. 실시간 유효성 추적: 가격이 해당 구간을 메우거나 돌파하면 존이 자동으로 연장·조정·삭제됩니다. 사용자 정의 가능한 시각화: 색상, 선 스타일, 채우기 옵션을 템플릿에 맞게 자유롭게 설정 가능. 실질적인 알림: 새로 생성된 FVG, 메워진 FVG, 무효화된
FREE
This indicator is one of the useful tools for traders who trade on currency pairs and based on the strength of each currency they can make a correct decision or confirmation in the positions.  It has been calculated for all the minor currency pairs supported by the broker and displays the values of the major currencies. These currencies are displayed horizontally or vertically according to the trader's config when executing the indicator. One of the trading strategies that can be used is to cho
FREE
PZ Pivot Points
PZ TRADING SLU
4.6 (10)
This indicator displays pivot points in the chart, including historical vales, and supports many calculation modes for Pivot Points and S/R levels. [ Installation Guide | Update Guide | Troubleshooting | FAQ | All Products ] It plots historical levels for backtesting purposes It allows you to select the reference timeframe It implements different Pivot Point calculation modes It implements different SR calculation modes It implements customizable colors and sizes Calculation Modes The indicator
FREE
Panelux
Andrei Gerasimenko
Panelux - информационная панель показывающая актуальную информацию для трейдера, такую как: Номер торгового аккаунта и торговое плечо; Символ, период, последнюю цену, время до закрытия бара и спред; Отдельный блок для мани менеджмента; Данные свопа инструмента; Блок информации о депозите, балансе, профите, позициях, equity и margin; Блок о прибылях и убытках за год, квартал, месяц, неделю и по последним пяти дням. Имеется опция для включения отображения совершенных сделок на графике цены. Что уд
FREE
Rainbow MT4
Jamal El Alama
Rainbow MT4 is a technical indicator based on Moving average with period 34 and very easy to use. When price crosses above MA and MA changes color to green, it’s a signal to buy. When price crosses below MA and MA changes color to red, it’s a signal to sell. The Expert advisor ( Rainbow EA MT4) based on Rainbow MT4 indicator, as you can see in the short video below is now available here .
FREE
Sm Ichimoku Scanner
Steeve Christian Martol
5 (5)
Multi Time Frame Indicator acts as a Scanner based on the Ichimoku Trading System. The outcome is displayed on a board. This helps you to make "at a glance" a mental picture of the System without having to open the chart. Up to 10 Currencies can be watched. Scanned elements And Legend "KUMO Futur" - Green : The Kumo Futur is Bullish. "KUMO Futur" - Red : The Kumo Futur is Bearish. "PRICE Cross KJ" - Green : The Price is Above the Kijun Sen.  "PRICE Cross KJ" - Red : The Price is Below the Kijun
FREE
Индикатор "Buy Sell zones x2" основан на принципе "остановка/разворот после сильного движения". Поэтому, как только обнаруживается сильное безоткатное движение, сразу после остановки - рисуется зона покупок/продаж. Зоны отрабатывают красиво. Или цена ретестит зону и улетает в космос, или пробивает зону насквозь и зона отрабатывается с другой стороны так же красиво.  Работает на всех таймфреймах. Лучше всего выглядит и отрабатывает на Н1.    Может использоваться как: индикатор зон, где лучше вс
FREE
Forex Market Profile and Vwap
Lorentzos Roussos
4.86 (7)
외환 시장 프로필(줄여서 FMP) 이것이 아닌 것 : FMP는 일반적인 문자 코드 TPO 표시가 아니며 전체 차트 데이터 프로필 계산을 표시하지 않으며 차트를 기간으로 분할하여 계산하지도 않습니다. 그것이 하는 일: 가장 중요한 것은 FMP 표시기가 사용자 정의 스펙트럼의 왼쪽 가장자리와 사용자 정의 스펙트럼의 오른쪽 가장자리 사이에 있는 데이터를 처리한다는 것입니다. 사용자는 마우스로 표시기의 양쪽 끝을 당기기만 하면 스펙트럼을 정의할 수 있습니다. 표시기 오른쪽 가장자리가 라이브 막대로 당겨지고 더 멀리(미래로) 표시되면 표시기가 "라이브"로 간주됩니다(새 막대로 업데이트됨). 표시기는 첨부된 차트에 "앵커" 개체를 놓은 다음 해당 앵커를 하드 드라이브의 파일과 연결합니다. 이렇게 하면 차트 또는 지표가 닫힐 때까지 다시 시작해도 설정이 유지되어 차트에서 계속 FMP를 실행할 수 있습니다. FMP 지표는 하나의 차트에서 여러 인스턴스를 실행할 수 있으며 이름을 지정할 수
FREE
Squeeze Box
Sinan Durkan
**Squeeze Box Indicator**   Squeeze Box  is a powerful technical analysis indicator developed for the MetaTrader 4 platform, designed to support day trading strategies. This indicator analyzes market movements to detect bullish and bearish breakout signals, enabling traders to capture trends early. With its customizable features and user-friendly interface, it is ideal for both novice and experienced traders. ### Features and Functions - **Bullish and Bearish Signals**: Identifies market break
FREE
YK Find Support And Resistance
Peechanat Chatsermsak
5 (1)
The " YK Find Support And Resistance " indicator is a technical analysis tool used to identify key support and resistance levels on a price chart. Its features and functions are as follows: 1. Displays support and resistance levels using arrow lines and colored bands, with resistance in red and support in green. 2. Can be adjusted to calculate and display results from a specified timeframe using the forced_tf variable. If set to 0, it will use the current timeframe of the chart. 3. Uses the
FREE
Market Profile 3
Hussien Abdeltwab Hussien Ryad
3 (2)
Market Profile 3 MetaTrader 4 indicator  — is a classic Market Profile implementation that can show the price density over time, outlining the most important price levels, value area, and control value of a given trading session. This indicator can be attached to timeframes between M1 and D1 and will show the Market Profile for daily, weekly, monthly, or even intraday sessions. Lower timeframes offer higher precision. Higher timeframes are recommended for better visibility. It is also possible t
FREE
PZ Penta O MT4
PZ TRADING SLU
2.33 (3)
The Penta-O is a 6-point retracement harmonacci pattern which usually precedes big market movements. Penta-O patterns can expand and repaint quite a bit. To make things easier this indicator implements a twist: it waits for a donchian breakout in the right direction before signaling the trade. The end result is an otherwise repainting indicator with a very reliable trading signal. The donchian breakout period is entered as an input. [ Installation Guide | Update Guide | Troubleshooting | FAQ | A
FREE
Please Good Review on this indicator, and i will maybe produce more indicators,  Coming soon, EA base on this indicators Linear Weighted Moving Average with HLCC applied price, and Bollinger bands with LWMA as applied price. Interesing Buy and Sell arrow based on this indicator , non Lag indicator as arrow will appear 1 candle after crossed...............
FREE
SuperTrend V
Muhammad Hassaan
*This is TradingView indicator converted to mql4* The SuperTrend V indicator is a popular technical analysis tool used to identify trends and potential trend reversals in financial markets. It is based on the concept of the SuperTrend indicator but incorporates additional features and variations. The SuperTrend V indicator uses a combination of price action and volatility to determine the trend direction and generate trading signals. Here are the key components and features of the indicator: Ca
Aroon Classic
Etsushi Ishizuka
Aroon Classic 지표 개요 Aroon Classic 지표는 차트에서 추세의 발생과 지속성을 정량적으로 파악할 수 있는 기술적 도구입니다. “Aroon Up”과 “Aroon Down” 두 개의 라인을 사용해 추세 강도와 전환 시점을 0~100 범위로 표시합니다. Aroon Up 값이 높을수록 강한 상승 추세를, Aroon Down 값이 높을수록 강한 하락 추세를 의미합니다. 주요 특징 추세의 시작과 전환을 시각적으로 구분 계산 기간(기본값: 14)을 사용자 지정 가능 라인 색상, 두께, 스타일을 유연하게 설정 지표 매개변수 매개변수 설명 기본값 Period Aroon 계산에 사용되는 바 수 14 Aroon Up Color Aroon Up 라인 색상 DodgerBlue Aroon Down Color Aroon Down 라인 색상 Tomato Line Width 라인 두께(픽셀) 2 계산 방법 Aroon Up은 지정 기간 내 최고점 이후 경과한 바 수를 다음 공식으로 계산합니다:
FREE
Double HMA lines MTF
Pavel Zamoshnikov
5 (1)
This is a multi-timeframe version of the popular Hull Moving Average (HMA). The Double HMA MTF Light indicator combines two timeframes on a single chart. The HMA of the higher timeframe defines the trend, and the HMA of the current timeframe defines short-term price movements. The indicator is freely distributed and hasn't audio signals or messages. Its main function is the visualization of price movements. If you need advanced functionality of the HMA multi-timeframe indicator (information ab
FREE
Email Drawdown Alert
Roman Starostin
5 (12)
Free informative Indicator-helper. It'll be usefull for traders who trade many symbols or using grid systems (Averaging or Martingale). Indicator counts drawdown as percent and currency separate. It has a number of settings: Count deposite drawdown according equity value and send e-mail or notifications to user if DD more than set; Sending e-mail when max open orders reached; Shows price and remaining pips amount before MarginCall on current chart and Account generally; Display summary trade lot
FREE
이 제품의 구매자들이 또한 구매함
Precautions for subscribing to indicator This indicator only supports the computer version of MT4 Does not support MT5, mobile phones, tablets The indicator only shows the day's entry arrow The previous history arrow will not be displayed (Live broadcast is for demonstration) The indicator is a trading aid Is not a EA automatic trading No copy trading function The indicator only indicates the entry position No exit (target profit)  The entry stop loss point is set at 30-50 PIPS Or the front hi
Gann Made Easy
Oleg Rodin
4.83 (155)
Gann Made Easy 는 mr.의 이론을 사용하여 최고의 거래 원칙을 기반으로 하는 전문적이고 사용하기 쉬운 Forex 거래 시스템입니다. W.D. 간. 이 표시기는 Stop Loss 및 Take Profit Levels를 포함하여 정확한 BUY 및 SELL 신호를 제공합니다. PUSH 알림을 사용하여 이동 중에도 거래할 수 있습니다. 거래 팁, 보너스, GANN MADE EA를 무료로 받으시려면 구매 후 저에게 연락주세요! 아마도 Gann 거래 방법에 대해 이미 여러 번 들었을 것입니다. 일반적으로 Gann의 이론은 초보자 거래자뿐만 아니라 이미 거래 경험이 있는 사람들에게도 매우 복잡한 것입니다. Gann의 거래 방식은 이론적으로 적용하기 쉽지 않기 때문입니다. 나는 그 지식을 연마하고 Forex 지표에 최고의 원칙을 적용하기 위해 몇 년을 보냈습니다. 표시기는 적용하기가 매우 쉽습니다. 차트에 첨부하고 간단한 거래 권장 사항을 따르기만 하면 됩니다. 지표는 지속적으로 시장
M1 Sniper
Oleg Rodin
5 (18)
M1 SNIPER 는 사용하기 쉬운 거래 지표 시스템입니다. M1 시간대에 맞춰 설계된 화살표 지표입니다. 이 지표는 M1 시간대 스캘핑을 위한 단독 시스템으로 사용할 수 있으며, 기존 거래 시스템의 일부로도 사용할 수 있습니다. 이 거래 시스템은 M1 시간대 거래용으로 특별히 설계되었지만, 다른 시간대에도 사용할 수 있습니다. 원래는 XAUUSD와 BTCUSD 거래를 위해 이 방법을 설계했지만, 다른 시장 거래에도 유용하다는 것을 알게 되었습니다. 이 지표의 신호는 추세 방향과 반대로 거래될 수 있습니다. 저는 지표의 신호를 활용하여 양방향으로 거래할 수 있도록 돕는 특별한 거래 기법을 알려드립니다. 이 방법은 특별한 동적 지지선과 저항선 가격 영역을 활용하는 것을 기반으로 합니다. 구매하시면 M1 SNIPER 화살표 지표를 바로 다운로드하실 수 있습니다. 또한, 아래 스크린샷에 표시된 Apollo Dynamic SR 지표는 M1 SNIPER 도구를 사용하는 모든 사용자에게 무료로
Game Changer Indicator
Vasiliy Strukov
4.75 (16)
Game Changer는 모든 금융 상품에 적용 가능한 혁신적인 추세 지표로, MetaTrader를 강력한 추세 분석 도구로 탈바꿈시켜 줍니다. 모든 시간대에서 작동하며 추세 식별, 잠재적 반전 신호 제공, 트레일링 스톱 기능, 그리고 신속한 시장 대응을 위한 실시간 알림 기능을 제공합니다. 숙련된 전문가든 이제 막 시작하는 초보자든, Game Changer는 추세의 역학을 명확하게 이해하고 자신감 있고 규율 있는 거래를 할 수 있도록 도와줍니다. 이 지표는 차트 재구성 기능을 지원합니다. 구매 후 즉시 연락 주시면 특별 보너스를 드립니다. Strong Support 및 Trend Scanner 지표를 무료로 제공해 드립니다. [email protected]으로 메시지를 보내주세요. 참고로, 저는 텔레그램에서 EA나 특별 세트를 판매하지 않습니다. 모든 EA는 MQL5에서만 사용 가능하며, 세트 파일은 제 블로그(여기)에서만 다운로드하실 수 있습니다. 사기꾼을 조심하시고 다른 사
Meravith
Ivan Stefanov
5 (2)
마켓 메이커를 위한 도구. Meravith는 다음과 같은 기능을 제공합니다: 모든 타임프레임을 분석하고 현재 유효한 추세를 표시합니다. 강세와 약세 거래량이 동일한 유동성 구간(거래량 균형 구간)을 강조 표시합니다. 서로 다른 타임프레임의 모든 유동성 레벨을 차트에 직접 표시합니다. 텍스트 기반 시장 분석을 생성하여 참고용으로 제공합니다. 현재 추세를 기반으로 목표가, 지지선 및 손절가를 계산합니다. 거래의 위험 대비 보상 비율(Risk/Reward)을 계산합니다. 계좌 잔고에 따라 포지션 크기를 산출하고 잠재 수익을 추정합니다. 시장에 중대한 변화가 발생할 경우 경고도 제공합니다. 지표의 주요 라인: 강세/약세 거래량 소진 라인 — 목표가로 사용됩니다. 시장 추세를 나타내는 라인. 시장이 강세인지 약세인지에 따라 색상이 변경되며 추세 지지선 역할을 합니다. 색상은 주로 시장 심리를 보여줍니다. 거래량 균형선(Eq). Eq(Volume Equilibrium) 라인은 시스템의 핵심입니
Miraculous Indicator – Gann Square of Nine 기반 100% 비리페인트 Forex 및 바이너리 도구 이 영상은 Miraculous Indicator 를 소개합니다. 이 지표는 Forex 및 바이너리 옵션 트레이더를 위해 특별히 개발된 매우 정확하고 강력한 트레이딩 도구입니다. 이 지표가 독특한 이유는 전설적인 **Gann Square of Nine(Gann 9의 사각형)**과 **Gann's Law of Vibration(Gann 진동의 법칙)**에 기반을 두고 있기 때문입니다. 이는 현대 트레이딩에서 가장 정밀한 예측 도구 중 하나로 손꼽힙니다. Miraculous Indicator는 완전히 비리페인트(non-repaint) 됩니다. 즉, 캔들이 마감된 후에도 신호가 변경되거나 사라지지 않습니다. 보이는 것이 곧 결과입니다. 이는 트레이더가 자신감을 가지고 거래에 진입하고 청산할 수 있는 신뢰할 수 있고 일관된 기반을 제공합니다. 주요 특징: Gann
현재 40% 할인 ! 초보자 또는 전문가 트레이더를 위한 최고의 솔루션! 이 대시보드 소프트웨어는 28개의 통화 쌍에서 작동합니다. 2가지 주요 지표(Advanced Currency Strength 28 및 Advanced Currency Impulse)를 기반으로 합니다. 전체 Forex 시장에 대한 훌륭한 개요를 제공합니다. 고급 통화 강도 값, 통화 이동 속도 및 모든(9) 시간대의 28 Forex 쌍에 대한 신호를 보여줍니다. 추세 및/또는 스캘핑 기회를 정확히 파악하기 위해 차트의 단일 지표를 사용하여 전체 시장을 볼 수 있을 때 거래가 어떻게 개선될지 상상해 보십시오! 잠재적인 거래를 식별하고 확인하면서 강력한 통화와 약한 통화를 더욱 쉽게 식별할 수 있도록 이 지표에 기능을 내장했습니다. 이 표시기는 통화의 강세 또는 약세가 증가 또는 감소하는지 여부와 모든 시간대에서 수행되는 방식을 그래픽으로 보여줍니다. 추가된 새로운 기능은 현재 시장 조건 변화에 적응하는
Buy Sell Arrow Swing MT4
Sahib Ul Ahsan
5 (1)
Looking for a powerful yet lightweight swing detector that accurately identifies market structure turning points? Want clear, reliable buy and sell signals that work across any timeframe and any instrument? Buy Sell Arrow MT Swing is built exactly for that — precision swing detection made simple and effective. This indicator identifies Higher Highs (HH) , Higher Lows (HL) , Lower Highs (LH) , and Lower Lows (LL) with remarkable clarity. It is designed to help traders easily visualize market str
GoldRush Trend Arrow Signal
Kirk Lee Holloway
5 (2)
GoldRush 트렌드 화살표 신호 GoldRush 트렌드 화살표 신호 지표는 XAU/USD 시장에서 고속 단기 스캘핑 트레이더를 위해 설계된 정밀한 실시간 트렌드 분석을 제공합니다. 1분 시간대에 특화되어 설계된 이 도구는 명확한 진입점을 표시하는 방향성 화살표를 제공하여 스캘퍼들이 변동성이 높은 시장 환경에서도 자신 있게 거래할 수 있도록 합니다. 이 지표는 PRIMARY 및 SECONDARY 경고 화살표로 구성됩니다. PRIMARY 신호는 추세 방향의 변화를 나타내는 흰색과 검은색 방향성 화살표이며, SECONDARY 신호는 PRIMARY 화살표가 지시하는 방향을 확인하고 잠재적인 거래 진입점을 표시하는 파란색과 빨간색 화살표입니다. 참고: 추세 방향이 변경된 후 PRIMARY 경고 화살표가 단 하나만 표시될 경우, 다수의 SECONDARY 파란색/빨간색 화살표가 표시될 수 있음을 유의해야 합니다. SECONDARY 신호는 신호 기준을 충족하는 어떤 캔들 이후에도 표시
Trend indicator AI
Ramil Minniakhmetov
4.66 (80)
트렌드 인공 지능 지표는 실행 가능한 진입 점 및 반전 경고와 추세 식별을 결합하여 상인의 시장 분석을 향상시킬 훌륭한 도구입니다. 이 표시기는 사용자가 자신감과 정밀도로 외환 시장의 복잡성을 탐색 할 수 있도록 지원합니다 기본 신호 외에도 트렌드 인공 지능 지표는 풀백 또는 되돌림 중에 발생하는 2 차 진입 점을 식별하여 거래자가 기존 트렌드 내에서 가격 수정을 활용할 수 있도록합니다. 중요한 장점: ·작동 4 및 5 *명확한 구매 또는 판매 신호 *다시 칠하지 않습니다 *모든 자산에서 작동 나는 전보 사기에 개 또는 세트를 판매하지 않도록주의. 모든 설정은 블로그에 여기에 무료.  중요! 지침 및 보너스를 얻기 위해 구입 후 즉시 저에게 연락! 진짜 가동 감시는 뿐 아니라 나의 다른 제품 여기에서 찾아낼 수 있습니다: https://www.mql5.com/en/users/mechanic/seller&nbsp ; 설정 및 입력: 모든 자산에 대해 기본 설정을 권
FX Power MT4 NG
Daniel Stein
4.95 (21)
FX Power: 통화 강세 분석으로 더 스마트한 거래 결정을 개요 FX Power 는 어떤 시장 상황에서도 주요 통화와 금의 실제 강세를 이해하기 위한 필수 도구입니다. 강한 통화를 매수하고 약한 통화를 매도함으로써 FX Power 는 거래 결정을 단순화하고 높은 확률의 기회를 발견합니다. 트렌드를 따르거나 극단적인 델타 값을 사용해 반전을 예측하고자 한다면, 이 도구는 귀하의 거래 스타일에 완벽히 적응합니다. 단순히 거래하지 말고, FX Power 로 더 스마트하게 거래하세요. 1. FX Power가 거래자에게 매우 유용한 이유 통화와 금의 실시간 강세 분석 • FX Power 는 주요 통화와 금의 상대적 강세를 계산하고 표시하여 시장 역학에 대한 명확한 통찰력을 제공합니다. • 어떤 자산이 앞서고 있고 어떤 자산이 뒤처지는지 모니터링하여 보다 현명한 거래 결정을 내릴 수 있습니다. 포괄적인 멀티 타임프레임 뷰 • 단기, 중기 및 장기 타임프레임에서 통화와 금의 강세를
Scalper Inside PRO
Alexey Minkov
4.74 (69)
An exclusive indicator that utilizes an innovative algorithm to swiftly and accurately determine the market trend. The indicator automatically calculates opening, closing, and profit levels, providing detailed trading statistics. With these features, you can choose the most appropriate trading instrument for the current market conditions. Additionally, you can easily integrate your own arrow indicators into Scalper Inside Pro to quickly evaluate their statistics and profitability. Scalper Inside
Currency Strength Wizard
Oleg Rodin
4.84 (55)
통화 강도 마법사는 성공적인 거래를 위한 올인원 솔루션을 제공하는 매우 강력한 지표입니다. 표시기는 여러 시간 프레임의 모든 통화 데이터를 사용하여 이 또는 해당 외환 쌍의 힘을 계산합니다. 이 데이터는 특정 통화의 힘을 확인하는 데 사용할 수 있는 사용하기 쉬운 통화 지수 및 통화 전력선의 형태로 표시됩니다. 필요한 것은 거래하려는 차트에 표시기를 부착하는 것뿐입니다. 표시기는 거래하는 통화의 실제 강세를 보여줍니다. 지표는 또한 추세와 거래할 때 유리하게 사용할 수 있는 구매 및 판매 거래량 압력의 극한값을 보여줍니다. 지표는 또한 피보나치에 기반한 가능한 대상을 보여줍니다. 표시기는 PUSH 알림을 포함한 모든 유형의 알림을 제공합니다. 구매 후 연락주세요. 나는 당신과 거래 팁을 공유하고 당신에게 무료로 훌륭한 보너스 지표를 줄 것입니다! 나는 당신에게 행복하고 유익한 거래를 기원합니다!
"Dragon's Tail" is an integrated trading system, not just an indicator. This system analyzes each candle on a minute-by-minute basis, which is particularly effective in high market volatility conditions. The "Dragon's Tail" system identifies key market moments referred to as "bull and bear battles". Based on these "battles", the system gives trade direction recommendations. In the case of an arrow appearing on the chart, this signals the possibility of opening two trades in the indicated directi
Gold Signal Pro
Mohamed Hassan
First 25 copies at $80, after that price becomes $149 (3 copies left) Gold Signal Pro is a powerful MT4 indicator designed to help traders spot strong price reactions in the market. It focuses on clear wick rejections , showing when price strongly rejects a level and often continues in the same direction. Gold Signal Pro is mainly built for scalping gold (XAUUSD) and works best on lower timeframes like M5 and M15 , where timing matters most. That said, it can also be used on any forex pair, a
Scalper Vault
Oleg Rodin
5 (35)
Scalper Vault 는 성공적인 스캘핑에 필요한 모든 것을 제공하는 전문 스캘핑 시스템입니다. 이 표시기는 외환 및 바이너리 옵션 거래자가 사용할 수 있는 완전한 거래 시스템입니다. 권장 시간 프레임은 M5입니다. 시스템은 추세 방향으로 정확한 화살표 신호를 제공합니다. 또한 상단 및 하단 신호와 Gann 시장 수준을 제공합니다.  이 시스템은 사용하기가 매우 쉽습니다. 원하는 시장 지역의 화살표만 따라가면 됩니다. 엑시트는 가격이 적정 수준에 도달하거나 시장의 고점 또는 저점 신호가 나타날 때 수행됩니다.  표시기는 PUSH 알림을 포함한 모든 유형의 경고를 제공합니다. 인디케이터 구매 후 연락주세요. 내 개인 거래 권장 사항과 훌륭한 보너스 지표를 무료로 공유합니다! 나는 당신에게 행복하고 유익한 거래를 기원합니다!
Gold Scalper Super
Aleksandr Makarov
5 (2)
Gold Scalper Super is an easy-to-use trading system. The indicator can be used as a standalone scalping system on the M1 time frame, as well as part of your existing trading system. Bonus: when purchasing an indicator, Trend Arrow Super is provided free of charge, write to us after purchase. The indicator 100% does not repaint!!! If a signal appears, it does not disappear! Unlike indicators with redrawing, which lead to the loss of a deposit, because they can show a signal and then remove it.
IQ Gold Gann Levels
INTRAQUOTES
5 (4)
Presenting one-of-a-kind Gann Indicator for XAUUSD IQ Gold Gann Levels is a non-repainting, precision tool designed exclusively for XAUUSD/Gold intraday trading. It uses W.D. Gann’s square root method to plot real-time support and resistance levels, helping traders spot high-probability entries with confidence and clarity. William Delbert Gann (W.D. Gann) was an exceptional market analyst whose trading technique was based on a complex blend of mathematics, geometry, astrology, and ancient calcul
Apollo SR Master
Oleg Rodin
5 (1)
Apollo SR Master는 지지/저항 구간에서의 거래를 더욱 쉽고 안정적으로 만들어 주는 특수 기능을 갖춘 지지/저항 지표입니다. 이 지표는 지역 가격의 고점과 저점을 감지하여 시간 지연 없이 실시간으로 지지/저항 구간을 계산합니다. 새롭게 형성된 저항 구간을 확인하기 위해 지표는 해당 저항 구간을 실제 매도 또는 매수 신호로 활용할 수 있음을 나타내는 특수 신호를 표시합니다. 이 경우, 저항 구간의 강도가 높아지고, 따라서 저항 구간에서의 성공적인 거래 가능성도 높아집니다. 이것이 바로 이 지표의 핵심 아이디어입니다. SR 존은 손절매와 이익실현을 더욱 쉽게 할 수 있도록 해줍니다. 신호 방향에 따라 SR 존 위 또는 아래 공간을 손절매로 활용할 수 있습니다. 또한, 반대쪽 SR 존은 잠재적 이익실현 영역으로 활용할 수 있습니다. 또한 Apollo SR Master 지표를 사용하는 모든 사용자에게 "Apollo Price Action System" 지표를 무료로 제공합니다.
Super Signal – Skyblade Edition 전문가용 노리페인트 / 노래그 트렌드 신호 시스템, 뛰어난 승률 제공 | MT4 / MT5용 1분, 5분, 15분과 같은 낮은 타임프레임에서 가장 좋은 성능을 보입니다. 핵심 기능: Super Signal – Skyblade Edition은 추세 매매를 위해 설계된 스마트 신호 시스템입니다. 이 시스템은 다중 필터 로직을 활용하여, 명확한 방향성과 실질적인 모멘텀이 수반된 고품질 추세만을 감지합니다. 이 시스템은 고점 또는 저점을 예측하지 않으며 , 다음 세 가지 조건이 모두 충족될 때만 신호를 발생시킵니다: 명확한 추세 방향 강화되는 모멘텀 건전한 변동성 구조 또한, 시장 세션 기반의 유동성 분석을 통해 신호의 신뢰성과 타이밍을 더욱 향상시킵니다. 신호 특성: 모든 화살표 신호는 100% 리페인트 없음 / 지연 없음 신호가 한 번 발생하면 고정되며, 깜빡이거나 사라지지 않음 차트 상의 시각적 화살표, 정보 패널, 팝업 알
Pulse Scalping Line - an indicator for identifying potential pivot points. Based on this indicator, you can build an effective Martingale system. According to our statistics, the indicator gives a maximum of 4 erroneous pivot points in a series. On average, these are 2 pivot points. That is, the indicator shows a reversal, it is erroneous. This means that the second signal of the indicator will be highly accurate. Based on this information, you can build a trading system based on the Martingale
MetaForecast M4
Vahidreza Heidar Gholami
5 (2)
MetaForecast는 가격 데이터의 조화를 기반으로 모든 시장의 미래를 예측하고 시각화합니다. 시장이 항상 예측 가능한 것은 아니지만 가격에 패턴이 있다면 MetaForecast는 가능한 정확하게 미래를 예측할 수 있습니다. 다른 유사한 제품과 비교했을 때, MetaForecast는 시장 동향을 분석하여 더 정확한 결과를 생성할 수 있습니다. 입력 매개변수 Past size (과거 크기) MetaForecast가 미래 예측을 생성하기 위한 모델을 만드는 데 사용하는 막대의 수를 지정합니다. 모델은 선택한 막대 위에 그려진 노란색 선으로 표시됩니다. Future size (미래 크기) 예측해야 할 미래 막대의 수를 지정합니다. 예측된 미래는 핑크색 선으로 표시되며 그 위에 파란색 회귀선이 그려집니다. Degree (차수) 이 입력은 MetaForecast가 시장에서 수행할 분석 수준을 결정합니다. Degree 설명  0 차수 0의 경우, "Past size" 입력에 모든 봉우리와
Volatility Trend System - a trading system that gives signals for entries. The volatility system gives linear and point signals in the direction of the trend, as well as signals to exit it, without redrawing and delays. The trend indicator monitors the direction of the medium-term trend, shows the direction and its change. The signal indicator is based on changes in volatility and shows market entries. The indicator is equipped with several types of alerts. Can be applied to various trading ins
FX Volume
Daniel Stein
4.63 (38)
FX Volume: 브로커 시각에서 바라보는 진짜 시장 심리 간단 요약 트레이딩 접근 방식을 한층 더 향상시키고 싶으신가요? FX Volume 는 소매 트레이더와 브로커의 포지션을 실시간으로 파악할 수 있게 해 줍니다. 이는 COT 같은 지연된 보고서보다 훨씬 빠릅니다. 꾸준한 수익을 추구하는 분이든, 시장에서 더 깊은 우위를 원하시는 분이든, FX Volume 을 통해 대규모 불균형을 찾아내고, 돌파 여부를 확인하며 리스크 관리를 정교화할 수 있습니다. 지금 시작해 보세요! 실제 거래량 데이터가 의사결정을 어떻게 혁신할 수 있는지 직접 경험해 보시기 바랍니다. 1. 트레이더에게 FX Volume이 매우 유익한 이유 탁월한 정확도를 지닌 조기 경보 신호 • 다른 사람들보다 훨씬 앞서, 각 통화쌍을 매수·매도하는 트레이더 수를 거의 실시간으로 파악할 수 있습니다. • FX Volume 은 여러 리테일 브로커에서 추출한 실제 거래량 데이터를 종합해 명확하고 편리한 형태로 제공하는
Atomic Analyst
Issam Kassas
5 (3)
우선적으로 언급할 점은이 거래 지표가 다시 그리지 않고 지연되지 않으며 이를 통해 수동 및 로봇 거래 모두에 이상적이라는 점입니다. 사용자 매뉴얼: 설정, 입력 및 전략. Atomic Analyst는 가격의 강도와 모멘텀을 활용하여 시장에서 더 나은 이점을 찾는 PA Price Action Indicator입니다. 고급 필터를 장착하여 잡음과 거짓 신호를 제거하고 거래 잠재력을 높이는 데 도움이 됩니다. 복잡한 지표의 다중 레이어를 사용하여 Atomic Analyst는 차트를 스캔하고 복잡한 수학적 계산을 간단한 신호와 색상으로 변환하여 초보 트레이더가 이해하고 일관된 거래 결정을 내릴 수 있도록합니다. "Atomic Analyst"는 새로운 및 경험이 풍부한 트레이더를위한 종합적인 거래 솔루션입니다. 프리미엄 지표와 최고 수준의 기능을 하나의 거래 전략에 결합하여 모든 종류의 트레이더에 대한 다재다능한 선택지가되었습니다. 인트라데이 거래 및 스캘핑 전략 : 빠르고 정확한 일일
Introducing a powerful, precision-engineered indicator that seamlessly combines Pivot Points, Moving Averages, and Multi-Timeframe Analysis to deliver high-probability Buy and Sell signals in real-time. This tool is your strategic edge, designed to identify trend reversals, market momentum, and optimal trade entries, no matter your preferred trading style. Our algorithm goes beyond standard indicators—by analyzing multiple timeframes simultaneously, it spots true market turning points while fi
M1 Arrow
Oleg Rodin
4.81 (21)
시장의 두 가지 기본 원칙에 기반한 일중 전략. 알고리즘은 추가 필터를 사용하여 거래량 및 가격 파동 분석을 기반으로 합니다. 지표의 지능형 알고리즘은 두 가지 시장 요인이 하나로 결합될 때만 신호를 제공합니다. 지표는 더 높은 시간 프레임의 데이터를 사용하여 M1 차트에서 특정 범위의 파도를 계산합니다. 그리고 파동을 확인하기 위해 지표는 볼륨 분석을 사용합니다. 이 표시기는 준비된 거래 시스템입니다. 트레이더가 필요로 하는 모든 것은 신호를 따르는 것입니다. 또한 지표는 자신의 거래 시스템의 기초가 될 수 있습니다. 거래는 분 차트에서만 수행됩니다. 지표가 MTF 원리를 사용한다는 사실에도 불구하고 지표 알고리즘은 가능한 한 안정적입니다. 구매 후 반드시 저에게 편지를 보내주세요! 내 거래 설정 및 권장 사항을 공유하겠습니다!
Shogun Trade
Yuki Miyake
5 (2)
SHOGUN Trade - The Shocking Truth of 16 Years Unoptimized. Shogun Trading February Special Sale – Only $88 (Regular Price $199)! This special offer is available until February 28th . As we are dedicated to further product development and optimization , we are offering this discount in exchange for your valuable feedback. Your insights will directly influence our next round of updates and feature enhancements. Price: $88 (Special discount from $199) Requirement: Please leave a review and share
Smc Blast Signal
Mohit Dhariwal
5 (3)
Full Fledged EA and Alert plus for alerts will also be provided in this offer along with the purchase of Indicator. Limited copies only at this price and Ea too. Grab your copy soon Alert plus for indicator with set file is kept in comment section with the image  SMC Blast Signal with FVG, BOS and trend Breakout The SMC Blast Signal is a Precise trading system for Meta Trader 4 that uses Smart Money Concepts (SMC), including Fair Value Gaps (FVG) and Break of Structure (BOS), to identify high-pr
Weis Wave with Alert
Trade The Volume Waves Single Member P.C.
4.82 (22)
Rental/Lifetime Package Options and Privileges' Rent Monthly Six Months   Yearly/Lifetime Weis Wave with Speed with Alert+Speed Index x x x Manual  x x x Quick Set up Video x x x Blog x x x Lifetime Updates x x x Setup and Training Material x x Rectangle Break Alert Tool      x Discord Access Channel "The SI traders" x   How to trade info visit:    http://www.tradethevolumewaves.com   ** If you purchase please contact me to setup your  : training Room and  complete manual access.  This is
제작자의 제품 더 보기
MTF Fair Value Gaps Alerts
Jose Ramon Miranda Ramos
MTF Fair Value Gaps Alerts indicator is based on Fair Value Gaps (FVG), Volume imbalance (VI) and Gaps. This indicator will create 2 arrows pointing to the left showing the area of the FVG, VI and Gaps and will never repaint after the candle has been closed . Inputs: TF (Timeframe of the Alert For Current timeframe use CURRENT) barshilft : the barshift needs to be the same timeframe as the above TF. barshift format (CURRENT, M1, M5, M15, M30, H1, H4, D1, W1, MN) Send Email: Audible Alert Push N
FREE
TrendFinder SMA
Jose Ramon Miranda Ramos
4.78 (9)
Trendfinder SMA are Colored candlesticks showing the trend based on two Simple Moving Averages and the slope of the slow moving average. This indicator will give you the color change on the next bar on the confirmation candle and will never repaint   Trendfinder SMA is optimize to trade on any market and to be used trending and None trending markets. PLEASE TAKE NOTICE: For best results use this indicator as an extra tools after you have completed your regular analysis and use it for alerts base
FREE
CCI Trend finder
Jose Ramon Miranda Ramos
CCI Trend Finder indicator with different colors at levels 0, 100 and -100. The cross is a signal for "123 Exit" as presented by MPlay and used in Woodies CCI system. This exit signal is effective especially in short-term breakout trades, because it prevents early exiting at small corrections.  This indicator is great for having it as an extra tool for your analysis.
FREE
Strength Scalper Pro
Jose Ramon Miranda Ramos
3 (1)
PLEASE TAKE NOTICE: This indicator is in current development. final version will be free. This is a simple indicator that uses 3 timeframes in its formula to create Possible buy and sell signals. This indicator is optimized for the M1 timeframe Only. It has 2 types of Alerts: Push Notifications Audio Alerts UPDATES: 3/19/24: Still testing the final code Troubleshooting: When loading the indicator, if you don't see the arrows on the current chart that means that MT4 has not loaded all the high
FREE
Targets
Jose Ramon Miranda Ramos
5 (1)
Targets is an indicator to determine potential turning  points , targets  are calculated to determine levels in which the sentiment of the market could change from "bullish" to "bearish." This indicator can be used in any timeframe and any currency pair: IN CASE YOU DON'T SEE THE INDICATOR WHEN YOU ADD IT TO YOUR CHARTS JUST OPEN THE INDICATOR MENU AND CLOSE THE MENU AGAIN PLEASE TAKE NOTICE: For best results use this indicator as an extra tools after you have completed your regular analysis an
FREE
Trendfinder SMA With Zone and Alert are Colored candlesticks showing the trend based on two SMA as Signal and two SMA as a Buy and Sell Zone and the slope of the slow moving average. This indicator will give you the color change on the next bar on the confirmation candle and will provide alert on Buy and sell signal, when it enters the buy and sell zone and when the market test the buy or sell zones as support or resistance and will never repaint . This indicator has the following: 2 SMA for th
FREE
TrendFinder RSI
Jose Ramon Miranda Ramos
TrendFinder RSI are Colored candlesticks showing the trend based on The Relative Strength Index (RSI) This indicator will give you the color change on the next bar on the confirmation candle and will never repaint   TrendFinder RSI is optimize to trade on any market and to be used trending and None trending markets. For best results use this indicator as an extra tools after you have completed your regular analysis and use it for alerts based on such analysis.
FREE
Trendfinder MA Pro
Jose Ramon Miranda Ramos
Trendfinder MA Pro are based on Colored candlesticks showing the trend based on two Moving Averages as Signal and two Moving Averages as a Buy and Sell Zone, the slope of the slow Signal moving average and ATR and Volume increasing. This indicator will give you the color change on the next bar on the confirmation candle and will provide alert on Buy and sell signal, when it enters the buy and sell zone and when the market test the buy or sell zones as support or resistance and will never repain
FREE
TrendFinder Volume
Jose Ramon Miranda Ramos
TrendFinder VolumeI are Colored candlesticks showing the trend based on Volume and Slope of Trend This indicator will give you the color change on the next bar on the confirmation candle and will never repaint Lime Green = Possible Buy (Volume up),  Teal Green = Bullish Weak (Volume Decreasing), Red = Possible Sell (Volume up) , Orange = Bearish Weak (Volume Decreasing) TrendFinder Volume is optimize to trade on any market and to be used trending and None trending markets. For best results use
FREE
필터:
리뷰 없음
리뷰 답변