당사 팬 페이지에 가입하십시오
- 조회수:
- 30342
- 평가:
- 게시됨:
- 업데이트됨:
-
이 코드를 기반으로 한 로봇이나 지표가 필요하신가요? 프리랜스로 주문하세요 프리랜스로 이동
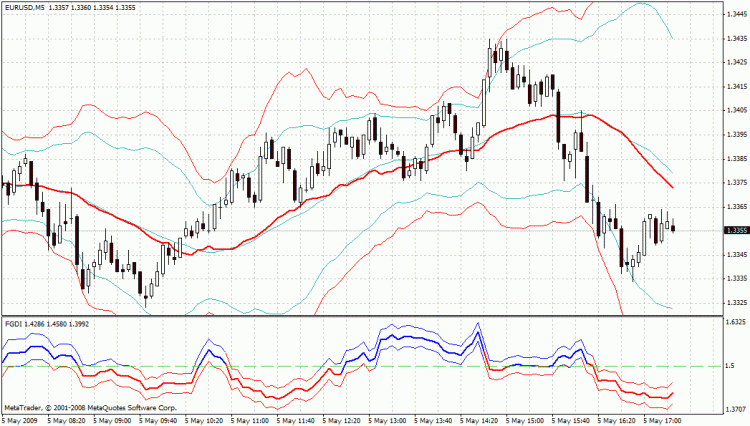
Following a modelisation of the price variation by Fractional Brownian Motion, this indicator increases the width the Bollinger Bands in order to avoid (or minimize) false signals (of entry or exit). For a more complete explanation, please see my blog: http://fractalfinance.blogspot.com/2009/05/from-bollinger-to-fractal-bands.html
Here is what this indicator looks like for a speed of the FRASMA (https://www.mql5.com/en/code/8866) set to 30. The red indicator is the Fractal Bands, and the blue is the Bollinger Bands (with a speed set to 30 as well), below is the Fractal Graph dimension (https://www.mql5.com/en/code/8844):
 Gandalf_PRO
The EA well trades on "fat" sites of a trend on periods H4 and D - EURUSD.The input in the market occurs on the basis of two-parametrical Exponential Smoothings Time Series.
 News_Plotter
This indicator displays lines on the chart corresponding to upcoming news events. Customizable.
 Automatic Update the chart you drag it to
action just like pressing home key, esc to exit,
 Fractional Bands
A modification of the Bollinger Bands, in the same spirit as the Fractal Bands, but using a mathematically more precise equation
