당사 팬 페이지에 가입하십시오
- 조회수:
- 45510
- 평가:
- 게시됨:
- 업데이트됨:
-
 이 코드를 기반으로 한 로봇이나 지표가 필요하신가요? 프리랜스로 주문하세요
프리랜스로 이동
이 코드를 기반으로 한 로봇이나 지표가 필요하신가요? 프리랜스로 주문하세요
프리랜스로 이동
This a rework of a script by iliko called Fractal dimension and that can be found here: https://www.mql5.com/en/code/7758
In there, I corrected two minor errors, and added a calculation and representation of the standard deviation of the estimation of the box-counting dimension. The two minor errors were the following:
- At line 199:
Instead of : for( iteration=0; iteration < g_period_minus_1; iteration++ )
It should be : for( iteration=0; iteration <= g_period_minus_1; iteration++ )
- At line 213:
Instead of : fdi=1.0 +(MathLog( length)+ LOG_2 )/MathLog( 2 * e_period );
It should be : fdi=1.0 +(MathLog( length)+ LOG_2 )/MathLog( 2 * g_period_minus_1);
For further details, see my blog: http://fractalfinance.blogspot.com/
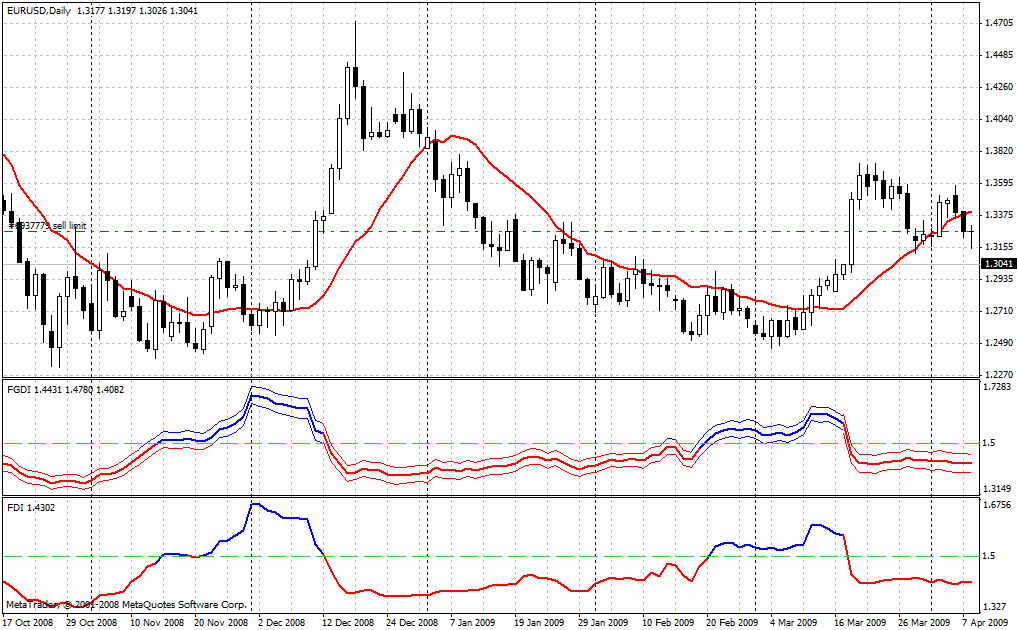
Here is what it looks like on a daily chart for EUR/USD, the lower window represents the original fractal dimension by iliko, and the moving average is the FRASMA I published earlier:
 wajdyss_T3_indicator_v3
This indicator for draw an Arrows for buy & sell , it's Depends on T3 Indicator http://forum.m-e-c.biz/t29283.html
Stochasic Chaikin's Volatility
This is stochasticzation of Chaikin's Volatility
wajdyss_3MA_Indicator_V1
This indicator for draw an Arrows for buy & sell, it's Depends on Cross 3 Moving Averages http://forum.m-e-c.biz/t29278.html
wajdyss_RSI_indicator_v1
This indicator for draw an Arrows for buy & sell, it's Depends on RSI Indicator http://forum.m-e-c.biz/t25109.html