 MetaTrader 5
 Experts
 지표
 스크립트
 라이브러리
 보관함
거래 로봇을 무료로 다운로드 하는 법을 시청해보세요
당사를 Facebook에서 찾아주십시오!
당사 팬 페이지에 가입하십시오
당사 팬 페이지에 가입하십시오
스크립트가 마음에 드시나요? MetaTrader 5 터미널에서 시도해보십시오

Previous Day High/Low with First Touch Marker - MetaTrader 5용 지표
Saad Ferdi

MQL5 and Python developer focused on gold and forex.
I build and fix MT5 Expert Advisors and indicators, with clean source code and clear input settings.
I build and fix MT5 Expert Advisors and indicators, with clean source code and clear input settings.
- 조회수:
- 21
- 게시됨:
-
 이 코드를 기반으로 한 로봇이나 지표가 필요하신가요? 프리랜스로 주문하세요
프리랜스로 이동

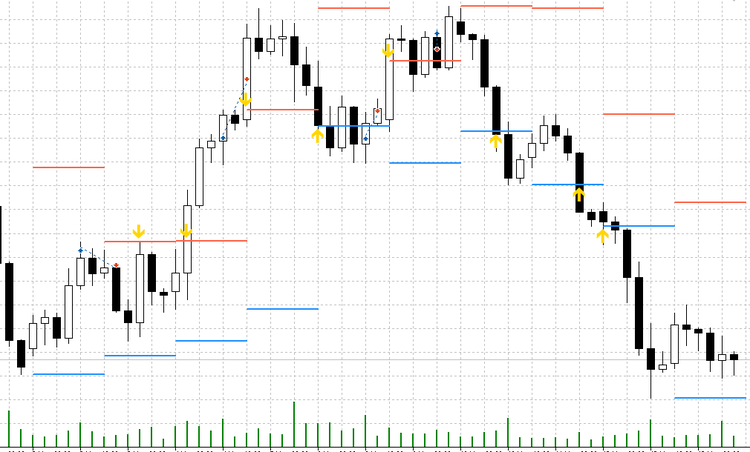
The indicator draws the previous day's high (PDH) and previous day's low (PDL) over each of the last N days and marks the first touch of each level during the day with an arrow. It is meant for traders who watch yesterday's extremes as intraday reference levels and want to see, on history and live, when price reaches them for the first time.
How it works
- For every day, PDH and PDL are taken from the previous D1 bar of the symbol, so days follow the broker's server time.
- Each pair of levels is drawn only over the day it belongs to (red = PDH, blue = PDL), not as endless lines.
- A touch only counts after price has been at least MinDist % away from the level. A day that opens on top of a level does not produce a touch until price has moved away and come back.
- Only the first touch of each level per day is marked (gold arrow), so the chart stays readable.
- Optional alert when today's first touch happens on the current bar (one alert per level per day).
Inputs
- InpDays (10) - number of days to draw.
- InpMinDistPct (0.075) - distance from the level, in % of price, that must be reached before a touch counts.
- InpAlert (true) - alert on today's first touch.
- InpHighColor / InpLowColor / InpTouchColor - colours of PDH, PDL and the first-touch arrows.
Notes
- Attach it to an intraday chart (H4 or lower). On D1 and above it loads but draws nothing, because there is no intraday first touch to mark.
- The indicator only draws objects (prefix PDFT_), it has no buffers, and it removes its objects when deleted.
- If D1 history is not loaded yet (for example when the market is closed), it retries every second until the data is available.
- A first touch is a reference point, not a signal. In my own test on gold (2010-2026, 3,637 first touches), trading the break of the level at the first touch won about 50% of the time, and fading it was worse, so use it together with your own rules.
 EA Safety Check - scan EA source for DLLs, data leaks and martingale
Static safety scan of EA/indicator source: DLL imports, programs started, account data sent online, hidden text, martingale, SL = 0.
JONY ISLAM EMA Cluster Signals with Entry SL TP MTF Panel
JONY ISLAM EMA Cluster Signals is a technical indicator that plots a 4-EMA cluster cloud to identify trend direction. It generates Buy/Sell arrow signals and automatically calculates Entry, Stop Loss, and TP1-TP3 levels using ATR. It also features a built-in Multi-Timeframe (M1-W1) trend panel.
Accelerator Oscillator (AC)
The Acceleration/Deceleration Indicator (AC) measures acceleration and deceleration of the current driving force.
MACD Signals
Indicator edition for new platform.