거래 로봇을 무료로 다운로드 하는 법을 시청해보세요
당사를 Facebook에서 찾아주십시오!
당사 팬 페이지에 가입하십시오
당사 팬 페이지에 가입하십시오
스크립트가 마음에 드시나요? MetaTrader 5 터미널에서 시도해보십시오
- 조회수:
- 10114
- 평가:
- 게시됨:
-
이 코드를 기반으로 한 로봇이나 지표가 필요하신가요? 프리랜스로 주문하세요 프리랜스로 이동
It is often necessary to know the distance in points between two levels of a chart. For example, in order to find out the exact current distance between today's High and Low.
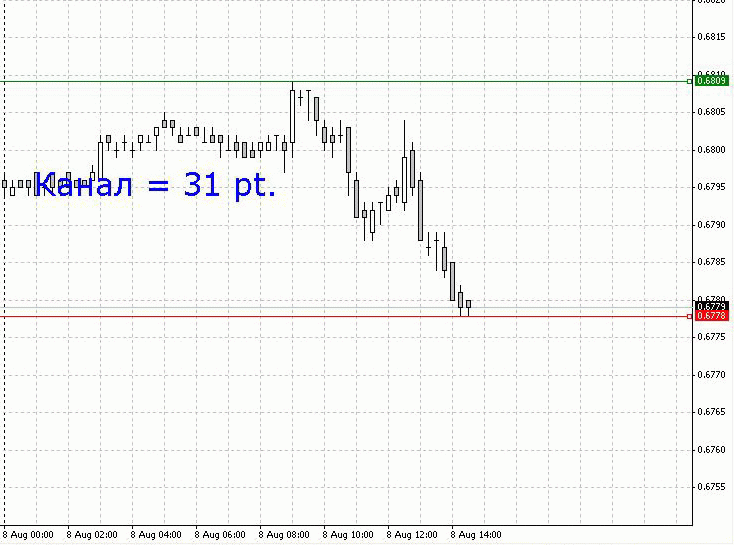
To avoid calculating it manually, the following can be done: using the Lines_Create script create 2 horizontal lines on the chart (it creates green and red lines). Move the green line up and the red line down to the required levels. Then use the Lines_RASST script, which displays a message about the number of points in the distance between the two horizontal lines. (Illustration below.). But there is a nuance.
Due to the fact that the Lines_RASST script has a delay in its code, it is necessary not to simply drop in on the chart, or simply
double-click the script, it is also necessary to make a single left mouse button click on the chart window.
Only in this case the label which tells the distance appears, and automatically disappears 5 seconds after.
If the Lines_RASST script is called and the additional click on the window was not made, then after 5 seconds the script will be unloaded from the memory,
and you will not see anything on the screen, no labels (I do not know why the terminal is done that way). Here is the result of the Lines_Create and Lines_RASST operation.
After all that the Lines_Delete can be launched, which deletes only those two lines from the chart.

MetaQuotes Ltd에서 러시아어로 번역함.
원본 코드: https://www.mql5.com/ru/code/7278
 Daily Research
This script is designed for obtaining various statistical data on the chart candlesticks on the selected timeframe.
 History_Draw
2 scripts for the analysis of trading results. Useful both for investors and traders.
