 MetaTrader 5
 Experts
 지표
 스크립트
 라이브러리
 보관함
거래 로봇을 무료로 다운로드 하는 법을 시청해보세요
당사를 Twitter에서 찾아주십시오!
당사 팬 페이지에 가입하십시오
당사 팬 페이지에 가입하십시오
스크립트가 마음에 드시나요? MetaTrader 5 터미널에서 시도해보십시오

Pan PrizMA CD Phase Sin leverage 72 - MetaTrader 4용 지표
Aleksey Panfilov

.
Hello there!
I propose to try and assess the indicators constructed on the basis of recursive calculation. Mathematical basis here: http://dxdy.ru/post1247421.html#p1247421
Hello there!
I propose to try and assess the indicators constructed on the basis of recursive calculation. Mathematical basis here: http://dxdy.ru/post1247421.html#p1247421
- 조회수:
- 22329
- 평가:
- 게시됨:
- 업데이트됨:
-
 이 코드를 기반으로 한 로봇이나 지표가 필요하신가요? 프리랜스로 주문하세요
프리랜스로 이동

This indicator is based on the PanPrizMA Sin leverage 72 indicator, the features of which make it possible to calculate the phase and amplitude. This can sometimes be helpful.
The phase is calculated in degrees, takes values from 0 to 360 and is displayed by the 5th, green line (removed from array 4).
The opposite phase is also calculated in degrees, takes values from -360 to 0 and is displayed by the 6th, red line (removed from array 5). In the calculations, it is more convenient to use the antiphase values in the sum with 360 (which conditionally raises it to the phase level).
The amplitude with a factor of 1 is calculated in points and displayed by the 9th orange line (removed from array 8)
- Averaging by a polynomial of the second or fourth degree increases the smoothness of lines, adds inertia and, accordingly, rhythm.
- Extrapolation by the function of a sinusoid near a constant allows you to adjust the delay or lead.
- The value of the phase - the state parameter of the wave (close in meaning to the trigonometric phase or the angle of rotation of the radius vector in the trigonometric plane) allows you to digitize each point of the line and, accordingly, use any necessary point in the expert as a trading signal. And this, in turn, accelerates the process of optimizing strategies.
- Digitization allows you to set asymmetric resolution / prohibition intervals during filtering. The interval of the prohibition of trade against the trend can be, for example, 90 degrees, starting from any phase, only a quarter of the entire wave period.
Refinement of the indicator from the topic: Difference calculus, examples .
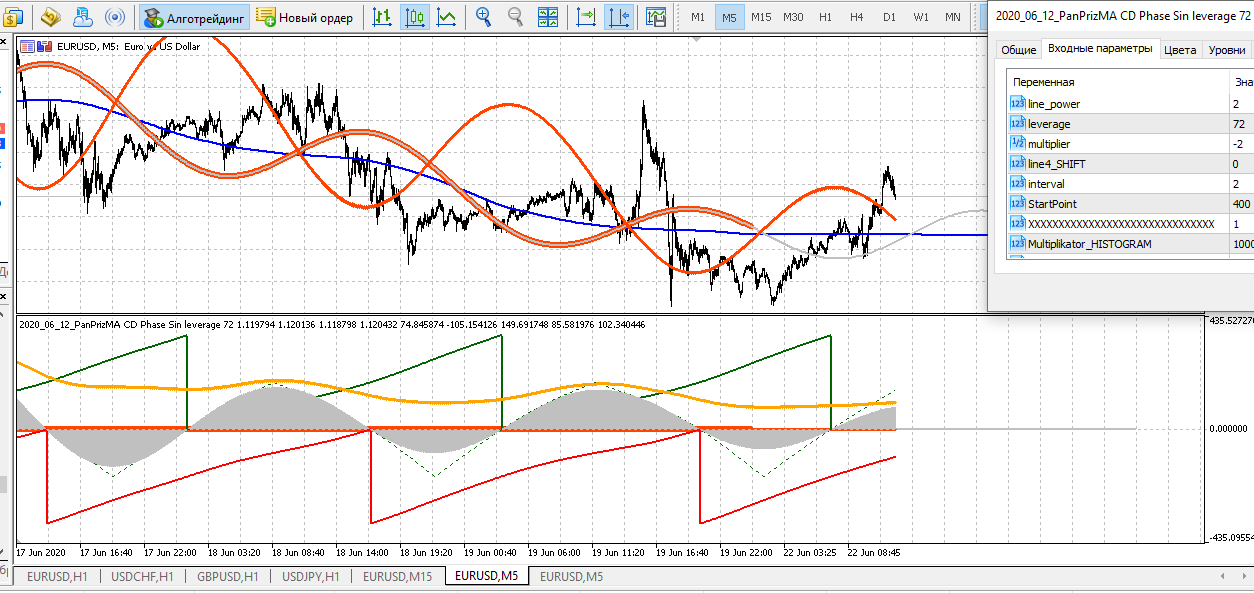
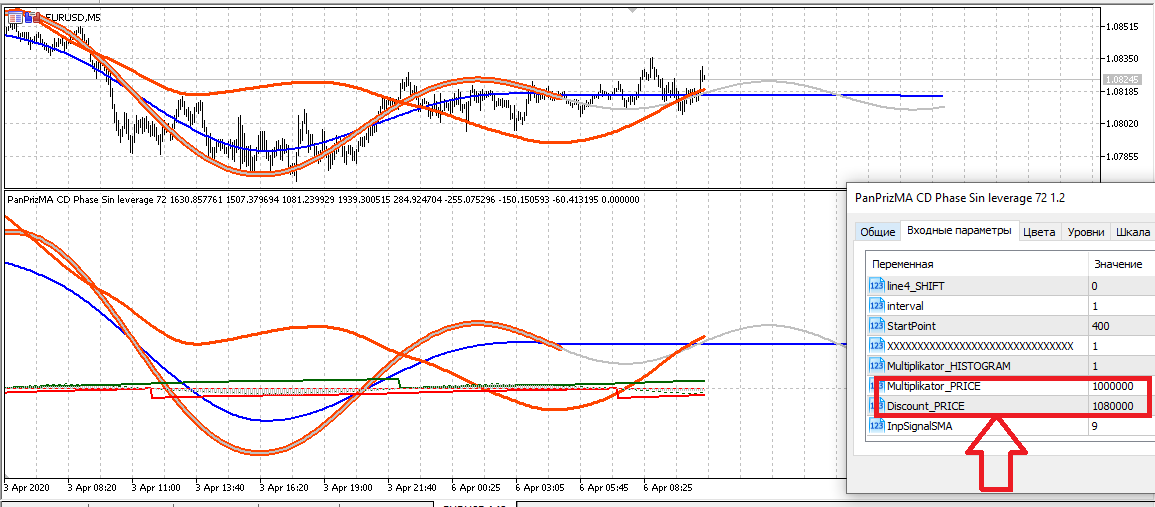
I want to draw attention to the fact that there are “crutches” in the indicator that allow you to display the initial lines of the PanPrizMA Sin leverage 72 indicator.
Consecutive Identical Candles
for number of currency pairs.
Volatility Scanner
Volatility Scanner in raw form for number of currency pairs.
 Trade History Marker 1.10
Mark your historical trades in you mt4 with lines and arrows. You can load data from your history or load data from a csv file.
Daily Pivot, Resistance and Support Levels Assist
This is an indicator on Daily Pivot Points and Support and Resistance levels.