당사 팬 페이지에 가입하십시오

MACD_Overlay - MetaTrader 5용 지표
- 조회수:
- 18680
- 평가:
- 게시됨:
-
 이 코드를 기반으로 한 로봇이나 지표가 필요하신가요? 프리랜스로 주문하세요
프리랜스로 이동
이 코드를 기반으로 한 로봇이나 지표가 필요하신가요? 프리랜스로 주문하세요
프리랜스로 이동
Indicator MACD Overlay displays the chart as colored candles according to the data from oscillator MACD.
It has five adjustable parameters:
- Data MACD Compare mode - MACD data comparison mode
- MACD and signal Lines - MACD line and signal line
- MACD vs zero line - MACD line referred to zero
- Current and previous MACD values - comparing the current and previous values of the MACD line
- MACD fast EMA period - MACD indicator's fast EMA calculation period
- MACD slow EMA period - MACD indicator's slow EMA calculation period
- MACD period signal line - MACD indicator's signal line calculation period
- MACD applied price - MACD indicator's calculation price
MACD and signal Lines:
- If the MACD line is above the signal line,
then the bullish candle is displayed in green
the bearish candle is displayed in light-green
- If the MACD line is below the signal line,
then the bearish candle is displayed in red
the bullish candle is displayed in light-red
MACD vs zero line:
- If the MACD line is above zero,
then the bullish candle is displayed in green
the bearish candle is displayed in light-green
- If the MACD line is below zero,
then the bearish candle is displayed in red
the bullish candle is displayed in light-red
Current and previous MACD values:
- If the MACD line values grow,
then the bullish candle is displayed in green
the bearish candle is displayed in light-green
- If the MACD line values fall,
then the bearish candle is displayed in red
the bullish candle is displayed in light-red
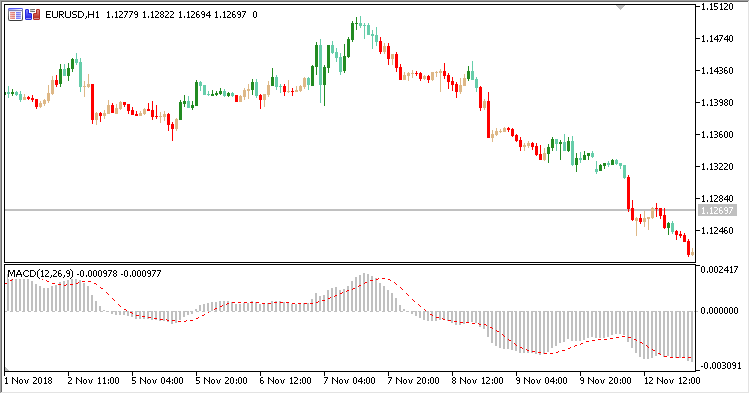
Fig. 1. MACD Overlay + MACD. Data MACD Compare mode = MACD and signal Lines
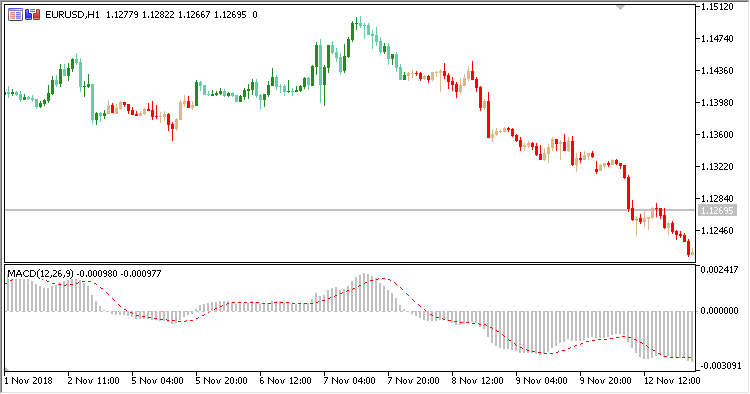
Fig. 2. MACD Overlay + MACD. Data MACD Compare mode = MACD vs zero line
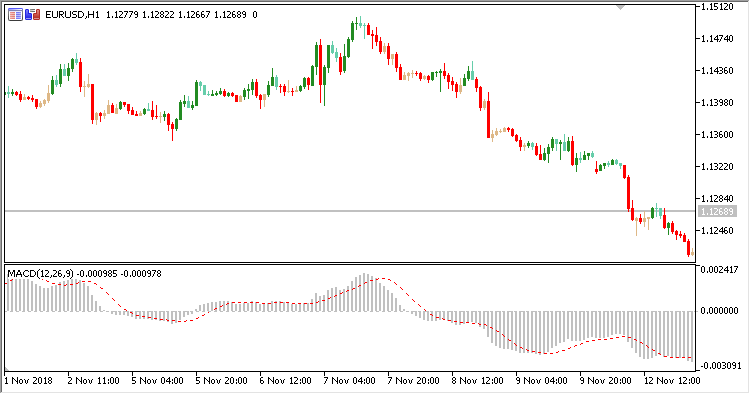
Fig. 3. MACD Overlay + MACD. Data MACD Compare mode = Current and previous MACD values
MetaQuotes Ltd에서 러시아어로 번역함.
원본 코드: https://www.mql5.com/ru/code/23427
ColorPEMA_Digit
A five-fold exponential moving average that displays the most recent value as a price label with the possibility to round the indicator levels to the required number of orders
Advanced_Fractal_Envelopes
Indicator Advanced Fractal Envelopes
ColorPEMA_Digit_r
A moving ColorPEMA_Digit with the limitation of the computer resources used for its calculations on the entire chart and on the current bar
RSI_Overlay
Indicator RSI Overlay