거래 로봇을 무료로 다운로드 하는 법을 시청해보세요
당사를 Telegram에서 찾아주십시오!
당사 팬 페이지에 가입하십시오
당사 팬 페이지에 가입하십시오
스크립트가 마음에 드시나요? MetaTrader 5 터미널에서 시도해보십시오

3TF_RSI_Average - MetaTrader 5용 지표
- 조회수:
- 7636
- 평가:
- 게시됨:
-
 이 코드를 기반으로 한 로봇이나 지표가 필요하신가요? 프리랜스로 주문하세요
프리랜스로 이동
이 코드를 기반으로 한 로봇이나 지표가 필요하신가요? 프리랜스로 주문하세요
프리랜스로 이동
'Three timeframes RSI Average' displays in a separate window three Relative Strength Index indicator of the specified timeframes, as well as their average value.
It has ten input parameters:
- RSI period - RSI calculation period
- Overbought - overbought level
- Oversold - oversold level
- Drawing mode - indicator drawing type
- Steps - as a ladder
- Slope - sloping lines
- First RSI timeframe - the timeframe of the first RSI
- Second RSI timeframe - the timeframe of the second RSI
- Third RSI timeframe - the timeframe of the third RSI
- Show first RSI - show the first RSI indicator
- Show second RSI - show the second RSI indicator
- Show third RSI - show the third RSI indicator
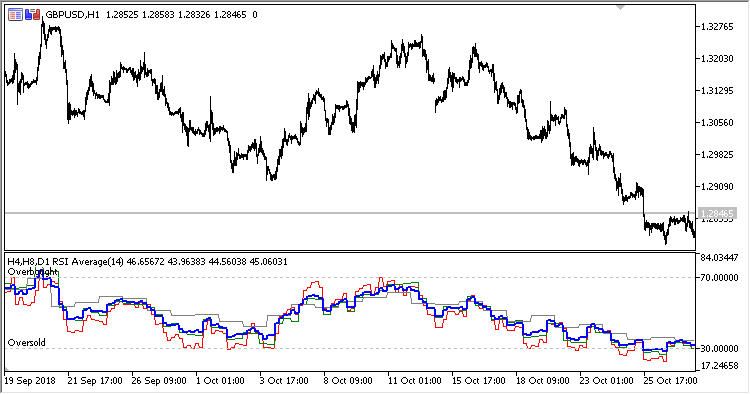
Fig.1. Three timeframes RSI Average, H4, H8 and D1 data on the H1 chart, Drawing mode = Steps
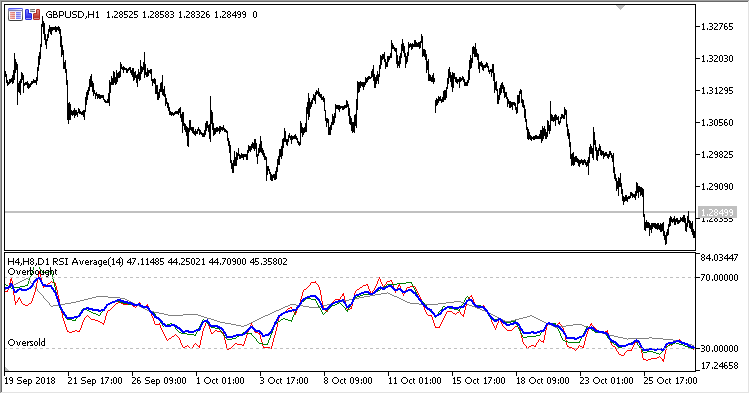
Fig. 2. Three timeframes RSI Average, H4, H8 and D1 data on the H1 chart, Drawing mode = Slope
MetaQuotes Ltd에서 러시아어로 번역함.
원본 코드: https://www.mql5.com/ru/code/23317
3TF_Stochastic_Average
The Three timeframes Stochastic Average indicator
Tymen_STARC_Bands
The Tymen STARC Bands indicator
 Dynamic averaging
The EA implements averaging of positions. The average iStdDev is calculated in a sliding window.
ColorRSI_X20_Cloud_HTF
The ColorRSI_X20_Cloud indicator with the possibility to change the indicator timeframe using input parameters