당사 팬 페이지에 가입하십시오

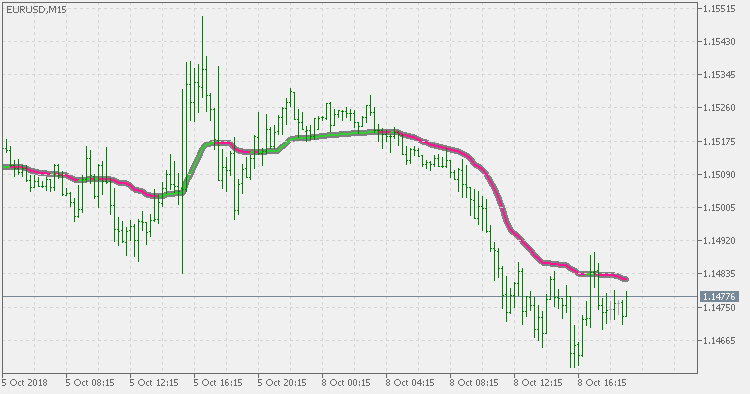
Vidya - MetaTrader 5용 지표

- 조회수:
- 11183
- 평가:
- 게시됨:
- 업데이트됨:
-
 이 코드를 기반으로 한 로봇이나 지표가 필요하신가요? 프리랜스로 주문하세요
프리랜스로 이동
이 코드를 기반으로 한 로봇이나 지표가 필요하신가요? 프리랜스로 주문하세요
프리랜스로 이동
Basics:
Variable Index Dynamic Average (VIDYA) technical indicator was developed by Tushar Chande.
It is an original method of calculating the Exponential Moving Average (EMA) with the dynamically changing period of averaging. Period of averaging depends on the market volatility; as the measure of volatility Chande Momentum Oscillator (CMO) is used.
This version:
There are Vidya indicators that are already doing the calculation the way how Tushar Chande describes it. The issue is actually in the way how CMO is calculated. The way how CMO is usually calculated makes it quite inefficient (try it for longer periods). This version fixes that and, as far as speed of execution is concerned, there is practically no difference if you use short or long periods so it can be used in regular trading and in testing without a danger of having too long calculations.
Usage:
You can use the color change for signals.