당사 팬 페이지에 가입하십시오

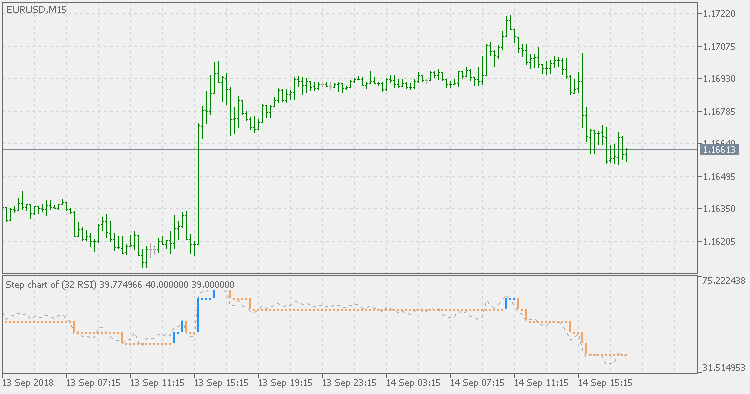
Step chart of RSI - MetaTrader 5용 지표

- 조회수:
- 5699
- 평가:
- 게시됨:
- 업데이트됨:
-
 이 코드를 기반으로 한 로봇이나 지표가 필요하신가요? 프리랜스로 주문하세요
프리랜스로 이동
이 코드를 기반으로 한 로봇이나 지표가 필요하신가요? 프리랜스로 주문하세요
프리랜스로 이동
Basics :
RSI (Relative Strength Index) is well known and is widely used. Sometimes it is used in a combination of some filtering method in order to avoid some of the false signals that RSI might produce in some market conditions. This is one more version that will attempt to address the issue by using a filter on RSI
This version :
This version is using step chart as a filter to lessen the number of signals produced by RSI and (if possible) to make it easier and safer to use. The step size is to be entered in % of RSI that you wish to be used as a filter for minimal RSI change that should be considered as a significant change
Usage :
Use color change of the step bar as signals
Step chart of averages
Step chart of averages
 Support and Resistance Trader
Expert adviser scans past 500 closing bars and looks for common closing regions as entries.