당사 팬 페이지에 가입하십시오
- 조회수:
- 4554
- 평가:
- 게시됨:
-
이 코드를 기반으로 한 로봇이나 지표가 필요하신가요? 프리랜스로 주문하세요 프리랜스로 이동
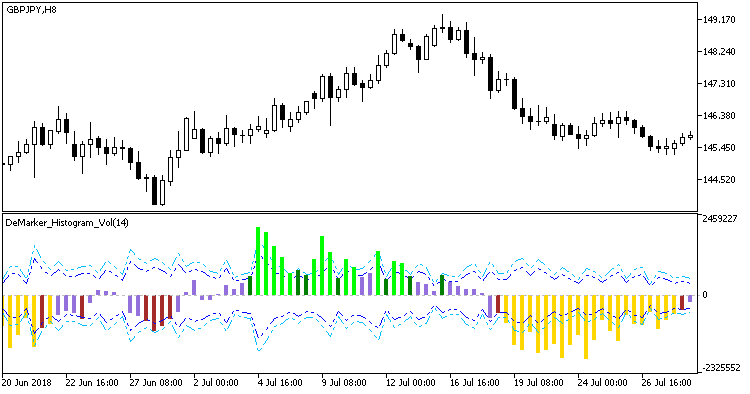
DeMarker oscillator displayed as a color histogram, using volumes.
Calculation formula:
DeMarker Histogram Vol = (100 * DeMarker - 50) * Volume
For quite understandable reasons, the recalculation of overbought and oversold levels in such a modified oscillator should be performed using the same formula. In the final version, these levels are no longer permanent. Two levels with the appropriate breakout indication were used.
input int                 HighLevel2=+20;           // overbought level 2
input int                 HighLevel1=+15;           // overbought level 1
input int                 LowLevel1=-15;            // oversold level 1
input int                 LowLevel2=-20;            // oversold level 2
In the indicator input parameters, these levels are additionally multiplied by 100 and shifted by the levels of 50 of the source DeMarker, and then multiplied by volumes at each indicator tick.

Fig. 1. DeMarker_Histogram_Vol
MetaQuotes Ltd에서 러시아어로 번역함.
원본 코드: https://www.mql5.com/ru/code/21909
 StepMA_3D_v3_HTF
The StepMA_3D_v3 indicator with the timeframe selection option available in the indicator input parameters
 Iin_MA_Signal_Alert
Iin_MA_Signal semaphore signal indicator features alerts, emails and push notifications
 XCCI_Histogram_Vol_HTF
XCCI_Histogram_Vol indicator with the timeframe selection option available in input parameters
 XRSI_Histogram_Vol_HTF
XRSI_Histogram_Vol indicator with the timeframe selection option available in input parameters