거래 로봇을 무료로 다운로드 하는 법을 시청해보세요
당사를 Telegram에서 찾아주십시오!
당사 팬 페이지에 가입하십시오
당사 팬 페이지에 가입하십시오
스크립트가 마음에 드시나요? MetaTrader 5 터미널에서 시도해보십시오

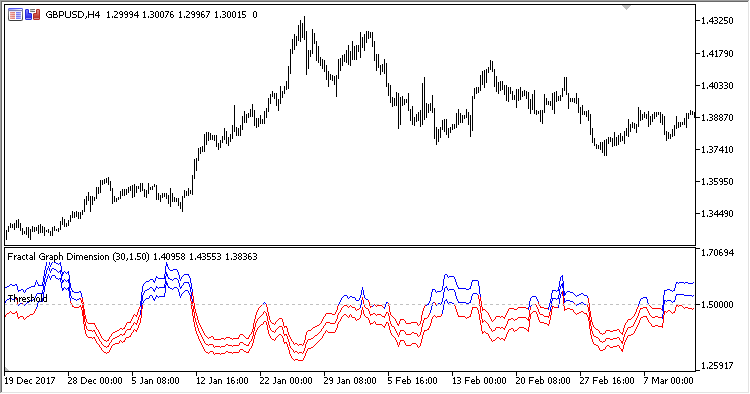
FGDI - MetaTrader 5용 지표
- 조회수:
- 6205
- 평가:
- 게시됨:
-
 이 코드를 기반으로 한 로봇이나 지표가 필요하신가요? 프리랜스로 주문하세요
프리랜스로 이동
이 코드를 기반으로 한 로봇이나 지표가 필요하신가요? 프리랜스로 주문하세요
프리랜스로 이동
Fractal Graph Dimension Indicator shows the market state: trend or volatility.
It was described in "Technical Analysis of Stocks and Commodities" in March, 2007, in the article by Radha Panini, based on the article "A procedure to Estimate the Fractal Dimension of Waveforms" by Carlos Sevcik.
The indicator has three input parameters:
- Period - calculation period
- Applied price
- Threshold - the threshold level
Values below the threshold mean the trend state of the market and are displayed in red. Values above the threshold indicate the unstable volatile state and are displayed in blue.
MetaQuotes Ltd에서 러시아어로 번역함.
원본 코드: https://www.mql5.com/ru/code/21826
Forecast
The Forecast oscillator indicator
 Exp_Trend_Intensity_Index
A trading system based on the Trend_Intensity_Index oscillator signals.