당사 팬 페이지에 가입하십시오
- 게시자:
- Vladimir Karputov
- 조회수:
- 6442
- 평가:
- 게시됨:
-
이 코드를 기반으로 한 로봇이나 지표가 필요하신가요? 프리랜스로 주문하세요 프리랜스로 이동
Idea by: costy_
MQL5 code author: barabashkakvn
The iMA (Moving Average, MA) indicator in this Expert Advisor allows changing the timeframe (MA: timeframe), horizontal shift (MA: horizontal shift), averaging method (MA: smoothing type) and applied price (MA: type of price) - i.e. all parameters except the averaging period. The averaging period is provided in the code and is equal to 55 (this number is used in the EA name).
How it works
The EA only operates during a new bar formation. As soon as the current time (only hours, without minutes and seconds) enters the interval from Start hour to End hour, the Expert Advisor requests data from the indicator. It does not just request data from bar #0 and #1, but it requests data from Bar number #A and Bar number #B.
Then the values on these two bars are compared: if the difference between them is greater than or equal to Difference between bars #A and #B - a position open signal will be generated. The Reverse signals function is disabled by default (set to false), and the following rules apply to a signal:
A BUY signal: MA(Bar number #A) > MA(Bar number #B) + Difference between bars #A and #B;
A SELL signal: MA(Bar number #A) < MA(Bar number #B) - Difference between bars #A and #B.
If you enable closing of opposite positions (set Close opposite positions to true), Sell positions will be closed at the final BUY signal and vice versa.
Volume calculation
Position volume can be fixed - in this case it is specified by the Lots or calculated based on the Risk parameter (Lots must be equal to zero in this case).
How to optimize
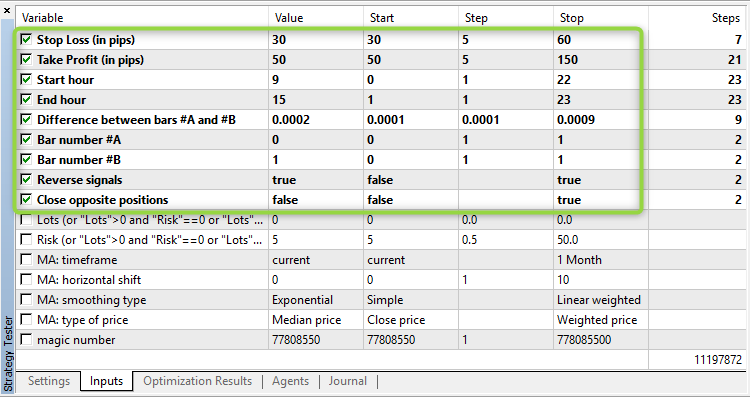
You should optimize the EA individually for each symbol and timeframe. Since the EA only performs operations at the new bar formation time, the genetic optimization can be performed in the "1 minute OHLC" tick generation mode.
The figure shows approximate parameter limits for timeframes from M15 to H1:

MetaQuotes Ltd에서 러시아어로 번역함.
원본 코드: https://www.mql5.com/ru/code/21743
 SVE_ARSI
The SVE_ARSI (Sylvain Vervoort's Asymmetrical RSI) indicator was described in the October '08 issue of the "Stocks & Commodities" magazine.
 Demand_Index
The Demand_Index indicator developed by James Sibbet combines the price and volume, and is often considered a leading indicator of price change.
