당사 팬 페이지에 가입하십시오

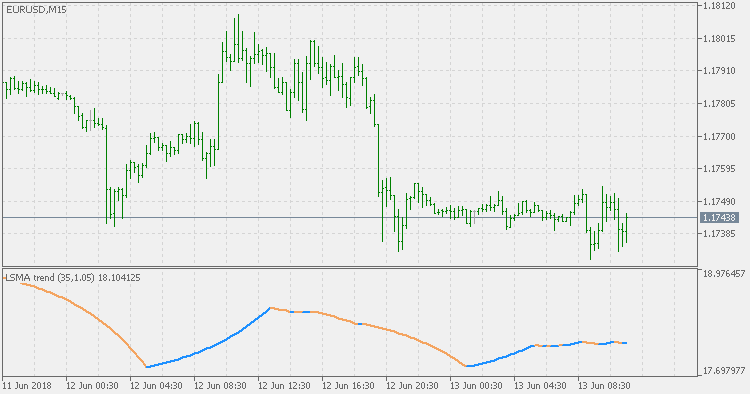
LSMA Trend - MetaTrader 5용 지표

- 조회수:
- 7925
- 평가:
- 게시됨:
-
 이 코드를 기반으로 한 로봇이나 지표가 필요하신가요? 프리랜스로 주문하세요
프리랜스로 이동
이 코드를 기반으로 한 로봇이나 지표가 필요하신가요? 프리랜스로 주문하세요
프리랜스로 이동
Indicator based on linear regression value or, as it is sometimes known - LSMA (Least Squares Moving Average).
It shows the trend of the used average and displays it as a sort of an oscillator.
Quadratic Regression MA
Quadratic Regression MA is a sort of a linear regression value variation, but faster in response to market changes.
Historical Volatility Bands - High/Low
Historical Volatility bands constructed using average as the middle line, and upper and lower bands using the Historical Volatility high/low (instead of "regular" Historical Volatility) for bands calculation.
Trend Envelopes of Averages
Trend Envelopes with an option to chose smoothed/filtered price in calculation instead of using "raw" prices.
Historical Volatility - Parkinson
An important use of the Parkinson's number is the assessment of the distribution prices during the day as well as a better understanding of the market dynamics. Comparing the Parkinson's number and periodically sampled volatility helps traders understand the tendency towards mean reversion in the market as well as the distribution of stop-losses.