당사 팬 페이지에 가입하십시오

Phase Change Index - MetaTrader 5용 지표

- 조회수:
- 7741
- 평가:
- 게시됨:
-
 이 코드를 기반으로 한 로봇이나 지표가 필요하신가요? 프리랜스로 주문하세요
프리랜스로 이동
이 코드를 기반으로 한 로봇이나 지표가 필요하신가요? 프리랜스로 주문하세요
프리랜스로 이동
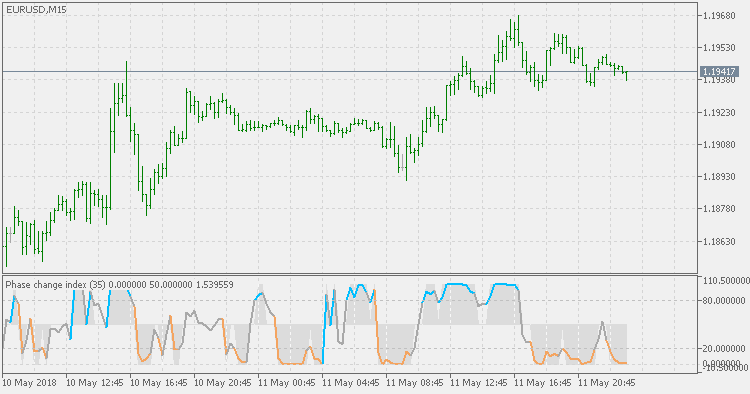
Based on the M.H. Pee's TASC article "Phase Change Index".
Prices at any time can be up, down, or unchanged. A period where market prices remain relatively unchanged is referred to as a consolidation. A period that witnesses relatively higher prices is referred to as an uptrend, while a period of relatively lower prices is called a downtrend.
The Phase Change Index (PCI) is an indicator designed specifically to detect changes in market phases.
This indicator is made as he describes it with one deviation: if we follow his formula to the letter then the "trend" is inverted to the actual market trend. Because of that an option to display inverted (and more logical) values is added.
T3 bands
Variation of the well known Bollinger Bands indicator.
T3 Deviation
T3 Deviation uses intermediate steps of T3 calculation to get the deviation based on T3. As expected the deviation calculated this way is much smoother than the Standard Deviation (as a result of using T3 which on its own is smoother than the simple moving average), and is "faster" in response to market changes.
Trend Continuation Factor - Jurik smoothed
Trend Continuation Factor (TCF) indicator with Jurik smoothing identifies the trend and its direction.
Trend Continuation Factor
Trend Continuation Factor (TCF) indicator identifies the trend and its direction.