당사 팬 페이지에 가입하십시오

Assistant for checking strategies on history data - MetaTrader 4용 지표

- 조회수:
- 17850
- 평가:
- 게시됨:
-
 이 코드를 기반으로 한 로봇이나 지표가 필요하신가요? 프리랜스로 주문하세요
프리랜스로 이동
이 코드를 기반으로 한 로봇이나 지표가 필요하신가요? 프리랜스로 주문하세요
프리랜스로 이동
Builds 600 and up include the control functions, but only in indicators. That is still helpful.
The "TPEHEP" (Trainer) was developed to help analyze the interesting strategies, and also to practice and gain experience in analyzing the signals on history data in the selected strategy. The maximum approximation to the market rules https://book.mql4.com/en/trading/orders gives the opportunity for the novice to understand the logic behind the order triggering and strategy signal formation, and to find the suitable strategy.
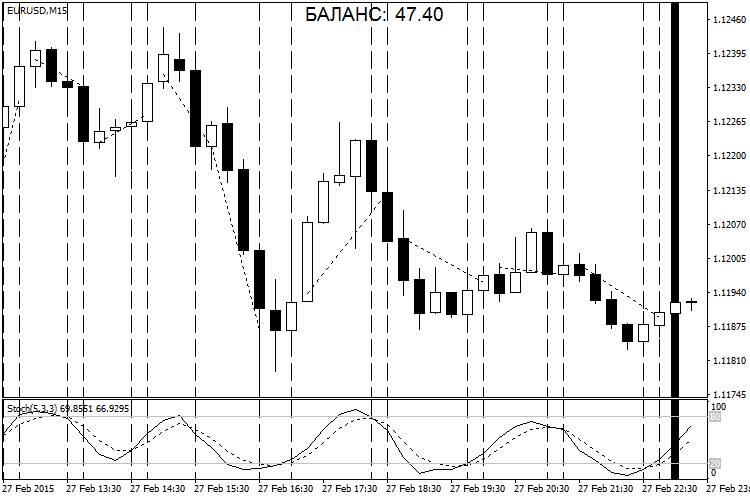
Initially, an assistant was needed to highlight the decision-making places. The opening line of BUY (blue, key "B") or SELL (pink, key "S") and the CLOSE line fit this task the best. Keys were chosen for convenience — the right hand moves the history and the left performs commands.
Basic rules of operation:
Opening and closing orders is only allowed when the candle is closing (Close[Bar0]) inside a vertical colored area Bar0 (purple), and the order itself is opened or closed the moment a new candle opens (Open[Bar-1]). Once the StopLoss or TakeProfit level is reached, the closure happens by the order price in the active area. StopLoss or TakeProfit can be trailed by the mouse, with the control of the minimal distance and freezing.
During the early stages of learning the active area can be shifted using the "<" and ">" keys, gradually approaching the right side. The offset of the history is performed in steps by pressing the "F12" key or the hot key, and the active zone (purple) remains at the selected location.
Selection of a hot key instead of "F12": press the desired button — alert with the message "Pressed wrong button ХХХ" will appear, in the settings in the line "Key to shift the chart by 1 step" write the ХХХ. By default the "Del" key on the numeric keypad is used.
The installation of the indicator is standard: open the chart of the currency pair, it is necessary to select the history, set the analyzed strategy according to the template and attach the TPEHEP indicator. Store the setting by pressing the "Р" key (Record) to the template (EURUSD.60.tpl). All is set. If the active area is not visible, press the left mouse button.
After plotting the chart will look like:
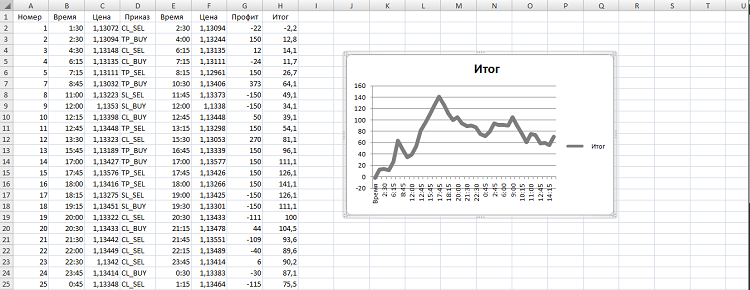
The further improvement of the assistant was in maintaining the open positions, various trader error control, and also the output of the final data, Excel table and plotting the profitability chart in Excel.
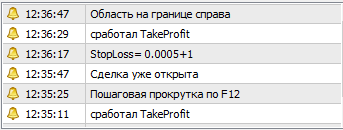
The strategy results are displayed in the BALANCE table, and once the checking ends, by pressing the "Р" (Record) key, are written to the file "EURUSD.60 2015.07.06-2015.07.06.xls" with the testing start and end dates in the <terminal_data>\MQL4\Files\ folder.
Then consider a different strategy…
Analysis of the Triple Screen strategies
For plotting on another timeframe, disable the order processing (Trading=false). Only the vertical lines as signal moments are left. The plotting results are written to the "EURUSD.60 2015.07.06-2015.07.06.tpl" file by pressing the "Р" (Record) key. Use this plotting template on a different timeframe and, by changing the set of indicators and using the template plotting, perform the final profitability testing with the order processing enabled (Trading=true).
After testing the strategy, save the recorded files in the backup folder with the name: Test EURUSD Per Stochastic 5 3 3 Moving Averages EMA55 and so on. This allows to select the best option of the strategy setup. During the next testing, if the template names or the results match, the files are overwritten with the loss of the previous results. So be sure to back up!
MetaQuotes Ltd에서 러시아어로 번역함.
원본 코드: https://www.mql5.com/ru/code/14675
 Zonal Trading
The Expert Advisor which uses AO and AC. Buying and selling is performed when the colors of the indicators match.
RSI_Expert_v2.0
The Expert Advisor based on the RSI indicator. МА and martingale are added in the new version.
Tick Chart
The presented indicator plots a fully-functional tick chart similar to the standard price charts, with the ability of the analysis using all the MetaTrader features.
Future_Indicator
The indicator based on the moving averages shifted to the left relative to the chart.