당사 팬 페이지에 가입하십시오
- 조회수:
- 29097
- 평가:
- 게시됨:
- 업데이트됨:
-
이 코드를 기반으로 한 로봇이나 지표가 필요하신가요? 프리랜스로 주문하세요 프리랜스로 이동
Real author:
Lawrence Chan
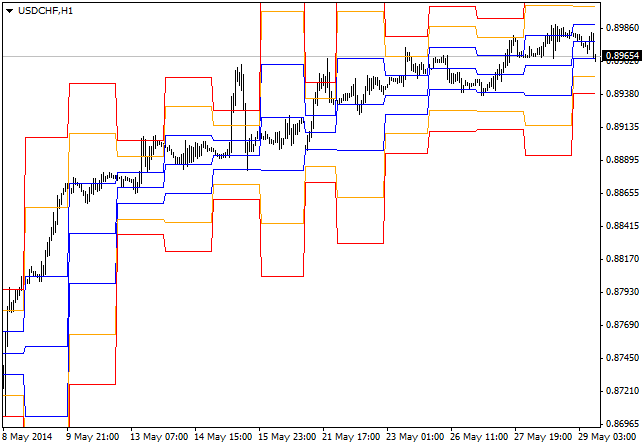
It plots the STOPD Price Levels based on user specified timeframe (parameter Timeframe, D - daily, W - weekly, M - monthly, Q - quarterly, Y - yearly).
The other parameters are there for customization of the price levels in case users like to experiment with other price expansion multiples.
The indicator is suitable for use in any timeframes. It can also be used multiple times within one chart to overlay multiple timeframes (MTF) of STOPD Price Levels on the same chart. The price levels are more often than not where reactions would happen.
STOPD is short form for Special Theory of Price Discovery.

 QuotesDemo
The Expert Advisor shows the current values of World Stock Indices from Google Finance using WebRequest function.
 SignalsDemo
The Expert Advisor shows the properties of the signals, allows to modify the signal copy settings and subscribe or unsubscribe to the selected trade signal.
