Because the feedbacks are so great we holding the lower price for a few days more.
==============================
(By this weekend will end.)
Get it now!
==============================
==============================
(By this weekend will end.)
Get it now!
==============================

Bernhard Schweigert
Bernhard Schweigert | Yesterday
Advanced Currency Strength28: New version 3.6 released!
======================================================
Those who own the indicator already can now update for free. For the others:
Because the feedbacks are so great holding the lower price for a few days more.
______________________Get it now!_____________________
======================================================
Recap: What are dynamic Market Fibonacci levels (MFib)?
We all know Fibonacci levels from a simple chart but this is a completely different approach. We will now apply Fibonacci on currency strength instead of a price chart. This is one level higher.
Dynamic Market Fibonacci levels is a special feature of Advanced Currency Strength28 indicator and you cannot find in any other Currency Meter! This is a very unique function.
Dynamic Market Fibonacci levels are based on the entire Market activity (all 28 pairs). This is one way to see when Market Makers are active and you want to be with them in your trade! We see clearly on minute charts rising Market activity at London open and falling around London/New York close.
The Market Fibonacci levels 161 and 261 we call Market Fibonacci Retracement Zones (MFib 161/-161 and MFib 261/-261): These levels are used with CS-lines for potential reversal zones and strength sentiment.
We also use the Market Fibonacci level 100 to check if we are early enough to enter a trade (MFib100/-100).
Some traders use also the Market Fibonacci level 23 to check if the sentiment is with a trade (MFib23/-23) (This is optional).
Above mentioned MFib23 value we use to get the GAP value for the GAP arrow.
All together and combinations of it will apply with the functions for the “HIT and HOOK” alert and the pink stopper sign (a warning for extreme levels).
======================================================
Now... what is new?
======================================================
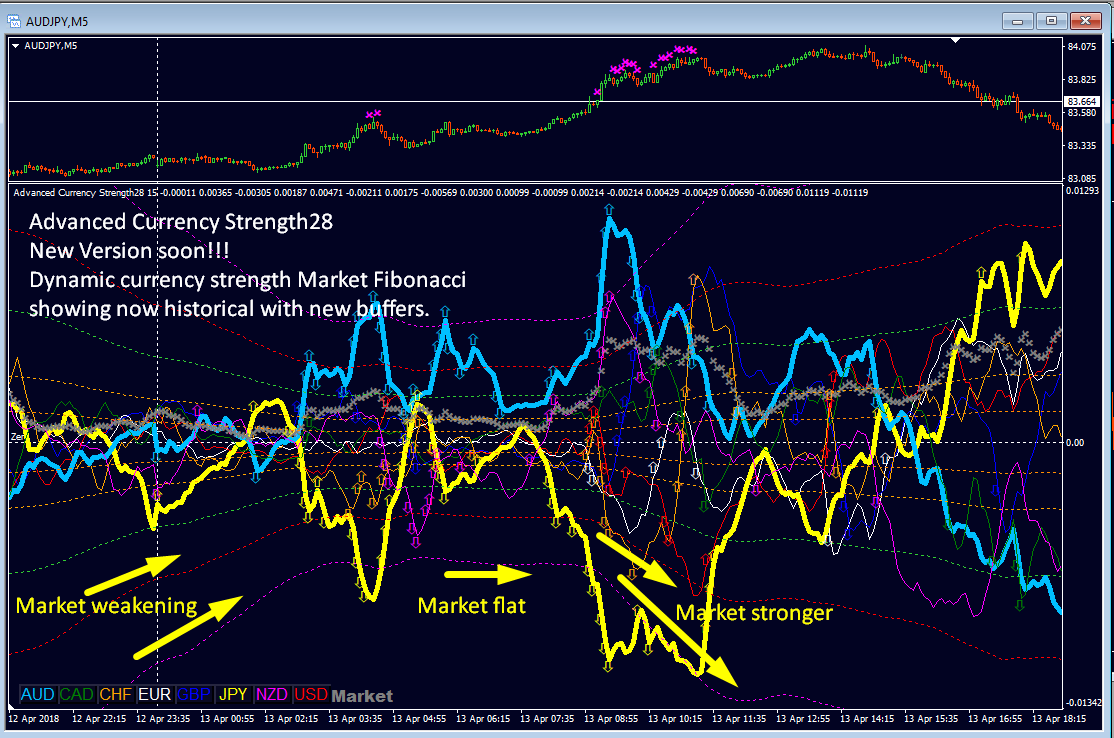
In recent versions, the Market Fibonacci levels were shown as a horizontal line. Those lines were applied to the last closed candle. It means you do not see how Dynamic Market Fibonacci levels were in the past.
======================================================
The upcoming version will draw all Market Fibonacci level historically! Now you have all the complete historical view!
======================================================
The development, research, and programming of this indicator reached now 2 years and a half and it is now the best available currency meter in the market.
______!!! NEW VERSION 3.6 RELEASED !!!_______
=============================================
Because the feedbacks are so great holding the lower price for a few days more.
======================================================
Profit now with the lower price. Get it now!
======================================================
Advanced Currency Strength28 Indicator (MT4)
https://www.mql5.com/en/market/product/13948
ACS28 user manual: https://www.mql5.com/en/blogs/post/697384
2