Trading Hours by Market Instruments
- インディケータ
- バージョン: 1.0
- アクティベーション: 5

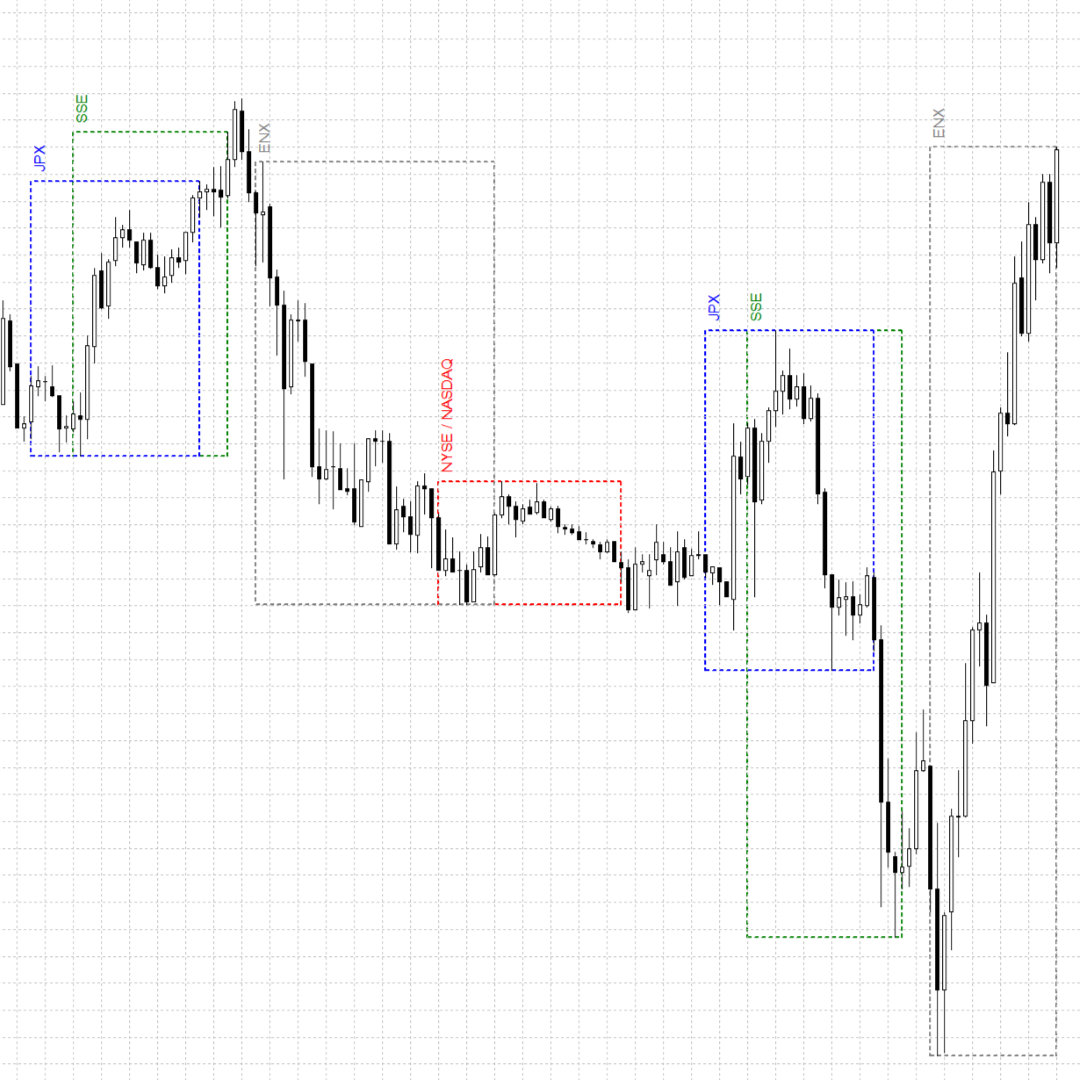
Trading Hours インジケーターは、チャート内の具体的な取引所の開始時間と終了時間を表すフレームを描画します。
入力:
- 入力パラメータ「UTC タイム ゾーン シフト」は、UTC からのユーザーのタイム ゾーン シフトを設定します。
- 他のパラメータは、フレームの表示/非表示、または色の設定に使用されます。
特徴:
- 具体的な取引所の開始時間と終了時間を表す枠をチャートに描画し、
- 選択した交換のフレームを表示/非表示にします。
- 選択した交換の色を設定します。
- 17 の最大の取引所をサポート、
- 1 日より短い期間のみをサポートします。
Market-Instruments によって開発されました