ASPCT Boom Crash Overloader

5

Good day!


I present to you a trading technical indicator for Deriv broker synthetic indices.

This indicator ONLY works with the following indices:

  • Boom 300 Index
  • Boom 500 Index
  • Boom 1000 Index
  • Crash 300 Index
  • Crash 500 Index
  • Crash 1000 Index

The indicator was created to give signals to open medium-term trades in the direction of Spikes. But you can open trades in the opposite direction to Spikes, at your own risk.

Trade only on M1. Other TFs do not guarantee the correct operation of the indicator.

The minimum deposit is $100 with minimum lots and trading only on 500 and 1000 indices.

How the indicator works:

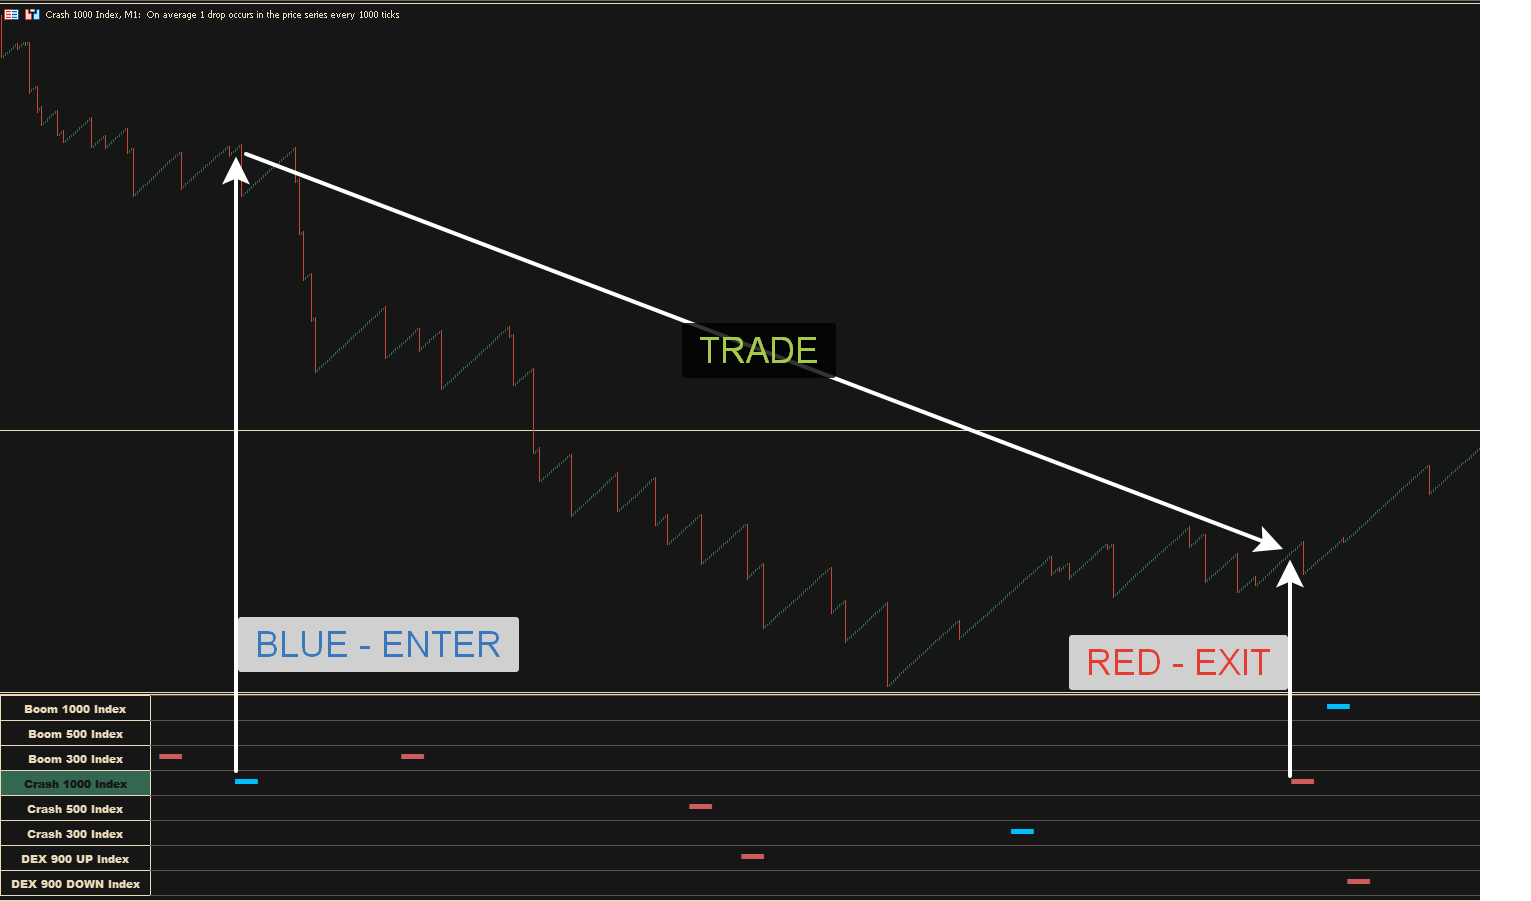
  • The indicator displays 8 lines, each of which corresponds to a specific index symbol.
  • Each of the lines displays one of three colors, depending on the signal of the indicator.
  • The blue line means a signal to open a trading position in the direction of Spikes.
  • The red line means a signal to exit a trading position.
  • The indicator can generate several blue signals in a row, it is recommended to open additional trades on such signals
  • The indicator displays entry points for certain last bars, in   within the window size . This means that when updating the window or switching the chart, the previous entry points can be redrawn with some probability. And actual ones are drawn. This is normal since the indicator analyzes a certain number of bars within the chart window.

How to trade:

  • Place the indicator on one chart window.
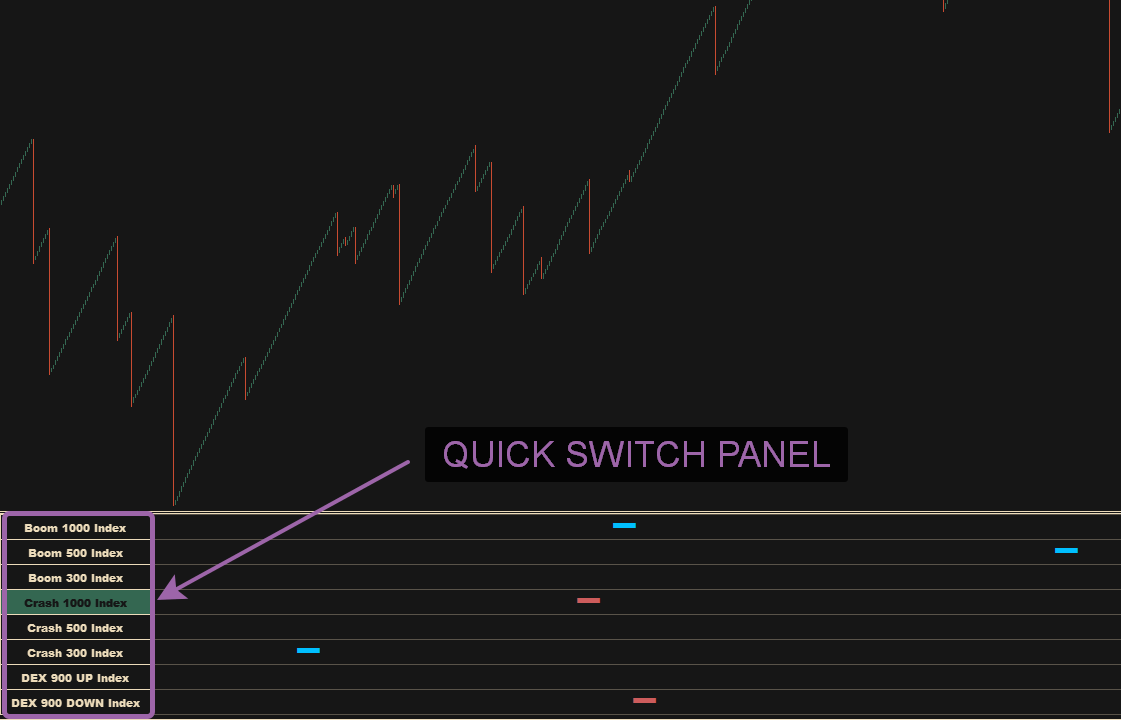
  • Watch the indication. If a green block appears, use the indicator symbol shortcut keys to move to the symbol in which the signal appeared, and open a position towards Spikes.
  • You can close a profitable trade at your own discretion, but the indicator provides for a more medium-term TP, which will be indicated on the indicator in red as soon as the time to close the position comes.
  • I recommend closing a losing trade when 20 losing candles are reached. Otherwise, you can close as you see fit. When developing the indicator, Stoploss was not used as unnecessary. Margin drawdown is possible.

Indicator parameters:

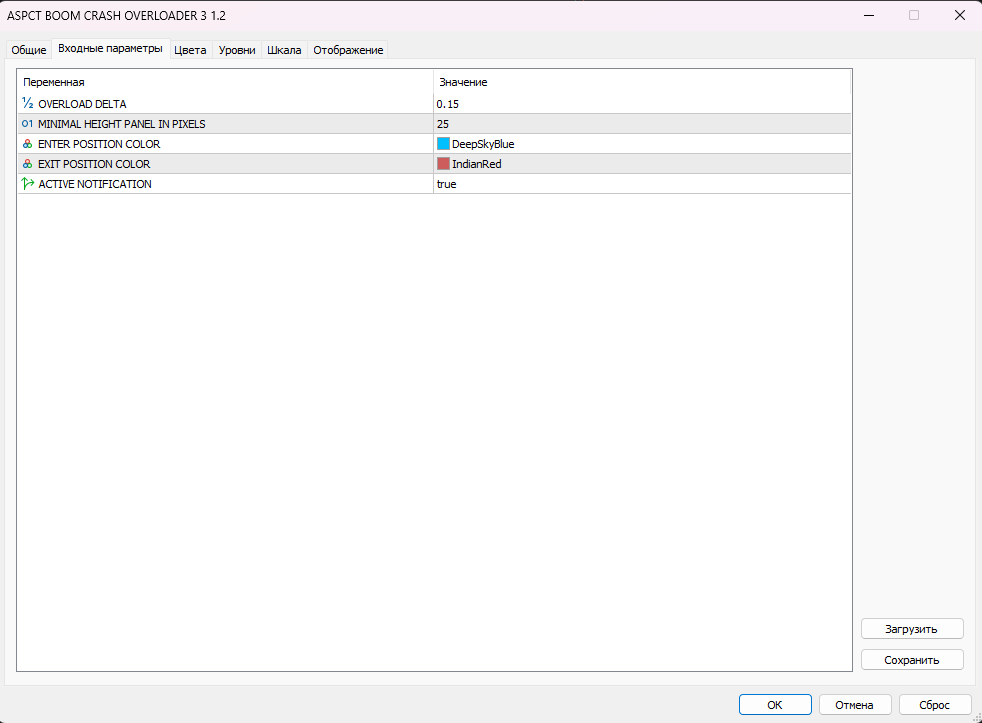
  • OVERLOAD LEVEL - Indicator overload level at which a signal appears. It is recommended to leave the default settings 0.15. By lowering this parameter, reduce the number of signals. By greatly increasing the number of signals, while reducing their quality.
  • PANEL HEIGHT - Minimum button height
  • COLORS - color settings for individual indicator elements.

Before buying an adviser, download the free version for testing in the strategy tester. The purchase decision must be made after thorough testing in the strategy tester.
Trading comes with risks. Choose the size of the lot that suits you. Use recommendations for minimum lot sizes.


レビュー 2
Paul Adeleke
549
Paul Adeleke 2023.08.19 22:42 
 

The author was helpful in clarifying to me the nature of this specific indicator. It is an extremely professional tool and one of the only real semi swing trading indicators that function on this market. Can't wait for it to be an EA.

おすすめのプロダクト
Alphabet AI MT5
Sergei Pomytkin
3.43 (7)
Alphabet AI は、平均回帰戦略を採用したアドバイザーです。これは、市場が大きな変動をした後、平均値に戻るという自然な性質を利用することを意味します。このアルゴリズムは、資産の現在の価格を常に分析し、計算された平均レベルと比較します。価格が平均値から大きく乖離すると、アドバイザーはこれを行動のシグナルと解釈します。上限を超えた場合は、価格の下落を期待してショートポジションを開き、下限を下回ると、上昇を期待してロングポジションを開きます。当社のアドバイザーの特徴は、チャネルの境界を決定し、誤ったシグナルをフィルタリングする適応型アプローチにあります。これにより、緩やかなトレンドの状況でも効果的に機能します。このアドバイザーは、価格チャネル内で顕著な変動を示す通貨ペアで特に優れたパフォーマンスを発揮します。 アドバイザーは 20 年以上にわたってデータに基づいてテストされており、その間、最も不安定な期間にも耐えることができます。 コンピュータを 24 時間 365 日稼働し続ける機会がない場合は、VPS サーバー サービスを使用することをお勧めします。 このアドバイザーは、ドロー
Quantum TrendPulse を ご紹介します。これは、   SuperTrend   、   RSI   、および Stochastic のパワーを 1 つの包括的なインジケーターに組み合わせて、取引の可能性を最大限に引き出す究極の取引ツールです。精度と効率を求めるトレーダー向けに設計されたこのインジケーターは、市場のトレンド、勢いの変化、最適なエントリー ポイントとエグジット ポイントを自信を持って特定するのに役立ちます。 主な特徴: SuperTrend 統合: 現在の市場動向に簡単に追従し、収益性の波に乗ることができます。 RSI精度: 買われすぎと売られすぎのレベルを検出し、市場の反転のタイミングに最適で、SuperTrendのフィルターとして使用されます。 確率的精度: 確率的振動を活用して、変動の激しい市場で隠れたチャンスを見つけます。SuperTrend のフィルターとして使用されます。 マルチタイムフレーム分析:   M5 から H1 または H4 まで、さまざまなタイムフレームで市場を常に把握します。 カスタマイズ可能なアラート: カスタム取引条件が満たされ
このインジケーターは実践的なトレードに最適な自動波動分析のインジケーターです! 場合... 注:   Tang Lun (Tang Zhong Shuo Zen) の命名規則の影響で、私は波のグレーディングに西洋の名前を使用することに慣れていません。基本的な波を ペン 、二次波のバンドを セグメント と名付けました。同時に、 セグメント にはトレンドの方向が指定されます (この命名方法は将来のノートで使用されます。最初に言っておきます)。ただし、アルゴリズムは曲がりくねった理論とはほとんど関係がないため、付けるべきではありません。これは、私の市場分析 によって要約された、絶えず変化する複雑な運用ルール を反映しています。 バンドは標準化され、人によって異なることがないよう定義されており、市場参入を厳密に分析する上で重要な役割を果たす人為的な干渉の描画方法が排除されています。 このインジケーターを使用することは、取引インターフェイスの美しさを改善することと同等であり、元の K ライン取引を放棄し、取引の新しいレベルに連れて行きます。また、宣伝の観点から顧客の認識も向上します。 イ
SPECIAL LAUNCH OFFER: $30 (1-Month Rent) Limited time offer to build our community and gather feedback! AmbM GOLD Institutional Scalper A high-precision M5 algorithm for XAUUSD (Gold) , engineered to trade exclusively at Institutional Liquidity Levels ($5/$10 psychological marks). PERFORMANCE DATA (BUY ONLY) • Win Rate: 87.09%. • Safe Growth: +$4,113 profit on $10k (13.75% Max Drawdown). • Extreme Stress Test: Successfully generated +$22,997 in a 5-year stress test (2020-2026), proving
Manyal trading system, CovEchoTrend Robot, focuses on reliability and flexibility. By employing statistical analysis methods to study the relationships between the base indicator and market patterns, the system enables a deeper understanding of market processes. Intelligent pattern analysis: The application of statistical data processing helps identify key trend reversal points more accurately, signaling significant market shifts. Informed decision-making is based on the intersection of indicato
"Blow It Up!" – The Trading Indicator That Questions Your Life Choices Tired of boring indicators? Meet your new market companion that delivers:   "YOLO BUY!" arrows   when you should probably panic   Explosive rectangle confetti   (because why not?)   200+ soul-crushing quotes   like   "Your stop loss is imaginary"   and   "This isn’t trading, it’s donating to whales"   Random alerts that roast your strategy This Indicator is like Therapy   – Because daytrading shouldn’t feel
Introduction to Fractal Pattern Scanner Fractal Indicator refers to the technical indicator that makes use of the fractal geometry found in the financial market. Fractal Pattern Scanner is the advanced Fractal Indicator that brings the latest trading technology after the extensive research and development work in the fractal geometry in the financial market. The most important feature in Fractal Pattern Scanner is the ability to measure the turning point probability as well as the trend probabil
Solar Prediction – Indicator for Market Price Analysis Solar Prediction is a tool designed to analyze market price movements. The indicator processes market dynamics and helps identify potential entry and exit points. Market data analysis without additional indicators Flexible application – works on different timeframes Ease of use – suitable for both beginners and experienced traders Adaptability to market conditions – tracks price movement changes Solar Prediction is a solution
The implementation of the Trend Turn trend indicator is simple - in the form of lines of two colors. The indicator algorithm is based on standard indicators as well as its own mathematical calculations. The indicator will help users determine the direction of the trend. It will also become an indispensable advisor for entering the market or closing a position. This indicator is recommended for everyone, both beginners and professionals. How to interpret information from the indicator. We sell
VertexAlgo
Krzysztof Sitko
5 (2)
VertexAlgo – Engineered for XAUUSD H1 Precision. Speed. Strategy. VertexAlgo is a sophisticated trading engine designed specifically for XAUUSD (Gold) on the H1 timeframe. The system focuses on market alignment rather than resistance, identifying high-probability entries based on institutional price action. Launch Information Current Price: $199 (Standard Price: $1099). Secure your license during the introductory phase. After purchasing, please contact me via MQL5 Private Message to receive the
ORB Displacement London Sweep Bias · NY Displacement · Order Block & FVG Zone Entry Signal "The market tells you its direction every single morning. Asian range. London sweep. NY displacement. You just need to know how to read it." What Is ORB Displacement? Every trading day follows the same institutional rhythm. The Asian session builds a quiet range. London opens and sweeps one side of it — taking out retail stops and building the liquidity needed for the real move. Then New York opens, displ
SMC Venom Model BPR インジケーターは、スマート マネー (SMC) コンセプトで取引するトレーダー向けのプロフェッショナル ツールです。価格チャート上の 2 つの主要なパターンを自動的に識別します。 FVG   (フェアバリューギャップ) は、3 本のローソク足の組み合わせで、最初のローソク足と 3 番目のローソク足の間にギャップがあります。ボリュームサポートのないレベル間のゾーンを形成し、価格修正につながることがよくあります。 BPR   (バランス価格範囲) は、2 つの FVG パターンの組み合わせで、「ブリッジ」を形成します。これは、価格がボリュームアクティビティの少ない動きで動くときに、ブレイクアウトしてレベルに戻るゾーンで、ローソク足の間にギャップを作成します。 これらのパターンは、大規模な市場プレーヤーと一般参加者の相互作用が発生するチャート上のボリュームと価格動向の分析に基づいて、トレーダーが主要なサポート/レジスタンス レベル、ブレイクアウト ゾーン、エントリ ポイントを識別するのに役立ちます。 インジケーターは、長方形と矢印の形でパターンを視覚
SURMAchannelPROは、動的な価格チャネルと明確なトレンドフォロー信号を生成するプレミアム多機能インジケーターです。滑らかなハル移動平均線(HMA)を中核とし、その周囲に動的なサポートとレジスタンスとして機能する複数のチャネルライン(内側、中間、外側)を構築します。インジケーターはチャネルのブレイクアウト/再エントリー時に視覚的な買い/売りの矢印を表示し、ユーザー定義のチャネル幅のパーセンテージに基づいて、Take Profit(TP)とStop Loss(SL)の水平線を自動的に引きます。主な特徴は、設定された履歴期間内の過去すべての信号のパフォーマンス(合計数、T/P、S/L、利益、損失)を追跡する統合統計パネルです。また、次のバーまでのリアルタイムカウントダウンタイマーも含まれます。 主な特徴: 動的マルチラインチャネル:   主要な上限/下限バンドと、市場構造を精密に分析するためのフィボナッチベースの中間線を生成します。 自動信号とバックテスト:   価格とチャネルの相互作用に基づいて買い(緑)と売り(ピンク)の矢印をプロットします。信号のパフォーマンスの完全な履歴記
Range Directional Force Indicator – Designed for You to Optimize! The Range Directional Force Indicator is a cutting-edge tool designed to empower traders by visualizing market dynamics and directional strength. Built to offer insights into market trends and reversals, this indicator is an invaluable asset for traders seeking precision in their strategies. However, it is important to note that this indicator is not optimized, leaving room for you to tailor it to your unique trading preferences.
VWAP indicator for MT5
Renaud Herve Francois Candel
Moving VWAP Indicator Moving VWAP is an important indicator drawing the Volume-Weighted Average Price (VWAP). The VWAP is a reference used by institutional traders and acts as a level of support / resistance. If price is above VWAP then means market is bullish. If price is below VWAP then means market is bearish. It can be used to enter in the market with low risk (near VWAP) and also identify the correct direction of the market. The Moving VWAP is as simple as a Simple Moving Average. The m
ZenTrend — Adaptive Trend Indicator for MetaTrader 5 ZenTrend is an innovative trend indicator for MetaTrader 5 that plots a flexible and informative trend line on the chart, based on adaptive moving average calculations. This tool is ideal for traders seeking precise and timely identification of trend direction on any financial market: forex, stocks, indices, cryptocurrencies, and commodities. Key Features of ZenTrend 1. Four Types of Moving Averages Supported ZenTrend allows you to choose fro
BinaWin NoTouch
Juan Fernando Urrego Alvarez
BinaWin NoTouch is an indicator that sends an alert signal when the trade is in the right position to wait for the breakdown of a side market. It is specially designed to trade under the “No Touch” strategy of the Binary.Com platform with synthetic indexes N.10, N.25, N.50, N.75 and N.100 Similarly, trading can be done with the conventional CALL and PUT strategy of any Binary Options platform. Requirements to use the indicator: 1. Have an account at Binary.Com 2. Configure the Binary.Com d
FREE
The indicator is a line right at yesterday's closing price. With the indicator, there is no need for adding or deleting previous day close lines each new day. T he line gives you an instant visual reference point for support, resistance, and market sentiment.   Whether you are day trading or swing trading, this line helps you quickly gauge where the market closed last session and how current price action relates to that level. It works seamlessly across all timeframes - from 1-minute charts to d
FREE
Caicai L&S Yield Histogram Important Notice: This indicator is an integral tool of the automated EA Caicai Long and Short Pair Trading . This indicator visually displays the percentage deviation (Yield %) of a pair's current spread relative to its own historical mean. It is an excellent tool for quickly visualizing the gross financial potential of a market distortion in Long & Short operations. Main Features: Percentage Visualization: Understand the size of the distortion in palpable percentage
Liquidity Map  Overview The Liquidity Map indicator is an advanced visualization tool based on ICT Smart Money Concepts . It automatically identifies daily Buy Zones , Sell Zones , and Liquidity Levels , showing where price is likely to reverse or continue based on institutional order flow. It calculates key levels from the daily session — such as the previous day’s high, low, and midpoint — then derives a premium (sell bias) and discount (buy bias) structure. When price trades into these mapped
Optimized Spike Detector Pro for MT5 is a professional-grade technical indicator designed to identify and capitalize on sharp, impulsive price movements (spikes) in any financial instrument. Utilizing a sophisticated, multi-algorithmic core, it distinguishes significant volatility expansions from market noise with exceptional accuracy. The tool dynamically adapts to changing market conditions, filtering out false signals and highlighting only high-probability spike setups in real-time. Featuring
CS Bollinger – ボリンジャーバンドをベースにしたシグナルインジケーターであり、主要なサポートおよびレジスタンスの水準を迅速に特定し、視覚的なトレードシグナルを提供します。レベル切替えの改良されたロジックにより、インジケーターはチャート上で自動的にレベルを調整し、価格の反転が確認されるとシグナル矢印を表示します。これにより、トレーダーは市場へのエントリーおよびエグジットに最適なタイミングを素早く見つけることができます。柔軟な設定により個々のトレード戦略に合わせて調整可能であり、初心者から経験豊富なトレーダーまで幅広く対応しています。 パラメータ デフォルト値 説明 BollingerPeriod 5 ボリンジャーバンドの計算期間。平均値を計算するためのバーの数を指定します。 BollingerDeviation 5 バンドの上限および下限ラインを計算するための偏差係数 CheckZeroBar false シグナル生成時に最新バー(ゼロバー)をチェックするかどうか ColorResistance clrDeepPink 上から下への反転レベルを示すレ
Impulse fractals indicator - is counter-trend oriented complex market fractal pattern.  Market creates bull/bear impulse, trend starts, fractals on impulsed wave are an agressive pullback signals. Buy arrow is plotted when market is bearish and it's impulse showed up-side fractal, and sell arrow is plotted when market is bullish and it's impulse showed dn-side fractal. Main indicator's adjustable inputs : impulsePeriod - main period of impulse histogram  filterPeriod  - smoothes impulse accordi
️ UZ Consistency Edge – The Ultimate Prop Firm Guardian & Auditor Pass Your Challenge. Keep Your Funded Account. Prove Your Consistency. UZ Consistency Edge is not just a dashboard; it is a complete institutional-grade auditing suite designed for serious traders. Whether you are attempting a Prop Firm challenge (FTMO, MyForexFunds, etc.) or managing live capital, this utility acts as your personal Risk Manager, ensuring you stay within the rules and trade with professional consistency. Unlike
Introducing the Bollinger Flipper Indicator – Your Ultimate Trading Edge!   Are you tired of second-guessing your entries and exits? The Bollinger Flipper Indicator is here to flip the game in your favor.   Built with the power of Bollinger Bands + Level 3 Power System + ZigZag Fractals, this advanced tool is designed to spot high-probability buy & sell signals with precision. SPECIAL BONUS (VALID TILL JUNE 2026)- OUR DAILY SCALPER EA for BTCUSD and VIX75 •································
Rule Plotter Expert
Francisco Gomes Da Silva
5 (3)
この専門家アドバイザーは、 Rule Plotter インジケーター内で作成された戦略をテストおよび実行するために設計されています。 使用方法: Rule Plotter - プログラミング不要のトレードシステムを作成するツール を無料でダウンロードしてください。 次に、Rule Plotter インジケーターで戦略を開発してください。 最後に、この専門家アドバイザーを使用して作成した戦略を実行してください。 パラメータ: Strategy : Rule Plotter インジケーター内で作成したトレードシステムです。 Lot: 取引量。0に設定すると、専門家アドバイザーは最小取引量で取引します。 Take: 利益を取るティック数。0に設定すると、取引に利益を取らないことを意味します。 Stop: 損失を止めるティック数。0に設定すると、取引に損失を止めないことを意味します。 Magic ID: このパラメータを使用すると、同じアセットでこの専門家アドバイザーの複数のバージョンを実行でき、Magic ID番号だけを変更すればよくなります。 新しいプロジェクトを公開したときに通知を受ける
Goldtheoryfx V8 - Institutional XAUUSD Algorithm The Goldtheoryfx V8 is a specialized, fully automated trading system developed exclusively for Gold (XAUUSD) on the M5 timeframe. Built upon years of manual trading experience and order flow analysis, this algorithm utilizes a sophisticated blend of Trend Alignment and Smart Money Concepts (SMC) to target high-probability market entries. Core Trading Logic: The V8 does not execute trades blindly. It filters every potential entry through a 200-per
Linha PCM Fimathe
Anderson Maicon De Vargas Odorcik
Manual de Instalação e Configuração Para que você tenha a melhor experiência profissional, siga estes passos simples para preparar o seu terminal: 1. Ativação no Terminal (Ajuste de Segurança) Antes de começar, precisamos garantir que o MetaTrader permita que você manipule a ferramenta livremente: Pressione Ctrl + O para abrir as Opções . Vá na aba Gráficos . Marque a opção: "Selecionar objetos com um clique do mouse" . Isso permitirá que você ajuste a régua de medição de forma instantânea. 2. V
Slow RSI
Flavio Javier Jarabeck
4.8 (5)
For those who feel that regular RSI is too fast and too noisy to be used on regular trades or in EAs and want to have an alternative to meter the Momentum of the Price, here is a solution presented on the great article of the Technical Analysis of Stocks & Commodities magazine (April, 2015), by Vitali Apirine, called: Slow Relative Strenght Index . Its reading is almost the same as the regular RSI, but its levels of Overbought and Oversold are 80 and 20 instead. SRSI is very powerful to show div
FREE
Smart Money Structure & Precision Trading Indicator (MT5) Smart Money Structure & Precision Trading Indicator  is a powerful Smart Money Concepts (SMC) indicator for MetaTrader 5, designed to help traders identify high-probability entries with institutional logic . This indicator automatically detects market structure in real time , highlights key liquidity levels , and provides clear, non-repainting signals so you can trade with confidence and precision. Whether you are a scalper, day trader, o
このプロダクトを購入した人は以下も購入しています
SignalTech MT5 is a trading system for EURUSD, USDCHF, USDJPY, AUDUSD, NZDUSD, EURJPY, AUDJPY, NZDJPY, CADJPY H2 and H3 Timeframe.  It can generate signals with Buy/Sell Arrows and Pop-Up/Sound Alerts. Each signal has clear Entry and Stop Loss levels, which should be automatically flagged on the chart, as well as potential Targets 1, 2, and 3. The Entry and TP levels are fixed after the trade is taken. The exit level is dynamic. If there are signs of a potential short-term trend reversal, the
Azimuth Pro
Ottaviano De Cicco
5 (7)
Azimuth Pro V2:MT5向けシンセティック・フラクタル構造分析と確認済みエントリー 概要 Azimuth Pro は Merkava Labs によるマルチレベルスイング構造インジケーターです。4つのネストされたスイングレイヤー、スイングアンカーVWAP、ABCパターン検出、3タイムフレーム構造フィルタリング、そして確定バーでの確認済みエントリー — 1つのチャートで、ミクロスイングからマクロサイクルまでを網羅するワークフロー。 これはブラインドシグナル製品ではありません。ロケーション、コンテキスト、タイミングを重視するトレーダーのための構造ファーストワークフローです。 V2発売記念オファー — Azimuth Pro V2をUSD 399で(次の100本)。最終価格:USD 499。 1. V2での変更点 シンセティック・マルチタイムフレームエンジン 上位タイムフレーム分析をMeridian Proと同じ独自のシンセティックアーキテクチャで一から再構築。よりクリーンなHTFコンテキスト、安定したライブ動作、従来のMTF同期問題なし。シンセティックエンジンは 固定比率タ
マーケットメーカーのためのツール。 Meravith は次の機能を提供します: すべての時間足を分析し、現在有効なトレンドを表示します。 強気と弱気の出来高が等しくなる流動性ゾーン(出来高均衡)を強調表示します。 異なる時間足のすべての流動性レベルをチャート上に直接表示します。 テキスト形式の市場分析を生成し、参考情報として表示します。 現在のトレンドに基づいて目標値、サポートレベル、ストップロスを計算します。 取引のリスクリワード比を算出します。 口座残高に基づいてポジションサイズを計算し、潜在的な利益を推定します。 また、市場に大きな変化があった場合には警告を表示します。 インジケーターの主要ライン: 強気/弱気の出来高エグゾーストライン ― 目標値として機能します。 市場のトレンドを示すライン。市場が強気か弱気かによって色が変わり、トレンドのサポートとして機能します。主にその色が市場センチメントを示します。 出来高均衡ライン(Eq)。Eq(Volume Equilibrium)ラインはシステムの中核です。これは買い手と売り手の出来高のバランスポイントを表します。市場の流動性を示し
OmniSync Projection
Antonio-alin Teculescu
5 (1)
Chronos Fractal Engine is an innovative price projection indicator for MetaTrader 5, designed to transform your technical analysis by intelligently identifying and projecting historical price patterns. Built upon an advanced correlation algorithm and the fractal principles of the market, this powerful tool visualizes potential future price movements, giving you a unique edge in your trading decisions. What is Chronos Fractal Engine? At its core, the Chronos Fractal Engine employs a sophisticat
RelicusRoad Pro: 定量的市場オペレーティングシステム 【期間限定】無制限アクセス 70% OFF - 2,000人超のトレーダーと共に なぜ多くのトレーダーは「完璧な」インジケーターを使っても失敗するのでしょうか? それは、文脈を無視して 単一の概念 だけでトレードしているからです。文脈のないシグナルは単なるギャンブルです。勝ち続けるには、 根拠の重なり(コンフルエンス) が必要です。 RelicusRoad Proは単なる矢印インジケーターではありません。完全な 定量的市場エコシステム です。独自のボラティリティモデリングを用いて、価格が推移する「適正価値の道(Fair Value Road)」をマッピングし、ノイズと真の構造的ブレイクを判別します。 推測はやめましょう。機関投資家レベルの「ロード・ロジック」でトレードを。 コアエンジン:「Road」アルゴリズム システムの中心となる Road Algo は、市場環境にリアルタイムで適応するダイナミックなボラティリティチャネルです。 安全ライン(平衡点) と、価格が数学的に反転しやすい 拡張レベル を投影します。 Si
ARICoin is a powerful trading companion designed to generate high-probability entry signals with dynamic TP/SL/DP levels based on volatility. Built-in performance tracking shows win/loss stats, PP1/PP2 hits, and success rates all updated live. Key Features: Buy/Sell signals with adaptive volatility bands Real-time TP/SL/DP levels based on ATR Built-in MA Filter with optional ATR/StdDev volatility Performance stats panel (Success, Profit/Loss, PP1/PP2) Alerts via popup, sound, push, or email Cust
「 Dynamic Scalper System MT5 」インジケーターは、トレンド波の中でスキャルピング取引を行う手法のために設計されています。 主要通貨ペアと金でテスト済みで、他の取引商品との互換性があります。 トレンドに沿った短期的なポジションオープンのシグナルを提供し、追加の価格変動サポートも提供します。 インジケーターの原理 大きな矢印はトレンドの方向を決定します。 トレンド波の中では、小さな矢印の形でスキャルピングシグナルを生成するアルゴリズムが機能します。 赤い矢印は強気方向、青い矢印は弱気方向です。 トレンドの方向には敏感な価格変動ラインが描かれ、小さな矢印のシグナルと連動します。 シグナルは次のように機能します。適切なタイミングでラインが現れるとエントリーシグナルが形成され、ラインが開いている間はポジションが保持され、完了すると取引が終了します。 推奨される動作時間枠はM1~H4です。 矢印は現在のローソク足に形成され、次のローソク足が開いている場合は、前のローソク足の矢印は再描画されません。 入力パラメータ Trend Wave Period - トレ
Presenting one-of-a-kind Gann Indicator for XAUUSD IQ Gold Gann Levels is a non-repainting, precision tool designed exclusively for XAUUSD/Gold intraday trading. It uses W.D. Gann’s square root method to plot real-time support and resistance levels, helping traders spot high-probability entries with confidence and clarity. William Delbert Gann (W.D. Gann) was an exceptional market analyst whose trading technique was based on a complex blend of mathematics, geometry, astrology, and ancient calcul
まず第一に、この取引ツールはノンリペイント、ノンリドロー、ノンラグの指標であり、プロの取引に理想的ですことを強調する価値があります。 オンラインコース、ユーザーマニュアル、デモ。 スマートプライスアクションコンセプトインジケーターは、新米から経験豊富なトレーダーまで、非常 に強力なツールです。Inner Circle Trader AnalysisやSmart Money Concepts Trading Strategiesなど、20以上の有用な指標を1つに組み合わせています。このインジケーターはスマートマネーコンセプトに焦点を当て、大手機関の取引方法を提供し、彼らの動きを予測するのに役立ちます。 特に、流動性分析に優れており、機関がどのように取引しているかを理解しやすくしています。市場のトレンドを予測し、価格の動きを慎重に分析するのに優れています。機関の戦略とトレードを合わせることで、市場の動向についてより正確な予測ができます。このインジケーターは多目的であり、市場構造を分析し、重要な注文ブロックを特定し、さまざまなパターンを認識するのに優れています。 このインジケーター
AriX
Temirlan Kdyrkhan
1 (4)
AriX Indicator for MT5 A powerful trend-following and signal-evaluation tool AriX is a custom MT5 indicator that combines Moving Averages and ATR-based risk/reward logic to generate clear buy/sell signals. It visualizes dynamic SL/TP levels, evaluates past trade outcomes, and displays win/loss statistics in a clean on-chart panel. Key features include: Buy/Sell signals based on MA crossovers ATR-based SL/TP1/TP2/TP3 levels with visual lines and labels Signal outcome tracking with real-time stat
多くの矢印インジケーターは、シグナルだけを表示して、その後の判断をすべてトレーダーに任せてしまいます。KT Alpha Hunter Arrows は、完整なトレードプランをチャート上に提示します。 各シグナル矢印が表示されるたびに、エントリーライン、ストップロス、4つのテイクプロフィット水準、そして現在の銘柄と時間足が今トレードに値するかどうかを示すリアルタイムのエッジ判定が、すでに描画された状態で表示されます。付属の Trade Manager EA は、あなたが手動でエントリーした後の実行管理を担当し、相場が荒れて判断がぶれやすい場面でも規律あるトレードを保ちやすくします。リペイントなし。確定足シグナルのみ。Forex、ゴールド、指数、その他あなたが取引するあらゆる銘柄に対応します。 主な機能 リペイントしない買い矢印と売り矢印を、足の確定後にのみ表示。 各シグナルに、エントリーライン、構造的ストップロス、4つのテイクプロフィット水準を表示。 Edge Dashboard が、現在のチャートで買いセットアップと売りセットアップを別々に評価。 判定システム:No Edge、Mar
Ultimate SMC Indicator
Hicham Mahmoud Almoustafa
1 (1)
Ultimate SMC Indicator v2.20 — Smart Money Concepts All-in-One Stop switching between 5 different indicators. Ultimate SMC gives you everything Smart Money traders need — in one clean indicator with interactive controls. GUIDE What makes this different? Most SMC indicators show you Order Blocks or FVGs separately. You still have to figure out which zones actually matter. Ultimate SMC does the hard work: it scans for Order Blocks, Fair Value Gaps, Liquidity Sweeps, Supply & Demand zones, Fibo
TPA True Price Action indicator reveals the true price action of the market makers through 100% non-repainting signals strictly at the close of a candle! TPA shows entries and re-entries, every time the bulls are definitely stronger than the bears and vice versa. Not to confuse with red/green candles. The shift of power gets confirmed at the earliest stage and is ONE exit strategy of several. There are available now two free parts of the TPA User Guide for our customers. The first "The Basics"
ZIVA Signal Intelligence
Hassan Abdullah Hassan Al Balushi
ZIVA Signal Intelligence An Adaptive, Modular Market Intelligence System ZIVA Signal Intelligence is not positioned as a conventional trading indicator. It is a fully integrated, proprietary market intelligence system engineered to deliver structured, high-precision interpretation of price behavior within a controlled analytical environment. Developed through an independent architectural approach, ZIVA does not rely on, derive from, or replicate existing indicators. It represents a standalone
Kalman Adaptive Zones — 量的確率バンド 価格がどこへ向かうのかを推測するのはやめましょう。統計的に「どこにあるべきか」を理解しましょう。 Kalman Adaptive Zones(KAZ)は、価格の周囲にインテリジェントな確率バンドを描画するプロフェッショナルな量的インジケーターです。これらのバンドは市場環境に応じてリアルタイムで自動適応します。 Bollinger Bands や Keltner Channels のような固定された過去期間に依存する指標とは異なり、KAZは複数層の量的分析を組み合わせ、現在の市場の状態をより正確に反映するバンドを生成します。 仕組み KAZの中核は適応型フィルターであり、ノイズを除去しながらも実際の価格変動には敏感に反応しつつ、真の基礎価格を継続的に推定します。 この中心線の周囲に、確率ゾーンが構築されます。その幅は2つの要因によって同時に決定されます: 市場の不確実性 :フィルターの信頼区間が広いほどゾーンは拡大 レジームの不安定性 :単なるボラティリティではなく、その変化自体の大きさ その結果、市場とともに「呼吸する」バ
このインジケーターは、市場で 関心が示されたゾーン をハイライトし、その後に 注文の蓄積ゾーン を表示します。 これは、大規模な**板情報(オーダーブック)**のように機能します。 これは、 巨大な資金 のためのインジケーターです。その性能は卓越しています。 市場にどんな関心が存在していても、 必ず目に見えるようになります 。 (これは 完全に再設計され、自動化されたバージョン です。もはや手動分析は必要ありません。) トランザクションスピード(取引速度) は新しい概念のインジケーターで、市場で大口注文が どこに・いつ 集中しているかを示し、それに基づいたチャンスを提供します。 トレンドの変化を 非常に早い段階 で察知することができます。 FXでは「出来高」と呼ばれているものは誤解されています。実際には、これは 時間あたりの価格変動量 です。したがって、正しい名称は トランザクションスピード です。 考え方・行動・分析の仕方すべてが問われます。 分析パラダイムの転換は非常に重要です。 このインジケーターは、FXにおける出来高の考え方を 根本から再定義 し、論理的な形で正確に活用する、
note: this indicator is for METATRADER4, if you want the version for METATRADER5 this is the link:  https://www.mql5.com/it/market/product/108106 TRENDMAESTRO ver 2.5 TRENDMAESTRO recognizes a new TREND from the start, he never makes mistakes. The certainty of identifying a new TREND is priceless. DESCRIPTION TRENDMAESTRO identifies a new TREND in the bud, this indicator examines the volatility, volumes and momentum to identify the moment in which there is an explosion of one or more of these da
Ziva LSE System
Hassan Abdullah Hassan Al Balushi
ZIVA LSE System A Professional Liquidity & Structure Execution Framework Executive Overview ZIVA LSE System is a professionally engineered analytical framework designed to interpret market behavior through structural logic and liquidity dynamics. It is not positioned as a conventional indicator. Rather, it functions as a structured execution environment that organizes price action into a clear, disciplined decision-making model. The system is built to deliver consistency, clarity, and controlled
IVISTscalp5
Vadym Zhukovskyi
5 (6)
iVISTscalp5 — 時間ベースの市場予測システム iVISTscalp5は一般的なインジケーターではありません。 MetaTrader 5向けの時間ベースの予測システムであり、 市場がいつ動く可能性が高いかを特定します。 ⸻ 特徴  • 正確なタイミング  • BUY / SELL予測  • 平均利益の可能性  • 週間予測  • 120以上の金融商品 ⸻ コンセプト 市場は価格だけでなく時間によっても動く ⸻ iVISTscalp5 — 時間による優位性 iVISTscalp5インジケーターをご紹介します。このインジケーターは、トレーディングにおいて独自でありながら効果的です。時間データに基づくこのインジケーターは、多年にわたる経験と金融市場の深い分析の結果です。iVISTscalp5インジケーターは、手動トレーディングにとって優れたツールです。便利さ、簡単さ、可視化 - すべての複雑さが内部に隠されています。私たちは、iVISTscalp5インジケーターの設定と使用を最大限に簡素化しました。このインジケーターは、MT5ターミナルにあるすべての金融商品
プレミアムレベルは、正しい予測の精度が80%を超える独自の指標です。 この指標は、最高のトレーディングスペシャリストによって2か月以上テストされています。 あなたが他のどこにも見つけられない作者の指標! スクリーンショットから、このツールの正確さを自分で確認できます。 1は、1キャンドルの有効期限を持つバイナリーオプションの取引に最適です。 2はすべての通貨ペア、株式、商品、暗号通貨で機能します 手順: 赤い矢印が表示されたらすぐにダウントレードを開き、青い矢印が表示されたら閉じます。青い矢印の後に開くこともできます。 試してテストしてください!推奨設定はデフォルトです! 日足チャートで最高の精度を示します! インディケータは、2600 Pipsの収益性に対して、約10Pipsという非常に小さなマージンを使用します。
SHOGUN Trade - 16年間無調整の衝撃。戦略的市場構造と損小利大の極意 スペシャルセール – 特別価格 (通常価格 $299)! この特別オファーは期間限定です。 私たちは現在、 さらなる製品開発と最適化 に注力しております。皆様からの貴重なフィードバックを製品に反映させるため、レビューへのご協力を条件にこの割引価格で提供させていただきます。皆様からいただくご意見は、次回のアップデートや新機能の追加に直接活用させていただきます。 ショーグントレードプロ ~「迷い」を断ち切り、将軍の視座を手に入れる。ダウ理論・市場構造分析スイート~ MT4版はこちらをクリックしてください https://www.mql5.com/ja/market/product/158467 1. はじめに:なぜ、多くのトレーダーは「森」で迷うのか? あなたは、目の前の1分足の値動きに翻弄され、感情的なエントリーで資金を減らしていませんか? 戦場で地図を持たずに走り回る兵士は生き残れません。生き残るのは、高台から戦況全体を俯瞰し、勝てる局面でのみ兵を動かす**「将軍(Commander)」**だけです。
Real Spread Monitor is a powerful indicator that is designed to accurately measure and analyze real spreads, giving traders the ability to compare trading conditions of different brokers. This product is also available for MetaTrader 4 =>  https://www.mql5.com/en/market/product/125769 Key Features of Real Spread Monitor: 1. Two modes of operation: Write mode : In this mode the indicator collects data on real spreads of the selected trading instrument and records them in a file. The spread is r
FX Analysis is an all-in-one MT5 indicator dashboard that combines eight analytical tools in a single panel, helping traders identify high-probability setups without switching between charts or indicators. Designed for standard forex pairs on MetaTrader 5. Best results on M15 - H4 timeframes when all components are used together as part of the included workflow. Components Volatility Analyzer Displays historical average movement by hour and by day of the week. A real-time Pip Balance shows the
MetaForecast M5
Vahidreza Heidar Gholami
5 (3)
MetaForecastは、価格データのハーモニクスに基づいて、どんな市場の未来を予測し視覚化します。市場が常に予測可能ではありませんが、価格にパターンがある場合、MetaForecastは可能な限り正確な未来を予測できます。他の類似製品と比較して、MetaForecastは市場のトレンドを分析することでより正確な結果を生成することができます。 入力パラメータ Past size (過去のサイズ) MetaForecastが将来の予測を生成するために使用するバーの数を指定します。モデルは選択したバー上に描かれた黄色の線で表されます。 Future size (将来のサイズ) 予測すべき将来のバーの数を指定します。予測された将来は、ピンクの線で表示され、その上に青い回帰線が描かれます。 Degree (程度) この入力は、MetaForecastが市場で行う分析のレベルを決定します。 Degree 説明  0 Degree 0の場合、価格の全てのピークや谷、そして詳細をカバーするために、「Past size」の入力に大きな値を使用することが推奨されています。  1 (推奨) Degre
Introduction to X3 Chart Pattern Scanner X3 Cherart Pattern Scanner is the non-repainting and non-lagging indicator detecting X3 chart patterns including Harmonic pattern, Elliott Wave pattern, X3 patterns, and Japanese Candlestick patterns. Historical patterns match with signal patterns. Hence, you can readily develop the solid trading strategy in your chart. More importantly, this superb pattern scanner can detect the optimal pattern of its kind. In addition, you can switch on and off individu
Weis Wave with Alert MT5
Trade The Volume Waves Single Member P.C.
4.94 (17)
Rental/Lifetime Package Options and Privileges  Rent Monthly Six Months   Yearly/Lifetime Weis Wave with Speed with Alert+Speed Index x x x Manual  x x x Quick Set up Video x x x Blog x x x Lifetime Updates x x x Setup and Training Material x x Discord Access Channel "The SI traders"          x Rectangle Break Alert Tool      x How to trade with it:    http://www.tradethevolumewaves.com   ** If you purchase please contact me to setup your  : Training Room and  complete manual access.  Wei
Rtc ML Ai | Predictor CORE MACHINE LEARNING ENGINE Adaptive ML Market Predictor – Multi-Bar Trend & Candle Forecast What This Indicator Does This indicator is a  real-time market prediction engine  designed to analyze price behavior and estimate  future market tendencies . Unlike conventional indicators, this system  does not rely on static parameters or historical curve-fitting , but adapts its internal state dynamically during live market operation. Instead of using static rules, the indic
SunSignal ML — AI Gold Signals with Multi-Timeframe Confluence SunSignal ML is an advanced AI-powered signal indicator purpose-built for XAUUSD gold trading. It combines a proprietary adaptive trend algorithm with six machine learning models trained on confirmed price pivots to produce high-confidence entry signals with multi-timeframe validation. The indicator runs efficiently on M1, M5 and M15 timeframes and is designed for traders who want precision entries guided by data rather than guesswor
ARIScalp is a powerful trading companion designed to generate high-probability entry signals with dynamic TP/SL/DP levels based on volatility. Built-in performance tracking shows win/loss stats, PP1/PP2 hits, and success rates all updated live. Key Features: Buy/Sell signals with adaptive volatility bands Real-time TP/SL/DP levels based on ATR Built-in MA Filter with optional ATR/StdDev volatility Performance stats panel (Success, Profit/Loss, PP1/PP2) Alerts via popup, sound, push, or email Cus
Ace Trend
Mikhail Sergeev
5 (3)
私たちはあなたにトレンド取引の世界でゲームのルールを変える革命的な指標を提示します。 指標は、パフォーマンスを再考し、前例のない高さにあなたの取引経験を高めるように設計されています。 私たちの指標は、競合他社とは一線を画す高度な機能のユニークな組み合わせを誇っています。 "実質の価格設定要因"の先端技術は最も困難で、揮発市況の最高の安定性を保障する。 不安定なパターン、壊れた指標に別れを告げ、意識的で制御された取引を歓迎します。 指標は単なる美しい絵ではありません! 指標は、トレーダーの側にオッズをシフトし、それによって利益を得る必要があります。 インジケータ信号(完全自動モード)に基づいて取引結果に慣れる: https://www.mql5.com/ja/signals/2339244 AceTrendは、rbtiバージョンによるトレンド指標のランキングで第一位にランクされています。AceTrend-取引における最大の収益性と制御。 私たちの指標は、歴史ではなく、現在の市場相場に基づいて収益性を強調しています。 革命に参加-あなたの取引経験の可能性のロックを解除! インジケーターは、
作者のその他のプロダクト
Indicator for Boom and Crash Synthetic Indices The indicator will be sold in a limited quantity. We present a specialized technical indicator designed exclusively for Boom and Crash synthetic indices offered by Deriv broker. This tool is tailored for traders who prefer a methodical approach to trading with clearly defined price levels. Indicator Functionality: • Displays key price levels for position entry • Indicates levels for position averaging • Determines optimal stop-loss levels
ASPCT Boom Crash Omniscope Description ASPCT Boom Crash Omniscope is a scalping indicator designed to analyze and visualize price movements on the Boom and Crash indices. The indicator tracks six different indices: Boom 1000, Boom 500, Boom 300, Crash 1000, Crash 500 and Crash 300. Peculiarities Display signals for six different Boom and Crash indices Using color indicators to indicate different market conditions Separate indicator window with buttons for quick switching between symbols Works ex
フィルタ:
Paul Adeleke
549
Paul Adeleke 2023.08.19 22:42 
 

The author was helpful in clarifying to me the nature of this specific indicator. It is an extremely professional tool and one of the only real semi swing trading indicators that function on this market. Can't wait for it to be an EA.

Petr Zharuk
1773
開発者からの返信 Petr Zharuk 2023.08.19 22:44
Good day! Thank you for your feedback. Work on the Expert Advisor for the indicator is planned for the near future.
oj2ad
497
oj2ad 2023.05.17 00:20 
 

ユーザーは評価に対して何もコメントを残しませんでした

Petr Zharuk
1773
開発者からの返信 Petr Zharuk 2023.05.17 00:59
Good time. Thank you for your feedback on my work. I will add a notification and update the interface.
レビューに返信