Key level order block MT5
- インディケータ
- バージョン: 1.0
- アクティベーション: 5

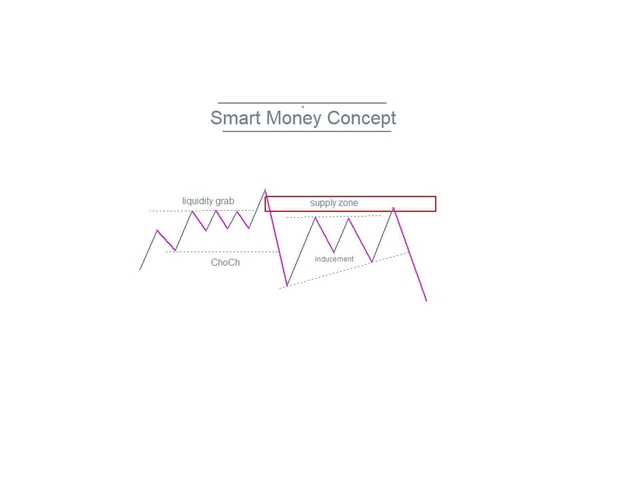
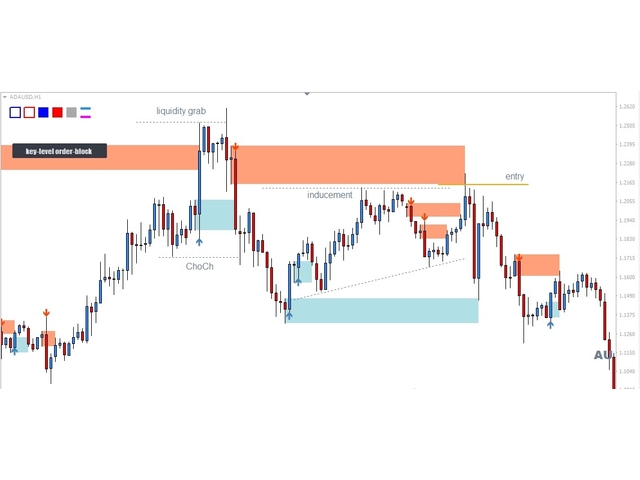
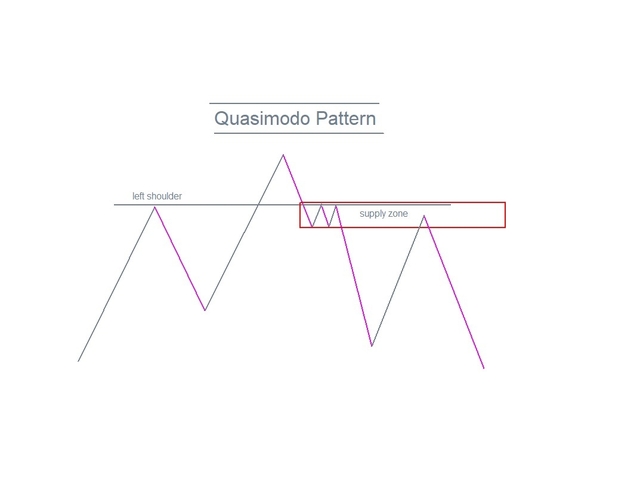
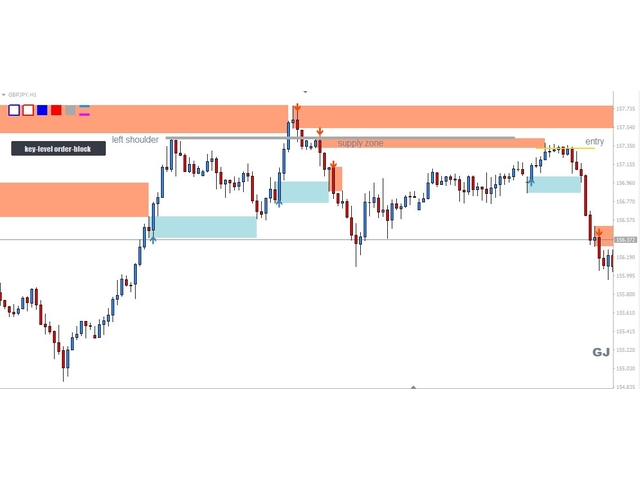
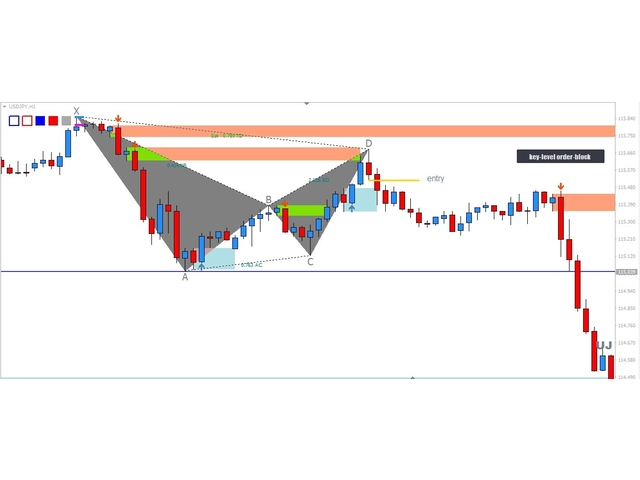
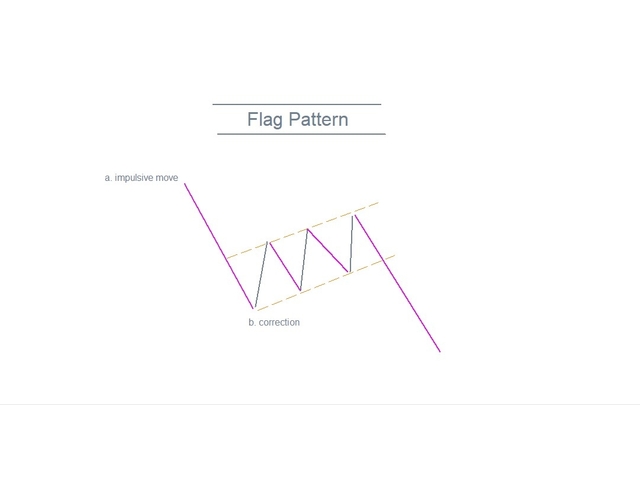
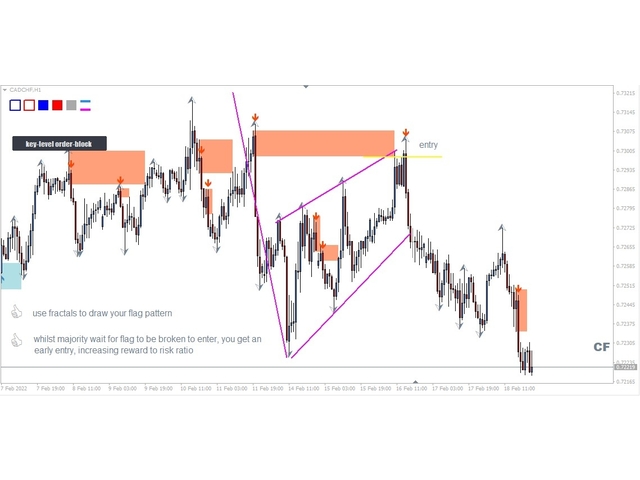
The key level order block indicator automatically draws order-blocks for you on the chart. The indicator compliments any strategy and can also be used as an independent tool. It can work with smart money concepts, harmonic patterns, supply and demand, flag patterns, Quasimodo strategy and many more.
Advantages
- The key level order block DOES NOT RE-PAINT, giving you confidence when a signal appears and also helps when looking back.
- The key level order block includes an on/off button on the chart to easily keep the charts clean after analysis by just one click.
- The key level order block works on all markets from stocks, indices to currency pairs aswell as crypto-currency.
- Trading is about taking high probability setups and the key level order block will give you an edge by providing an accurate point of interest (POI) and extra confluence to your setups no matter what strategy you use.
- Since the indicator automatically draws the order blocks for you, it gives a more mechanical approach to your analysis removing the emotion and subjectivity involved when personally drawing them.
- It works well with Volatility indices aswell from Deriv Broker including Boom, Crash, Volatity 75, Step index etc...
Recommendation
For best and most accurate results use the 4Hr and Daily timeframe or higher or as a confluence with another strategy. The screenshots and video will show examples of how it can be used along side different trading strategies. I highly recommend also purchasing the key level breaker block indicator https://www.mql5.com/en/market/product/81211?source=Site+Profile+Seller#description to use alongside, the advantage is when some order blocks fail, they then turn into breaker blocks which this indicator automatically draws, which might give you a second chance to recover a lost trade.

Any special settings apart from the default?