GannRS Trend Scalper
- インディケータ
- バージョン: 1.41
- アクティベーション: 10

GannRS Trend Scalper
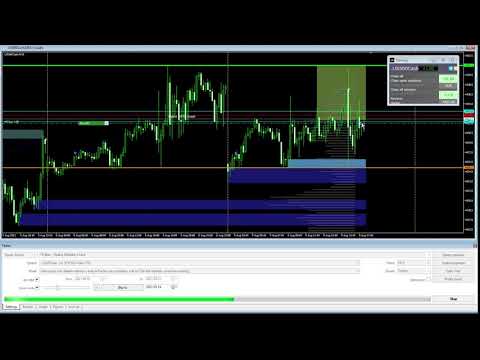
GannRS is an advanced trading tool based on Gann Law and Supports and Resistances.
- designed to have an active trading at any time
- not lagging
- Indications are given at the beginning of a new candle
Please watch the full tutorial video.
How to use GannRS
Very easy to set up...
- Put it on your chart
- Adjust inputs
Inputs
- Show Resistance and support: [bool]
- true = Shows R/S on chart
- false = does not show
- Show Levels:[bool]
- true = Shows levels on the chart
- false = does not show
- Max history in days: [Int] Max history for Levels (in days quantity)
- Level lines color: [color] Color of the lines from Level Magnet
- true = show histogram
- false= does not show
- Push Notifications: [bool] Enables Push Notifications
- true = Enable
- false = Disable
- Mail Notifications: [bool] Enables Mail Notifications
- true = Enable
- false = Disable
- Popup Notifications: [bool] Enables Popup window (Alert) on the main chart Notifications
- true = Enable
- false = Disable