Cross Entrance

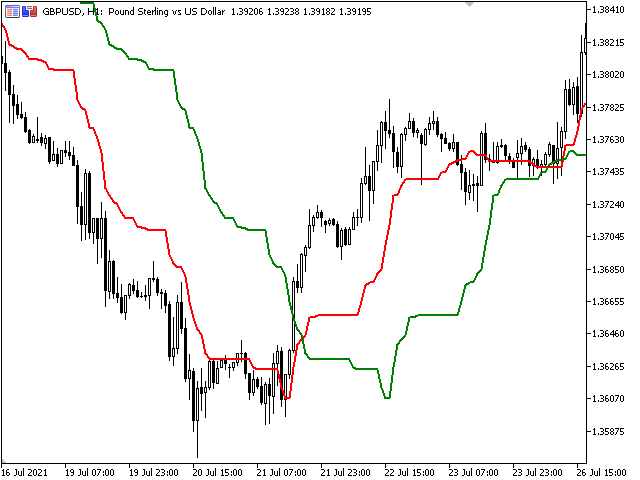
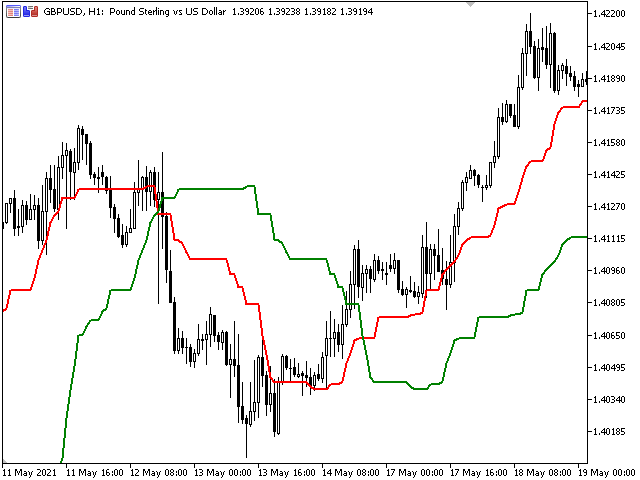
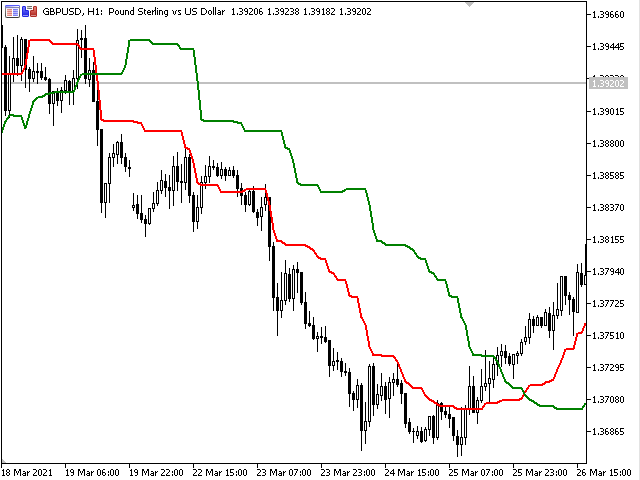
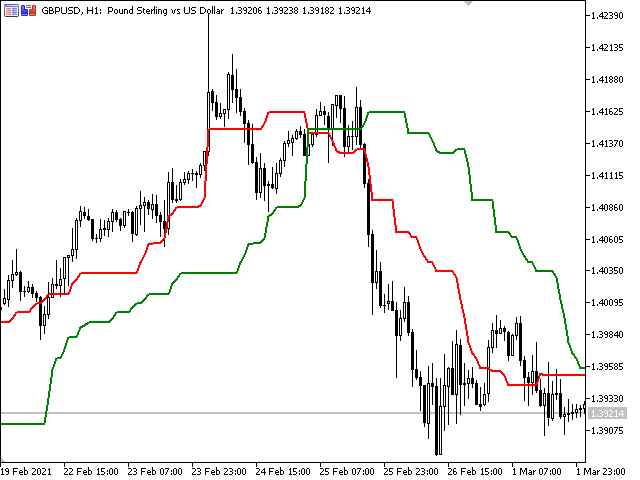
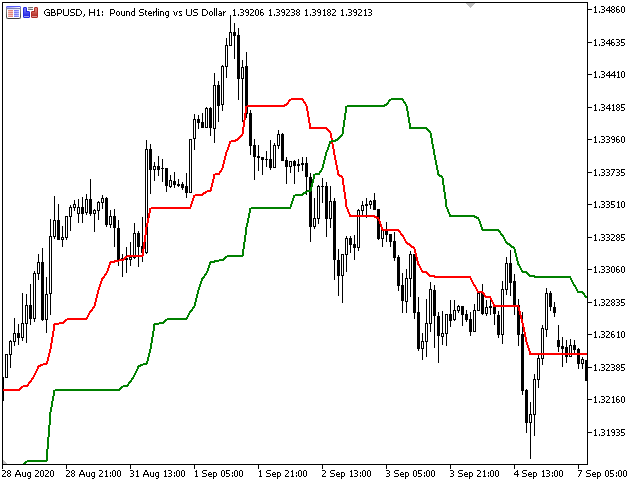
Cross Entrance technical indicator crossing points can be used as potential market reversal points. Thus, all intersection points will be optimal points at which the movement changes taking into account the indicator period.

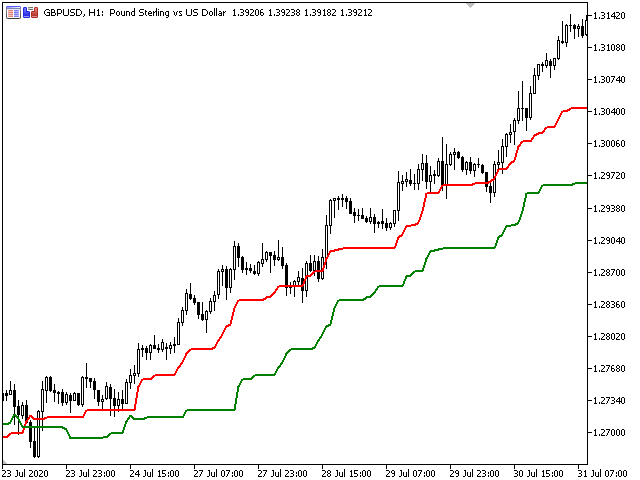
The advantage of this indicator is that it eliminates false signals during a sawtooth price movement and helps to maintain a position during a strong trend. When the trend changes, the Cross Entrance indicator uses line crossing indication. You can use the Cross Entrance indicator when entering the market, after its correction.

But do not forget that the approach must be complex, the indicator signals require additional information to enter the market.
おすすめのプロダクト
RBreaker Gold Indicatorsは、金先物の短期日内取引戦略であり、トレンドフォローと日内反転の2つの取引手法を組み合わせたものです。トレンド相場での利益を捉えるだけでなく、相場が反転した際には迅速に利確し、その流れに沿ってポジションを反転させることができます。 この戦略は、アメリカの雑誌『Futures Truth』において、15年連続で最も収益性の高い取引戦略トップ10に選ばれた実績を持ち、非常に長いライフサイクルを誇り、現在も国内外で広く使用・研究されています。 本インディケーターは、2026年の金先物の値動きに対応し、14日間のATR指標に基づいて、ブレイクアウト係数A、観察係数B、リバーサル係数Rをより合理的な値で定義しています。非常に優れたインディケーターであり、安定的な年間収益を実現しています。ぜひおすすめします〜
SMC Venom Model BPR インジケーターは、スマート マネー (SMC) コンセプトで取引するトレーダー向けのプロフェッショナル ツールです。価格チャート上の 2 つの主要なパターンを自動的に識別します。 FVG   (フェアバリューギャップ) は、3 本のローソク足の組み合わせで、最初のローソク足と 3 番目のローソク足の間にギャップがあります。ボリュームサポートのないレベル間のゾーンを形成し、価格修正につながることがよくあります。 BPR   (バランス価格範囲) は、2 つの FVG パターンの組み合わせで、「ブリッジ」を形成します。これは、価格がボリュームアクティビティの少ない動きで動くときに、ブレイクアウトしてレベルに戻るゾーンで、ローソク足の間にギャップを作成します。 これらのパターンは、大規模な市場プレーヤーと一般参加者の相互作用が発生するチャート上のボリュームと価格動向の分析に基づいて、トレーダーが主要なサポート/レジスタンス レベル、ブレイクアウト ゾーン、エントリ ポイントを識別するのに役立ちます。 インジケーターは、長方形と矢印の形でパターンを視覚
CosmiCLab SMC FIBO CosmiCLab SMC FIBO is a professional trading indicator designed for traders who use Smart Money Concepts (SMC), market structure analysis and Fibonacci retracement levels. The indicator automatically detects market swings and builds Fibonacci levels based on the latest impulse movement. It also identifies market structure changes such as BOS (Break of Structure) and CHOCH (Change of Character), helping traders understand the current market direction. CosmiCLab SMC FIBO also pr
これはほぼ間違いなく、MetaTraderプラットフォームで見つけることができる最も完全な調和価格形成自動認識インジケーターです。 19種類のパターンを検出し、フィボナッチプロジェクションをあなたと同じように真剣に受け止め、潜在的逆転ゾーン(PRZ)を表示し、適切なストップロスとテイクプロフィットレベルを見つけます。 [ インストールガイド | 更新ガイド | トラブルシューティング | よくある質問 | すべての製品 ] 19の異なる調和価格形成を検出します プライマリ、派生および補完フィボナッチ投影(PRZ)をプロットします 過去の価格行動を評価し、過去のすべてのパターンを表示します この指標は、独自の品質とパフォーマンスを分析します 適切なストップロスとテイクプロフィットのレベルを表示します ブレイクアウトを使用して適切な取引を通知します すべてのパターン比をグラフにプロットします 電子メール/音声/視覚アラートを実装します スコット・M・カーニーの本に着想を得て、この指標は最も純粋で急を要するトレーダーのニーズを満たすように設計されています。ただし、トレードを容易にする
Divergent Stochastic Filter II Catch Reversals Early, Filter Noise, Trade with Confidence The Edge: Why This Stochastic is Different  Every trader knows the Stochastic oscillator. But knowing when to trust its signals, that's the real challenge. The Divergent Stochastic Filter II transforms this classic indicator into a precision reversal detection system by adding critical elements: divergence intelligence, signal filtering and exhaustion detection.  While standard Stochastic oscillators fire s
PipFinite Exit EDGE MT5
Karlo Wilson Vendiola
4.88 (32)
Did You Have A Profitable Trade But Suddenly Reversed? In a solid strategy, exiting a trade is equally important as entering. Exit EDGE helps maximize your current trade profit and avoid turning winning trades to losers. Never Miss An Exit Signal Again Monitor all pairs and timeframes in just 1 chart www.mql5.com/en/blogs/post/726558 How To Trade You can close your open trades as soon as you receive a signal Close your Buy orders if you receive an Exit Buy Signal. Close your Sell orders if
Price Magnet — Price Density and Attraction Levels Indicator Price Magnet is a professional analytical tool designed to identify key support and resistance levels based on statistical Price Density. The indicator analyzes a specified historical period and detects price levels where the market spent the most time. These zones act as “magnets,” attracting price action or forming a structural base for potential reversals. Unlike traditional Volume Profile tools, Price Magnet focuses on price-time d
プレミアムレベルは、正しい予測の精度が80%を超える独自の指標です。 この指標は、最高のトレーディングスペシャリストによって2か月以上テストされています。 あなたが他のどこにも見つけられない作者の指標! スクリーンショットから、このツールの正確さを自分で確認できます。 1は、1キャンドルの有効期限を持つバイナリーオプションの取引に最適です。 2はすべての通貨ペア、株式、商品、暗号通貨で機能します 手順: 赤い矢印が表示されたらすぐにダウントレードを開き、青い矢印が表示されたら閉じます。青い矢印の後に開くこともできます。 試してテストしてください!推奨設定はデフォルトです! 日足チャートで最高の精度を示します! インディケータは、2600 Pipsの収益性に対して、約10Pipsという非常に小さなマージンを使用します。
Crypto_Forex インジケーター   PINBAR パターン MT5用。リペイントなし、遅延なし。 - インジケーター「PINBARパターン」は、プライスアクション取引に非常に強力なインジケーターです。 - インジケーターはチャート上のピンバーを検出します。 - 強気のピンバー - チャート上に青い矢印シグナルを表示します(画像参照)。 - 弱気のピンバー - チャート上に赤い矢印シグナルを表示します(画像参照)。 - PC およびモバイルのアラート付き 。 - インジケーター「PINBARパターン」は、サポート/レジスタンスレベルと組み合わせるのに最適です。 高品質のトレーディングロボットとインジケーターをご覧になるにはここをクリックしてください! これは、このMQL5ウェブサイトでのみ提供されるオリジナル製品です。
PR EA - Engulfing Pattern Trading System Automated Engulfing Pattern Detection with MA Confirmation The PR EA is a Meta Trader 5 expert advisor that identifies and trades bullish/bearish engulfing candlestick patterns when confirmed by a moving average filter. Designed for swing trading on 30-minute charts with compatibility for M15 and H1 time frames. Key Features: Pattern Recognition - Detects valid bullish/bearish engulfing candle formations Trend Confirmation - 238-period SMA filter
Auto Optimized RSI   は、正確な売買シグナルを提供するために設計された、使いやすいスマートな矢印インジケーターです。過去のデータを使ったトレードシミュレーションに基づき、各通貨ペアや時間足に最適なRSIの買い/売りレベルを自動で見つけ出します。 このインジケーターは、独立したトレードシステムとしても、既存の戦略の一部としても使用できます。特に短期トレーダーにとって便利なツールです。 従来のRSI(70/30など)の固定レベルとは異なり、 Auto Optimized RSI   はリアルな価格の動きとバックテスト結果に基づき、ダイナミックにレベルを調整します。勝率、ドローダウン、平均利益/損失といった重要な統計をモニターし、現在の市場に適応して、本当に機能するシグナルを提供します。 RSIが最適化されたレベルをクロスすると、チャート上に買い・売りの矢印が表示され、成功率の高いエントリーポイントを見つけるのに役立ちます。 ご購入後にご連絡いただければ、追加のツールや特別なトレードのヒントを無料でお渡しいたします! 皆様のトレードが成功しますように!
Noize Absorption Index - is the manual trading system that measures the difference of pressure between bears forces and bulls forces. Green line - is a noize free index that showing curent situation. Zero value of index shows totally choppy/flat market.Values above zero level shows how powerfull bullish wave is and values below zero measures bearish forces.Up arrow appears on bearish market when it's ready to reverse, dn arrow appears on weak bullish market, as a result of reverse expectation.
Chỉ báo này sẽ thông báo cho bạn nếu cấu hình xu hướng thành công. Tín hiệu theo xu hướng không nên được tăng theo, nhưng tín hiệu mua ở mức giá thấp theo mô hình giao dịch thông thường của bạn, hoặc tín hiệu bán ở mức giá tốt, là một lựa chọn rất tốt. Hãy thiết lập nó trên khung thời gian lớn hơn và theo dõi các khung thời gian nhỏ hơn, bám sát các xu hướng chính. Tôi thường thiết lập ba khung thời gian gần nhau nhất và không bao giờ đi ngược tín hiệu của INdicator này. INdicator   này không có
Fibo Daily Channel Indicator The  Indicator is a powerful tool for traders, providing precise daily support and resistance levels based on Fibonacci retracement and extension calculations. This indicator automatically draws key pivot points (PP, R1, R2, S1, S2) as well as additional extension levels (R3, R4, S3, S4), helping traders identify potential reversal and breakout zones with ease. It includes customizable alerts and push notifications, allowing traders to receive updates whenever the pr
Indicator Name: Fibaction – price action candle Detector Description: Fibo Signal Boxes is a powerful Smart Money Concept (SMC)-inspired indicator that auto-detects price action candles. bullish hammers and shooting stars, then draws precise Fibonacci entry zones and multiple take-profit levels directly on the chart. as for the SL personally i use 40 pips rules  Key Features: Detects bullish hammer and shooting star reversal candles. Automatically draws Fibonacci entry and TP boxes. as
Promotion $66 lifetime for you. The principle of this indicator is very simple: detecting the trend with Moving Average, then monitoring the return point of graph by using the crossing of Stochastic Oscillator and finally predicting BUY and SELL signal with arrows, alerts and notifications. The parameters are fixed and automatically calculated on each time frame. Example: If you install indicator on EURUSD, timeframe M5: the indicator will detect the main trend with the Moving Average on this ti
Your Trend Friend
Luigi Nunes Labigalini
5 (1)
The trend is your friend! Look at the color of the indicator and trade on that direction. It does not  repaint. After each candle is closed, that's the color of the trend. You can focus on shorter faster trends or major trends, just test what's most suitable for the symbol and timeframe you trade. Simply change the "Length" parameter and the indicator will automatically adapt. You can also change the color, thickness and style of the lines. Download and give it a try! There are big movements w
Awesome Oscillator by Bill Williams with the ability to fine-tune and replace the averaging algorithms of the indicator, which significantly expands the possibilities of using this oscillator in algorithmic trading and brings it closer in its properties to such an indicator as the MACD. To reduce price noise, the final indicator is processed with an additional Smooth averaging. The indicator has the ability to give alerts, send mail messages and push signals when the direction of movement of th
フラットとトレンドを決定するための指標。 価格が2つのヒストグラムと2つの線(赤と青)のいずれかを下回っている場合、これは売りゾーンです。 このバージョンのインジケーターを購入するときは、1つの実際のアカウントと1つのデモアカウント用のMT4バージョン-ギフトとして(受け取るには、プライベートメッセージを書いてください)! 価格が2つのヒストグラムと2つの線(赤と青)のいずれかを上回っている場合、これは購入ゾーンです。 MT4バージョン: https//www.mql5.com/en/market/product/3793 価格が2つの線の間、またはいずれかのヒストグラムのゾーンにある場合、市場に明確な傾向はありません。簡単に言えば、市場は横ばいです。 インジケーターの動作は、スクリーンショットでより明確に示されています。
The indicator is designed to help in making a decision on the direction of trading (buy or sell). It is a history scanner that searches for matches of the current pattern (combination of several current bars) with historical data in percentage terms by the relative vertical position of candles relative to each other, the size of each candle, the size of the candle body and the candle shadows. In history, the matches found are indicated by vertical lines on the candle of the beginning of the soug
The Swing High Low and Fibonacci Retracement Indicator is a powerful technical analysis tool designed to identify key price levels and potential reversal zones in the market. It automatically detects recent swing highs and swing lows on the chart and overlays Fibonacci retracement levels based on these points. This indicator helps traders: Visualize market structure by highlighting recent swing points. Identify support and resistance zones using Fibonacci ratios (e.g., 38.2%, 50%, 61.8%). Adapt
あなたの取引戦略の可能性をInventory Retracement Bar MT5で引き出しましょう。これはMetaTrader 5専用に設計された革新的なインジケーターです。この強力なツールは、現在のトレンドに対して45%以上の戻りを示すローソク足パターンを特定し、トレーダーが市場への最適な再エントリーポイントを見つけるのを助けます。 Inventory Retracement Bar MT5は、市場の勢いが再開される可能性が高いときに明確な視覚信号を提供することで、あなたの取引判断を向上させます。これは初心者と経験豊富なトレーダーの両方にとって貴重な資産です。forex、インデックス、商品、暗号通貨に最適なこのインジケーターは、遅延信号のリスクなしに戻りを利用することを可能にします。 MQL製品のインストールガイド | MT4/MT5で購入したMQL製品の更新 | 一般的なトラブルシューティングガイド | インジケーター設定 / ガイド 主な特徴 バッファ統合: インジケーターの値をアクセス可能なバッファとして公開し、Expert Advisorが自動信号ベースの取引を利用できる
このインジケータは、AB = CDリトレースメントパターンを検出します。 AB = CDリトレースメントパターンは、初期価格セグメントが部分的にリトレースされ、プルバックの完了から等距離の動きが続く4ポイントの価格構造であり、すべての調和パターンの基本的な基盤です。 [ インストールガイド | 更新ガイド | トラブルシューティング | よくある質問 | すべての製品 ] カスタマイズ可能なパターンサイズ カスタマイズ可能なACおよびBD比率 カスタマイズ可能なブレイクアウト期間 カスタマイズ可能な線、色、サイズ CD fiboレベルに基づいてSLおよびTPレベルを表示します パターンとブレイクアウトの視覚/音声/プッシュ/メールアラート AB = CDリトレースメントは、かなり拡大して再描画できます。物事を簡単にするために、このインディケーターはひねりを実装します。トレードをシグナルする前に、正しい方向へのドンチャンブレイクアウトを待ちます。最終結果は、非常に信頼性の高い取引シグナルを備えた再描画インジケーターです。ドンチャンのブレイクアウト期間が入力として入力されます。 強
This is an advanced multi-timeframe version of the popular Hull Moving Average (HMA) Features Two lines of the Hull indicator of different timeframes on the same chart. The HMA line of the higher timeframe defines the trend, and the HMA line of the current timeframe defines the short-term price movements. A graphical panel with HMA indicator data from all timeframes at the same time . If the HMA switched its direction on any timeframe, the panel displays a question or exclamation mark with a tex
The new update makes this indicator a complete tool for studying, analyzing and operating probabilistic patterns. It includes: On-chart Multi-asset percentage monitor. Configurable martingales. Twenty-one pre-configured patterns, including Mhi patterns and C3. An advanced pattern editor to store up to 5 custom patterns. Backtest mode to test results with loss reports. Trend filter. Hit operational filter. Martingale Cycles option. Various types of strategies and alerts. Confluence between patter
Your Pointer is no ordinary Forex channel. This corridor is built on the basis of the analysis of several candles, starting from the last one, as a result of which the extremes of the studied interval are determined. They are the ones who create the channel lines. Like all channels, it has a middle line as well as a high and low line. This channel is worth watching for its unusual behavior. The use of the Your Pointer indicator allows the trader to react in time to the price going beyond the bo
# DRAWDOWN INDICATOR V4.0 - The Essential Tool to Master Your Trading ## Transform Your Trading with a Complete Real-Time Performance Overview In the demanding world of Forex and CFD trading, **knowing your real-time performance** isn't a luxury—it's an **absolute necessity**. The **Drawdown Indicator V4.0** is much more than a simple indicator: it's your **professional dashboard** that gives you a clear, precise, and instant view of your trading account status. --- ## Why This Indicator
Description : Rainbow EA MT5 is a simple Expert advisor based on   Rainbow MT5 indicator witch is based on Moving average with period 34. The indicator is incorporated in the EA, therefore, it is not required for the EA to operate, but if you wish, you can download it from   my product page . The Expert Advisor settings are as follows : Suitable for Timeframes up to H1 The parameters below can be set according to your trading rules. StopLoss ( Stop Loss in pips) TakeProfit ( Take Profit in pips
ATrend
Zaha Feiz
4.82 (17)
ATrend: その仕組みと使い方 仕組み MT5プラットフォーム向けの「ATREND」インジケーターは、テクニカル分析手法の組み合わせを利用して、トレーダーに堅牢な買いと売りのシグナルを提供するように設計されています。このインジケーターは主に、ボラティリティ測定のために平均真の範囲(ATR)を活用し、潜在的な市場動向を特定するためのトレンド検出アルゴリズムを併用しています。 購入後にメッセージを残すと、特別なボーナスギフトが贈呈されます。 主な特徴: - ダイナミックなトレンド検出: インジケーターは市場トレンドを評価し、シグナルを適宜調整することで、トレーダーが優位な市場環境に合わせて戦略を立てるのを支援します。     - ボラティリティ測定: ATRを使用することで、インジケーターは最適なストップロス(SL)とテイクプロフィット(TP)レベルを決定するために不可欠な市場ボラティリティを測定します。 - シグナルの視覚化: インジケーターは、チャート上に買いと売りのシグナルを視覚的に表示することで、トレーダーの意思決定を強化します。 操作手順 入力とセッティング - TimeF
The Priority Argument indicator algorithm is based on standard indicators as well as its own mathematical calculations. The indicator will help users determine the direction of the trend. It will also become an irreplaceable advisor for entering the market or for closing a position. This indicator is recommended for everyone, both beginners and professionals. How to work: The implementation of the trend indicator is simple - in the form of lines of two colors. We buy when the indicator line c
このプロダクトを購入した人は以下も購入しています
Azimuth Pro
Ottaviano De Cicco
5 (6)
発売プロモーション Azimuth Proは先着100名様限定で 299ドル でご提供します。最終価格は 499ドル となります。 リテールとインスティテューショナルのエントリーの違いはインジケーターではなく、ロケーションにあります。 多くのトレーダーは、モメンタムを追いかけたり、遅行シグナルに反応して、任意の価格レベルでエントリーします。機関投資家は、需給が実際にシフトする構造的なレベルに価格が到達するのを待ちます。 Azimuth Proはこれらのレベルを自動的にマッピングします:スイングアンカーVWAP、マルチタイムフレーム構造ライン、高確率ロケーションにのみ出現するABCパターン。 Azimuth Proは、構造分析とインテリジェントな自動化の両方を求めるプロフェッショナルトレーダー向けに構築されています。 Azimuthが外科的精度で市場構造をマッピングする一方、Azimuth Proはインテリジェンスレイヤーを追加します:トレーディングスタイルの自動検出、スマート設定された移動平均線、20年のデータでバックテストされた最適化パラメータ。その結果、お使いの銘柄と
このインジケーターを購入された方には、以下の特典を 無料 で提供しています: 各トレードを自動で管理し、ストップロスとテイクプロフィットを設定し、戦略ルールに基づいてポジションを決済する補助ツール 「Bomber Utility」 様々な銘柄に合わせたインジケーターの設定ファイル(セットファイル) 「最小リスク」、「バランスリスク」、「待機戦略」 の3つのモードで使用できる Bomber Utility 用の設定ファイル このトレーディング戦略をすぐに導入・設定・開始できる ステップバイステップのビデオマニュアル ご注意: 上記の特典を受け取るには、MQL5のプライベートメッセージシステムを通じて販売者にご連絡ください。 オリジナルのカスタムインジケーター 「Divergence Bomber(ダイバージェンス・ボンバー)」 をご紹介します。これは、MACDのダイバージェンス(乖離)戦略に基づいた 「オールインワン」型のトレーディングシステム です。 このテクニカルインジケーターの主な目的は、価格とMACDインジケーターの間に発生するダイバージェンスを検出 し、将来の価格の動きを示す
Entry In The Zone and SMC Multi Timeframe is a real-time market analysis tool developed based on Smart Money Concepts (SMC). It is designed to analyze market structure, price direction, reversal points, and key zones across multiple timeframes in a systematic way. The system displays Points of Interest (POI) and real-time No Repaint signals, with instant alerts when price reaches key zones or when signals occur within those zones. It functions as both an Indicator and a Signal System (2-in-1), c
CGE Trading Suite
Carl Gustav Johan Ekstrom
5 (1)
CGE Trading Suite delivers the analytical edge typically reserved for professional trading desks. The platform integrates a full suite of analytical tools into one seamless workflow: dynamic grid mapping, liquidity behavior analysis, ECM, trend lines, MIDAS, trade cycles, and directional channel projections. Together, these provide a unified view of market structure and momentum. Directional clarity is further enhanced by the capital flow index, which measures currency basket strength to identif
RelicusRoad Pro: 定量的市場オペレーティングシステム 【期間限定】無制限アクセス 70% OFF - 2,000人超のトレーダーと共に なぜ多くのトレーダーは「完璧な」インジケーターを使っても失敗するのでしょうか? それは、文脈を無視して 単一の概念 だけでトレードしているからです。文脈のないシグナルは単なるギャンブルです。勝ち続けるには、 根拠の重なり(コンフルエンス) が必要です。 RelicusRoad Proは単なる矢印インジケーターではありません。完全な 定量的市場エコシステム です。独自のボラティリティモデリングを用いて、価格が推移する「適正価値の道(Fair Value Road)」をマッピングし、ノイズと真の構造的ブレイクを判別します。 推測はやめましょう。機関投資家レベルの「ロード・ロジック」でトレードを。 コアエンジン:「Road」アルゴリズム システムの中心となる Road Algo は、市場環境にリアルタイムで適応するダイナミックなボラティリティチャネルです。 安全ライン(平衡点) と、価格が数学的に反転しやすい 拡張レベル を投影します。 Si
このインジケーターを購入すると、プロ仕様のトレードマネージャーを無料で差し上げます。 まず第一に、このトレーディングシステムがノンリペイント、ノンリドロー、ノンラグのインジケーターであることを強調する価値がある。これにより、手動取引とロボット取引の両方に理想的なものになっています。 オンラインコース、マニュアル、プリセットのダウンロード。 「スマートトレンドトレーディングシステム MT5」は、新規および経験豊富なトレーダー向けにカスタマイズされた包括的なトレーディングソリューションです。10以上のプレミアムインジケーターを組み合わせ、7つ以上の堅実なトレーディング戦略を備えており、多様な市場状況に対応する多目的な選択肢となっています。 トレンドフォロー戦略:トレンドを効果的に乗り越えるための正確なエントリーとストップロス管理を提供します。 リバーサル戦略:潜在的なトレンドの反転を特定し、トレーダーがレンジ相場を活用できるようにします。 スキャルピング戦略:高速で正確なデイトレードおよび短期取引のために設計されています。 安定性:すべてのインジケーターはノンリペイント、ノンリドロー、ノ
FX Trend NG:次世代マルチマーケット・トレンドインテリジェンス 概要 FX Trend NG は、複数の時間足に対応したプロフェッショナル向けトレンド分析およびマーケット監視ツールです。 市場全体の構造を数秒で把握することができます。 複数のチャートを切り替える必要はありません。どの銘柄がトレンド中なのか、どこでモメンタムが弱まっているのか、そしてどの時間足で強い整合性があるのかを瞬時に確認できます。 ローンチ特別オファー – FX Trend NG を $30(6ヶ月) または $80 永久ライセンス でご利用いただけます。 すでに Stein Investments のユーザーですか? -> メッセージを送信 して、プライベートグループへアクセスしてください。 セットアップや詳細情報が必要ですか? -> Stein Investments 公式ページ をご覧ください。 1. FX Trend NG が他と異なる理由 3ステート・トレンドロジック ― Buy と Sell だけではない • 多くのインジケーターは Buy または Sell の2状態のみを表示します。
トレンド スクリーナー インジケーターでトレンド取引の力を解き放ちます。ファジー ロジックと複数通貨システムを活用した究極のトレンド取引ソリューションです。 ファジー ロジックを活用した革新的なトレンド インジケーターである Trend Screener を使用して、トレンド取引を向上させます。 これは、13 を超えるプレミアム ツールと機能、および 3 つの取引戦略を組み合わせた強力なトレンド追跡インジケーターであり、Metatrader をトレンド アナライザーにする多用途の選択肢となります。 期間限定オファー : トレンド スクリーナー インジケーターは、わずか 100 ドルで生涯ご利用いただけます。 (元の価格 50$ ) (オファー延長) Trend Screener の 100% 非再描画精度の揺るぎない精度を体験して、取引の決定が過去の価格変動の影響を受けないようにしてください。 マルチタイムフレームおよびマルチ通貨機能の多用途性を解放し、比類のない自信を持って外国為替、商品、暗号通貨、インデックスの世界を取引できるようにします。 Trend Screener の包括的な
Meridian Pro
Ottaviano De Cicco
5 (1)
Meridian Pro:MT5用プロフェッショナル・マルチタイムフレーム・トレンドマトリックス 概要 Meridian Pro は Merkava Labs が開発したマルチタイムフレーム・トレンドマトリックスで、方向性の状態、強度、モメンタムの状況、マトリックスの合意をひとつのコンパクトなパネルに集約します。ひとつのアダプティブエンジンがM1からW1まで一貫して適用されます。シンボルごとの調整は不要。インジケーターの積み重ねも不要。すべてのアセットとすべてのタイムフレームをカバーするひとつの構造化された読み取りです。 発売キャンペーン — Meridian Proを USD 99 (導入価格)で入手。通常価格:USD 149 。 1. Meridian Proが他と異なる理由 ひとつのエンジン、バラバラなインジケーターのダッシュボードではない 多くのMTFダッシュボードは、タイムフレームごとに生のインジケーター値を繰り返すだけです。Meridian Proはマトリックス全体でひとつのアダプティブ・トレンドエンジンを使用するため、パネルの各行が同じ構造化フレームワークから導出されます
まず第一に、この取引インジケーターは再描画されず、再描画されず、遅延しないことを強調する価値があります。これにより、手動取引とロボット取引の両方に理想的なものになります。 ユーザーマニュアル:設定、入力、戦略。 アトミックアナリストは、価格の強さとモメンタムを利用して市場でより良いエッジを見つけるためのPA価格アクションインジケーターです。ノイズや誤ったシグナルを除去し、取引ポテンシャルを高めるための高度なフィルターを備えています。複雑なインジケーターの複数のレイヤーを使用して、アトミックアナリストはチャートをスキャンし、複雑な数学的計算をシンプルなシグナルと色に変換します。これにより、どのような初心者トレーダーでも理解して使用し、一貫した取引の決定を行うことができます。 「アトミックアナリスト」は、新規および経験豊富なトレーダー向けにカスタマイズされた包括的な取引ソリューションです。プレミアムインジケーターとトップノッチの機能を1つの取引戦略に組み合わせ、すべてのタイプのトレーダーにとって汎用性のある選択肢にします。 デイリートレーディングとスキャルピング戦略:高速で正確なデイ
マーケットメーカーのためのツール。 Meravith は次の機能を提供します: すべての時間足を分析し、現在有効なトレンドを表示します。 強気と弱気の出来高が等しくなる流動性ゾーン(出来高均衡)を強調表示します。 異なる時間足のすべての流動性レベルをチャート上に直接表示します。 テキスト形式の市場分析を生成し、参考情報として表示します。 現在のトレンドに基づいて目標値、サポートレベル、ストップロスを計算します。 取引のリスクリワード比を算出します。 口座残高に基づいてポジションサイズを計算し、潜在的な利益を推定します。 また、市場に大きな変化があった場合には警告を表示します。 インジケーターの主要ライン: 強気/弱気の出来高エグゾーストライン ― 目標値として機能します。 市場のトレンドを示すライン。市場が強気か弱気かによって色が変わり、トレンドのサポートとして機能します。主にその色が市場センチメントを示します。 出来高均衡ライン(Eq)。Eq(Volume Equilibrium)ラインはシステムの中核です。これは買い手と売り手の出来高のバランスポイントを表します。市場の流動性を示し
OmniSync Projection
Antonio-alin Teculescu
5 (1)
Chronos Fractal Engine is an innovative price projection indicator for MetaTrader 5, designed to transform your technical analysis by intelligently identifying and projecting historical price patterns. Built upon an advanced correlation algorithm and the fractal principles of the market, this powerful tool visualizes potential future price movements, giving you a unique edge in your trading decisions. What is Chronos Fractal Engine? At its core, the Chronos Fractal Engine employs a sophisticat
Quantum TrendPulse を ご紹介します。これは、   SuperTrend   、   RSI   、および Stochastic のパワーを 1 つの包括的なインジケーターに組み合わせて、取引の可能性を最大限に引き出す究極の取引ツールです。精度と効率を求めるトレーダー向けに設計されたこのインジケーターは、市場のトレンド、勢いの変化、最適なエントリー ポイントとエグジット ポイントを自信を持って特定するのに役立ちます。 主な特徴: SuperTrend 統合: 現在の市場動向に簡単に追従し、収益性の波に乗ることができます。 RSI精度: 買われすぎと売られすぎのレベルを検出し、市場の反転のタイミングに最適で、SuperTrendのフィルターとして使用されます。 確率的精度: 確率的振動を活用して、変動の激しい市場で隠れたチャンスを見つけます。SuperTrend のフィルターとして使用されます。 マルチタイムフレーム分析:   M5 から H1 または H4 まで、さまざまなタイムフレームで市場を常に把握します。 カスタマイズ可能なアラート: カスタム取引条件が満たされ
Currency Strength Dashboard Pro MetaTrader 5 用の リアルタイム通貨強度分析プロフェッショナルダッシュボード 。 このインジケーターは、 8つの主要通貨 (EUR、USD、GBP、JPY、CHF、AUD、CAD、NZD)の強さを計算し、 28の通貨ペア を同時に複数の時間足で分析・表示します。 ダッシュボードにより、トレーダーは 市場全体の状況を一目で把握 でき、余計な計算や複数のチャートを切り替える必要がありません。 計算方法 このインジケーターは、 高度な数学的通貨強度分析手法 に基づいています。 これは、類似インジケーターで一般的に使用されている RSIベースの手法 と比較して、より正確で客観的です。 この方法は 28の通貨ペアすべての相互関係を同時に分析 し、市場における実際の力関係をよりクリーンで偏りのない形で表示します。 リアルタイムダッシュボード メインテーブルには 8つの通貨 の完全なデータが表示されます。 Rank(順位) — 通貨の総合強度による順位。 1(最も強い)〜8(最も弱い) 。 Strength(強度) — 現在
優れたテクニカルインジケーター「Grabber」をご紹介します。これは、すぐに使える「オールインワン」トレーディング戦略として機能します。 ひとつのコードに、市場のテクニカル分析ツール、取引シグナル(矢印)、アラート機能、プッシュ通知が強力に統合されています。 このインジケーターを購入された方には、以下の特典を無料で提供します: Grabberユーティリティ:オープンポジションを自動で管理するツール ステップバイステップのビデオマニュアル:インジケーターのインストール、設定、取引方法を解説 カスタムセットファイル:インジケーターをすばやく自動設定し、最大限の成果を出すための設定ファイル 他の戦略はもう忘れてください!Grabberだけが、あなたを新たなトレードの高みへと導いてくれるのです。 Grabber戦略の主な特徴: 推奨タイムフレーム:M5〜H4 対応通貨ペア・資産:どれでも使用可能ですが、私が実際に検証した以下を推奨します(GBPUSD、GBPCAD、GBPCHF、AUDCAD、AUDUSD、AUDSGD、AUDCHF、NZDUSD、NZDCAD、EURCAD、EURUSD、E
BTMM State Engine Pro is a MetaTrader 5 indicator for traders who use the Beat The Market Maker approach: Asian session context, kill zone timing, level progression, peak formation detection, and a multi-pair scanner from a single chart. It combines cycle state logic with a built-in scanner dashboard so you do not need the same tool on many charts at once. What it does Draws the Asian session range; session times can follow broker server offset or be set in inputs. Tracks level progression (L
FX Power: 通貨の強弱を分析して、より賢い取引を実現 概要 FX Power は主要通貨と金の実際の強弱をあらゆる市場状況で理解するための必須ツールです。強い通貨を買い、弱い通貨を売ることで、 FX Power は取引の意思決定を簡素化し、高い確率の取引機会を見出します。トレンドを追従する場合でも、極端なデルタ値を使用して反転を予測する場合でも、このツールはあなたの取引スタイルに完全に適応します。ただ取引するだけではなく、 FX Power で賢く取引をしましょう。 1. なぜ FX Power がトレーダーにとって非常に有益なのか 通貨と金のリアルタイム強弱分析 • FX Power は主要通貨と金の相対的な強弱を計算し、マーケットダイナミクスに関する明確な洞察を提供します。 • どの資産がリードしているか、または後れを取っているかを監視して、取引するペアを賢く選びましょう。 マルチタイムフレームの包括的なビュー • 短期、中期、長期のタイムフレームで通貨と金の強弱を追跡し、マーケットトレンドに基づいて取引戦略を調整できます。 • スキャルピングからスイングトレード
あなたのシンボルでどの戦略が実際に機能するか確認しましょう - リアルマネーをリスクにさらす前に。 Power Barは、あらゆるシンボルとあらゆるタイムフレームで 極端な価格バー を検出し、3つの異なるトレード戦略を即座にバックテストします。勝率、プロフィットファクター、損益を並べて比較できます。すべてが1つのインタラクティブなパネルに集約されています。 推測なし。カーブフィッティングなし。データだけです。 Power Barが特別な理由 ほとんどのインジケーターはシグナルを出すだけで、それが機能するかどうかは推測に任されます。Power Barはさらに先を行きます - すべてのシグナルを 3つの戦略 に対してテストし、統計を表示します。FlipFlop、Momentum、Reversalをワンクリックで切り替え、数値が即座に変化するのを確認できます。 FlipFlop - 常にポジションを保有。シグナルでエントリーし、反対シグナルでイグジット。当社のリサーチでは、US30、US500、DAXなどのトレンドのあるインデックスで最も効果的です。 Momentum - シグナルの方向に
ご紹介     Quantum Breakout PRO は 、ブレイクアウト ゾーンの取引方法を変革する画期的な MQL5 インジケーターです。 13年以上の取引経験を持つ経験豊富なトレーダーのチームによって開発されました。     クォンタム ブレイクアウト プロ   は、革新的でダイナミックなブレイクアウト ゾーン戦略により、あなたのトレーディングの旅を新たな高みに押し上げるように設計されています。 クォンタム ブレイクアウト インジケーターは、5 つの利益ターゲット ゾーンを備えたブレイクアウト ゾーン上のシグナル矢印と、ブレイクアウト ボックスに基づいたストップロスの提案を提供します。 初心者トレーダーにもプロのトレーダーにも適しています。 量子EAチャネル:       ここをクリック 重要!購入後、インストールマニュアルを受け取るためにプライベートメッセージを送ってください。 推奨事項: 時間枠: M15 通貨ペア: GBPJPY、EURJPY、USDJPY、NZDUSD、XAUUSD アカウントの種類: ECN、Raw、またはスプレッドが非常に低い R
ARICoin is a powerful trading companion designed to generate high-probability entry signals with dynamic TP/SL/DP levels based on volatility. Built-in performance tracking shows win/loss stats, PP1/PP2 hits, and success rates all updated live. Key Features: Buy/Sell signals with adaptive volatility bands Real-time TP/SL/DP levels based on ATR Built-in MA Filter with optional ATR/StdDev volatility Performance stats panel (Success, Profit/Loss, PP1/PP2) Alerts via popup, sound, push, or email Cust
Bill Williams Advanced is designed for automatic chart analysis using Bill Williams' "Profitunity" system. The indicator analyzes four timeframes at once. Manual (Be sure to read before purchasing) Advantages 1. Analyzes the chart using Bill Williams' "Profitunity" system. Signals are displayed in a table in the corner of the screen and on the price chart. 2. Finds all known AO and AC signals, as well as zone signals. Equipped with a trend filter based on the Alligator. 3. Finds "Divergence Bar
このインジケーターは、反転ポイントと価格戻りゾーンを正確に表示します。     主要プレーヤー 。新たなトレンドが形成される場所を把握し、最大限の精度で意思決定を行い、すべての取引をコントロールします。 TREND LINES PRO インジケーターと組み合わせることで、その潜在能力を最大限に発揮します。 VERSION MT4 インジケーターが示す内容: 新しいトレンドの始まりに活性化する反転構造と反転レベル。 リスクと報酬の比率を最小限に抑えた利益 確定 と 損失停止の レベルの表示     RR 1:2   。 インテリジェントな削減ロジックによるストップロス。 指定されたインジケーターから 2 つのトレンド タイプの反転パターンを表示します。 指標: トレンドを追う   TREND LINES PRO   (世界的なトレンドの変化) TREND PRO   (クイックトレンド変更) シンプルで効果的   スキャナー   リアルタイムトレンド(新機能)。 マルチタイムフレームのインストゥルメント フィルタリング。 画面   利益     LOGIC AI信号の後。 当日プラス方
Gold Sniper Scalper Pro は、XAUUSD における ダマシブレイクアウト(false breakout)パターンの検出に特化した MetaTrader 5 用インジケーターです。価格がレンジの境界を突破してブレイクアウトトレーダーを誘い込み、その後反転してレンジ内に戻る4本バーのトラップ構造を識別します。インジケーターは各セットアップを17の品質要素で採点し、4層コンフルエンスパイプラインで評価し、7タイムフレームトレンドコンセンサスエンジンで検証し、ゴールドボラティリティレジーム分類器でフィルタリングします。すべてシグナルがチャートに表示される前に完了します。 詳細なユーザーガイドは、著者の   MQL5 ブログ   で入手できます。追加の更新は、著者の   MQL5 チャンネル   を通じて入手可能です。 現在のサポートポリシーに基づき、購入者は著者が開発した選定コンパニオンツールへの追加アクセスを受けることができます。 Forex通貨ペア、インデックス、暗号資産でも動作しますが、検出パラメーター、ボラティリティ処理、フィルターロジックはXAUUSD
ARIPoint is a powerful trading companion designed to generate high-probability entry signals with dynamic TP/SL/DP levels based on volatility. Built-in performance tracking shows win/loss stats, PP1/PP2 hits, and success rates all updated live. Key Features: Buy/Sell signals with adaptive volatility bands Real-time TP/SL/DP levels based on ATR Built-in MA Filter with optional ATR/StdDev volatility Performance stats panel (Success, Profit/Loss, PP1/PP2) Alerts via popup, sound, push, or email Cu
Matrix Arrow Indicator MT5
Juvenille Emperor Limited
5 (19)
マトリックスアローインジケーターMT5は、すべてのシンボル/商品(外国為替、商品、暗号通貨、インデックス、株式)で使用できる100%再描画されていないマルチタイムフレームインジケーターに続くユニークな10in1トレンドです。マトリックスアローインジケーターMT5は、初期段階で現在のトレンドを判断し、最大10の標準インジケーターから情報とデータを収集します。 平均方向移動指数(ADX) 商品チャネルインデックス(CCI) クラシック平研アシキャンドル 移動平均 移動平均収束発散(MACD) 相対活力指数(RVI) 相対力指数(RSI) 放物線SAR ストキャスティクス ウィリアムズのパーセント範囲 すべてのインジケーターが有効な買いまたは売りシグナルを与えると、対応する矢印がチャートに印刷され、次のろうそく/バーの開始時に強い上昇トレンド/下降トレンドを示します。ユーザーは、使用するインジケーターを選択し、各インジケーターのパラメーターを個別に調整できます。マトリックスアローインジケーターMT5は選択されたインディケーターからのみ情報を収集し、それらのデータのみに基づいてアローを印刷
Trend Hunter は、外国為替、仮想通貨、CFD 市場におけるトレンド指標です。 このインジケーターの特別な特徴は、価格がトレンドラインをわずかに突き抜けたときにシグナルを変更することなく、自信を持ってトレンドに従うことです。 インジケーターは再描画されず、バーが閉じた後に市場に参入するシグナルが表示されます。 トレンドに沿って移動すると、インジケーターにはトレンドの方向に追加のエントリーポイントが表示されます。 これらのシグナルに基づいて、小さなストップロスで取引できます。 トレンドハンターは正直な指標です。 インジケーター信号の上にマウスを置くと、信号の潜在的な利益と可能なストップが表示されます。 新しい信号が表示されると、次の通知を受け取ることができます。 アラート プッシュ通知 メールによる通知 電報での通知 チャートのスクリーンショットも Telegram に送信されるため、取引を決定するために端末を開く必要はありません。 インジケーターシグナルは、電報チャネル https://www.mql5.com/ja/market/product/11085#!ta
The Trend Forecaster indicator utilizes a unique proprietary algorithm to determine entry points for a breakout trading strategy. The indicator identifies price clusters, analyzes price movement near levels, and provides a signal when the price breaks through a level. The Trend Forecaster indicator is suitable for all financial assets, including currencies (Forex), metals, stocks, indices, and cryptocurrencies. You can also adjust the indicator to work on any time frames, although it is recommen
現在33%オフ 初心者にもエキスパートトレーダーにも最適なソリューション このインジケーターは独自の機能と新しい公式を多数内蔵しており、ユニークで高品質かつ手頃な取引ツールです。このアップデートでは、2つの時間枠ゾーンを表示できるようになります。より長いTFだけでなく、チャートTFとより長いTF(ネストゾーンを表示)の両方を表示できます。すべてのSupply Demandトレーダーの皆さんのお気に召すはずです。:) 重要情報の公開 Advanced Supply Demandの可能性を最大化するには、 https://www.mql5.com/ja/blogs/post/720245 にアクセスしてください。   エントリーまたはターゲットの正確なトリガーポイントを正確に特定できれば取引がどのように改善されるか想像してみてください。新しい基盤となるアルゴリズムに基づいて構築されているため、買い手と売り手の間の潜在的な不均衡をさらに簡単に特定できます。これは、最も強い需要と供給のゾーンと、過去のパフォーマンス(古いゾーンを表示)がグラフィカルに表現されるためです。これらの機能は、最適な
Master Editionは、ボリュームとマネーフローの視点を通じて市場構造を可視化するために設計されたプロフェッショナルグレードの分析ツールです。標準のボリュームインジケーターとは異なり、このツールはチャート上に日足ボリュームプロファイルを直接表示し、価格発見がどこで行われたか、そして「スマートマネー」がどこに位置しているかを正確に確認できます。 このMaster Editionは、明確さとスピードを考慮して設計されており、ロード時にチャートレイアウトを即座に美化するユニークな自動テーマ同期システムを備えています。 主な機能: 真のマネーフロー計算: 標準のティックボリュームを超えます。「Use Money Flow」を有効にすると、ボリュームは価格によって重み付けされ、特定の価格レベルでの実際の資本コミットメントが明らかになります。 バリューエリア (VA) の可視化: バリューエリア(デフォルトではボリュームの70%)を自動的に計算します。 VA Fill: コントロールゾーンを即座に識別するために、バリューエリアの背景をシェーディングします。 主要レベル: コントロールポイン
トレンドトレーディング は、タイミングのプルバックとブレイクアウトにより、市場で起こっているトレンドから可能な限り利益を得るように設計された指標です。確立されたトレンドの中で価格が何をしているかを分析することにより、取引の機会を見つけます。 [ インストールガイド | 更新ガイド | トラブルシューティング | よくある質問 | すべての製品 ] 自信を持って効率的に金融市場を取引する むち打ちにならずに確立されたトレンドから利益を得る 収益性の高いプルバック、ブレイクアウト、早期の逆転を認識する この指標は、独自の品質とパフォーマンスを分析します 複数時間枠のダッシュボードを実装します インジケーターは再描画されていません 電子メール/音声/視覚アラートを実装します 確立されたトレンドは多くの取引機会を提供しますが、ほとんどのトレンド指標はそれらを完全に無視しています。インジケーターの解釈はかなり簡単です: (1) トレンドの変化 (2) トレンドの方向への後退 (3) トレンドの方向へのブレイクアウト 赤いダッシュ は下降トレンド中の修正です 青いダッシュ は上昇トレンド中
作者のその他のプロダクト
The indicator calculates the saturation levels of the price chart. A signal to exit the resale area is a buy signal. A signal to exit the overbought area is a sell signal. Usually, you need to set relative values ​​for the overbought and oversold levels of Bottom and Top - for this indicator. Most often, a good trend is visible on the price chart visually. But an experienced trader must clearly understand the current balance of power in the market before entering. And the indicator will help t
This indicator can track the steady price movement in a certain direction. In this case, the movement itself can be downward, upward or lateral, when the market movement does not have a pronounced focus. The indicator works on the basis of two moving average as well as an oscillator. Using the signal search algorithm, the indicator generates signals in the form of arrows. Benefits. Allows you to determine the current trend. You can quickly enough understand which particular trend is currently
Dolphin Bands indicator works equally well on any timeframes. For medium-duration trends, it is recommended to use the standard setting. To study long-term trends, it is recommended to use an indicator value greater than the standard. To analyze short-term trends, it is better to use a lower indicator value. Most often, an exponential method is used to calculate the indicator, but other varieties can also be used. Dolphin Bands is a collection of lines. The two center lines of the indicator ar
Martingals indicator works on all currency pairs and on all timeframes. The arrows indicate the optimal entry points for future Martingale averaging, even with a zero exponent. The indicator shows a signal to close the series only if all previous signals can be closed in profit. After closing a series in profit, you need to immediately open an order in the direction of the signal. Thus, the close signal is at the same time the reverse opening point to the other side of the new order. The probabi
Levels Market is one of the simplest, but no less effective tools from this. Pivot points can be built from these levels, levels are constructed as statistical significance at a given point in time. Trading by levels is a classic in the work of a trader. You can use them as a ready-made trading strategy or as an additional filter in your trading system. In the settings you can specify the offset for building levels. Interpretation of levels: Lines 8/8 and 0/8 (Final Resistance). These lines ar
Trend New Trend Indicator, shows the signals for entry. Displays both entry points and the trend itself. Shows statistically calculated moments for entering the market with arrows. When using the indicator, it is possible to optimally distribute the risk factor. Settings: Uses all one parameter for settings. Selecting a parameter, it is necessary to visually resemble it so that the appropriate graph has a projection of extremes. Options: Length - the number of bars for calculating the indica
Condors TMA  ( Triangular Moving Average ) is a channel indicator without redrawing, built on the basis of moving averages. The key difference between the Condor TMA indicator and other channel indicators (for example, from the same Bollinger indicator) is that Condor TMA takes into account not simple moving averages, but twice smoothed ones, which allows one to more clearly determine the market movement, and on the other hand makes the indicator less sensitive.
Cancer indicator is great for trend trading! An intelligent indicator algorithm with high probability shows the points of potential market reversal. If you are trading in a trend, then a trading strategy built on the basis of this indicator is perfect for you. The indicator filters out market noise, almost everything and all the necessary functions for working with a thread are built into one tool. It works on all currency pairs and on all timeframes, indicator setting - according to your desire
A very simple and convenient trend indicator based on price divergence. He showed himself well in scalping. Help in finding entry points for analysis. It can be used as a filter in trade. It has two parameters: Period and Level. The Level parameter helps to filter out excess signals. For example, for EURUSD, the Level parameter may be 0.0001. The indicator can work both for entry points and as a filter. The indicator reflects information in a visual form. We must not forget that the approach to
Calculated trend indicator, can be used with an optimal risk to profit ratio, shows successful signals. Uses two options for settings. Shows favorable moments for entering the market with arrows. The probability of a successful trend is not very bad! The indicator can be used both for pipsing on small periods, and for long-term trading. The indicator does not redraw and does not lag. It works on all currency pairs and on all timeframes.
XStrain
Vitalii Zakharuk
The XStrain expert system works on all types of accounts. It works both in 4 and 5-digit quotes. Spread and requotes are not critical, any broker is suitable. To optimize the expert system, one year is recommended for the period H1 or H4. Optimization can be carried out at opening prices, the results differ little from testing on real ticks, since the bot works at opening prices. It is enough to optimize once a month! To get better results, it is recommended to work on several different pairs.
An expert of a new type Formulas has been created - it works using sharp tick movements. The uniqueness of the expert is that it can be launched on any hour period, any currency pair, and on the server of any broker. What makes the expert attractive enough to use for trading. It is recommended to work on liquid forex pairs with a low spread. The lower the commission and spread, the greater the profit. You can start using it with $ 100 and a lot of 0.01. A small initial deposit also contributes
The Trend Distinctive indicator smoothes price fluctuations during signal formation by averaging the data. This gives the trader the opportunity to visually determine what trend will be present at a particular time interval. This is an auxiliary tool for technical analysis, which helps to determine the exact direction of the trend: either an upward or downward movement of the price of a trading instrument. Although the indicator is a little late, it still generates the most reliable signals th
Red Bot
Vitalii Zakharuk
The mechanism of work of the Red Bot Expert Advisor is designed so that before opening a transaction, they undergo instant implicit filtering, which, if there are competent and practical settings, allows the buyer to level the number of unprofitable and unproductive transactions. The adviser has a large number of internal regulators, software installations and special codes that help to safely and efficiently trade. This is a fully automated Expert Advisor, built on the scalping strategy, work
Introduced expert system   Stable Ex works with the EURUSD currency pair and only with it. This system implemented the principle of five orders - that is, a maximum of five orders can be placed in one direction, after which the total position of the series must be closed by stops, either real or virtual. The trading system is designed to work separately with a series of buy orders and separately with a series of sell orders. which makes the trading system versatile enough. The expert passes all
The presented expert system works with the GBPUSD currency pair and only with it. This system implemented the principle of seven orders - that is, a maximum of seven orders can be made in one direction, after which the total position of the series should be closed by stops, either real or virtual. The trading system is designed to work separately with a series of buy orders and separately with a series of sell orders. which makes the trading system versatile enough. The expert passes all types
Transition indicator can track a steady price movement in a certain direction. In this case, the movement itself can be downward, upward or sideways, when the market movement does not have a pronounced focus. The indicator works on the basis of two moving average as well as an oscillator. Using the signal search algorithm, the indicator generates signals in the form of arrows. Trading based on trend indicators is the simplest and often the most effective. If you correctly determine the beginni
Global Trend Indicator, shows the signals for entry. Displays both entry points and the trend itself. Shows statistically calculated moments for entering the market with arrows. When using the indicator, the risk factor can be optimally distributed. Settings: Uses all one parameter for settings. Choosing a parameter, it is necessary to visually resemble it so that the appropriate graph has a projection of extremes. Parameters: Length - the number of bars for calculating the indicator. Use
Trend DI is an auxiliary tool for technical analysis that helps determine the exact direction of a trend: either an upward or downward movement of the price of a trading instrument. Although the Trend DI indicator is a bit late, it still generates the most reliable signals that a trader can safely navigate. The Trend DI indicator smooths price fluctuations during signal formation by averaging data. This gives the trader the opportunity to visually determine which trend will be present in a par
The Trend ZVD Trend Indicator is important for identifying trends in financial markets. However, this indicator works equally well during consolidation periods. The Trend ZVD trend indicator indicates the direction in which the asset of your choice can move. The Trend ZVD trend indicator copes with the main task of trading: to find the entry point to the market at the time the trend is created and the exit point at the time it is completed. A trend in trade is the steady movement of quotes in
An indicator from the zigzag family with levels. First of all, I will point out arguments in favor of the advisability of using a level indicator. They give the trader the following benefits: Alternative points of view - the level indicator helps to look at the levels from the side, compare them with several automatic systems, identify errors; Saving time - reducing the cost of effort for self-building lines; Exact mathematical calculation - quick calculation of levels, ratios of indicators
The Progress Scalp strategy is based on tick trading principles. At its core, this strategy is fenders, that is, the trader receives signals for opening positions during pullbacks from the main movement. A distinctive feature of this strategy is that transactions are concluded only during periods of strong tick movements in the forex market. The Progress Scalp strategy was developed for trading with different currency pairs. You need to choose a currency pair with the lowest spreads and virtual
Long
Vitalii Zakharuk
The Long expert system works with the EURUSD currency pair and only with it. The trading system is designed to work separately with a series of buy orders and separately with a series of sell orders. which makes the trading system versatile enough. The expert passes all types of testing throughout the history for the specified currency pair. Also, the expert system is tested with various delay values, it works in fully automatic mode! No settings are needed, use only the default settings. Thi
The indicator is simple and clear, making the work of the trader as easy as possible and giving clear signals to enter the market. This indicator has two settings for the period. Which makes it more flexible. And at the same time, many false signals do not appear. The larger the period, the smoother the indicator itself will be. It can be used both independently and together with other indicators of technical analysis (including with oscillators), as well as with another same indicator (with
Индикатор отображает регнессионный канал с сопровождением каналов фактически создавая уровни поддержки и сопротивления. Уровни поддержки и сопротивления являются одним из важнейших элементов технического анализа. С этим утверждением согласится любой трейдер. Уровни в трейдинге используются непосредственно, открывая и закрывая ордера у границ диапазона, очерченного ими. Также уровни применяют баланс спроса и предложения в своих торговых стратегиях на различных временных интервалах. Визуальное
An expert of a new type Anniversary - works using sharp tick movements, the algorithm that was created earlier is significantly improved. The uniqueness of the expert is that it can be launched on any hour period, any currency pair, and on the server of any broker. What makes the expert attractive enough to use for trading. It is recommended to work on liquid forex pairs with a low spread. The lower the commission and spread, the greater the profit. You can start using it with $ 100 and a lot o
The Trends Signal indicator displays the direction of the trend with arrows, works in a simple and clear way. It uses a combination of reliable and simple indicators to analyze prices. The signals of the Trends Signal indicator can be interpreted as follows: buy when the bars are colored blue, and sell when they are red. An effective indicator with a wide range of three parameters for trading. Parameters: Length - The number of bars to calculate. LevelUP, LevelDN - Levels for determining overb
The Open Trend indicator calculates the saturation levels of the price chart. Most often, a good trend is visible on a price chart visually. But an experienced trader should clearly understand the current balance of power in the market before entering. A signal to exit the oversold area is a buy signal. A signal to exit the overbought area is a sell signal. Usually, you need to set the relative values ​​for the overbought and oversold levels Bottom and Top for this indicator. The Open Trend i
Sharp
Vitalii Zakharuk
Sharp expert system works with a deposit of $ 100! The classic method of scalping. It is also worth noting that with the allowable level of the spread, the bot goes through any historical period on any currency pair. The key for the Sharp bot is the spread, it works with default settings, it is possible to work with a spread of up to 10. If the spread is more than 10, then you need to select other settings. Testing should be performed with a spread of up to 10 on all ticks. There is no point i
Are you tired of the constant ups and downs? It is not worth becoming a victim of unstable market movements, it is time to somehow get rid of it! Already now, you can use Business Trend solutions to balance the analysis of price movements and get a clearer picture of price behavior. Business Trend is a trend indicator for the MetaTrader 4 trading platform. This indicator allows you to find the most likely trend reversal points. You will no longer find a copyright indicator like this. A simple
フィルタ:
レビューなし
レビューに返信