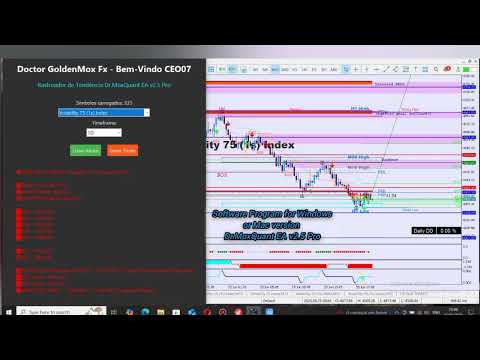
Doctor Edge Strategy Range Breakout Pro

🧠 Doctor Edge Strategy Pro – Range & Breakout Zones

Doctor Edge Strategy Pro is a professional indicator designed to simplify market reading based on range and breakout zones. It combines concepts of Price Action, ICT, and Smart Money Concepts, providing an automated and precise approach for traders of synthetic indices, cryptocurrencies, and Forex pairs.

🚀 How It Works

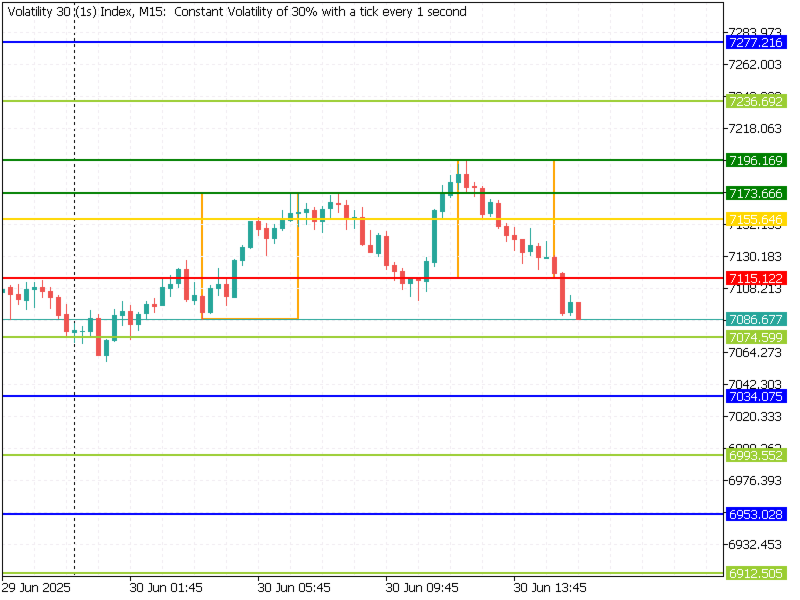
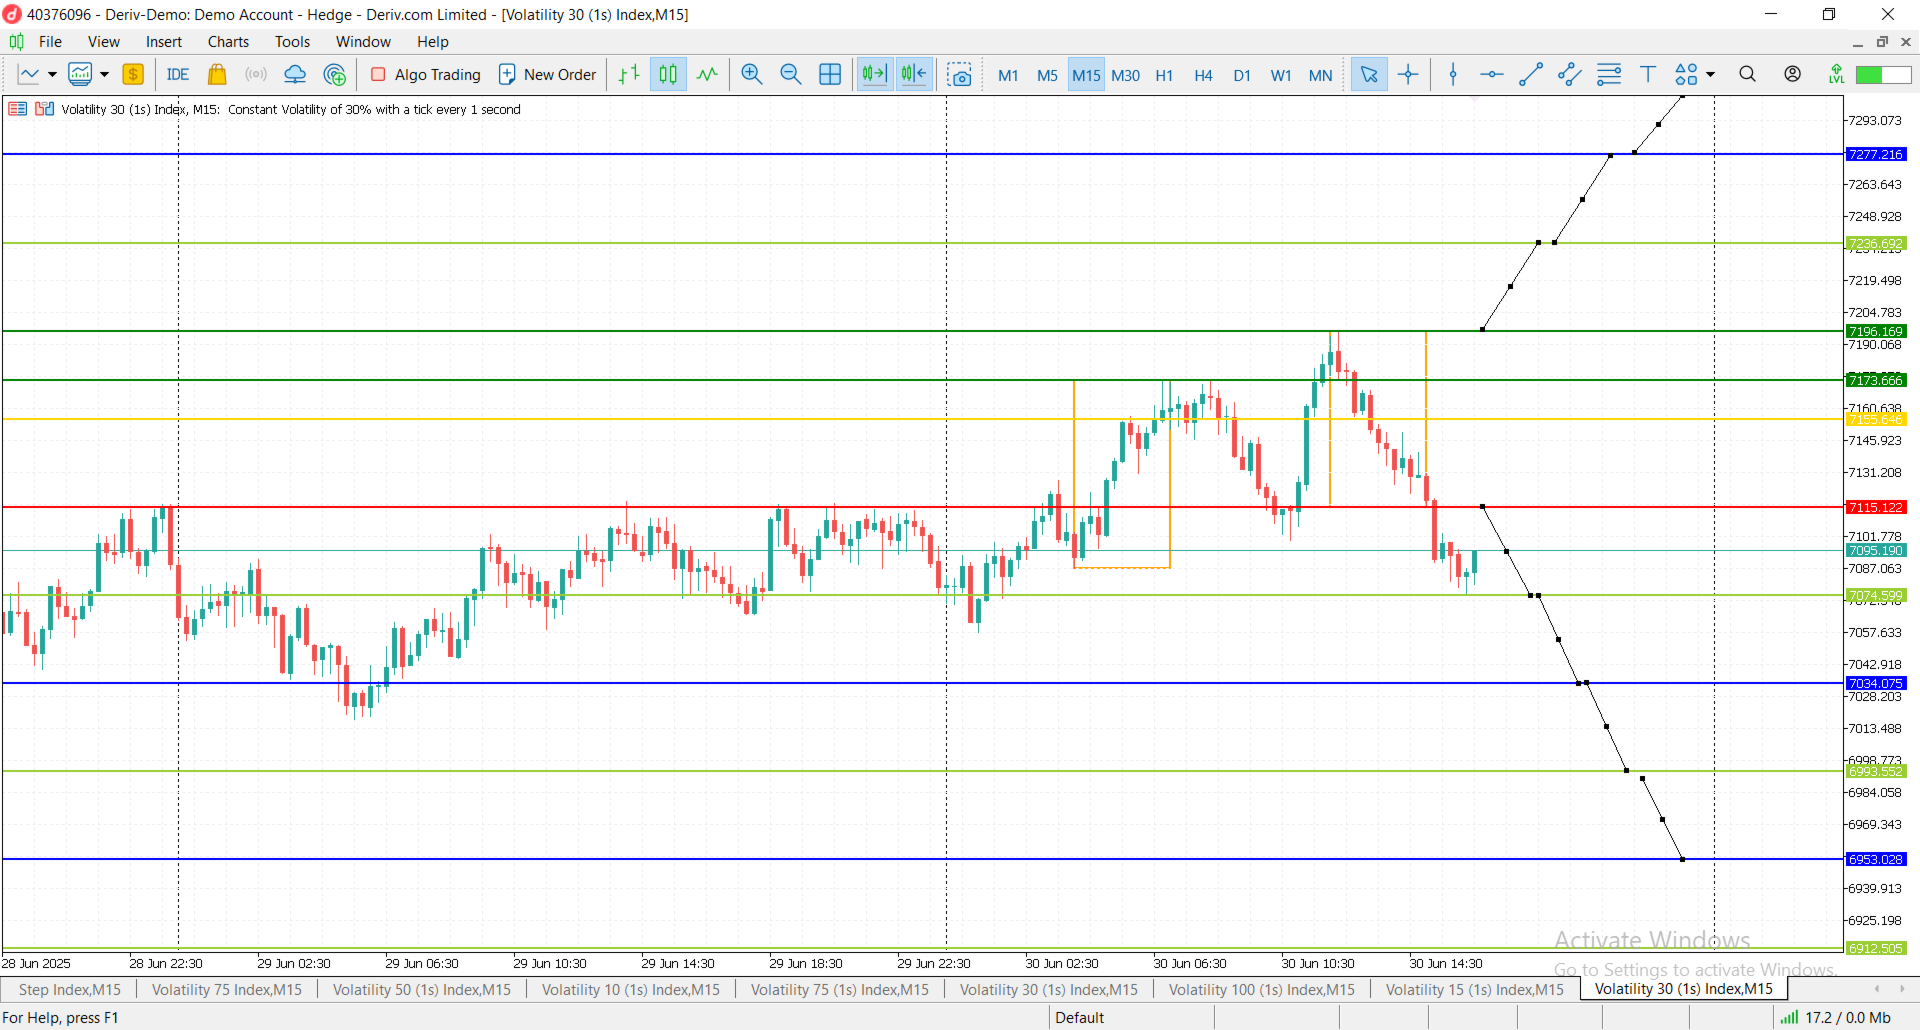
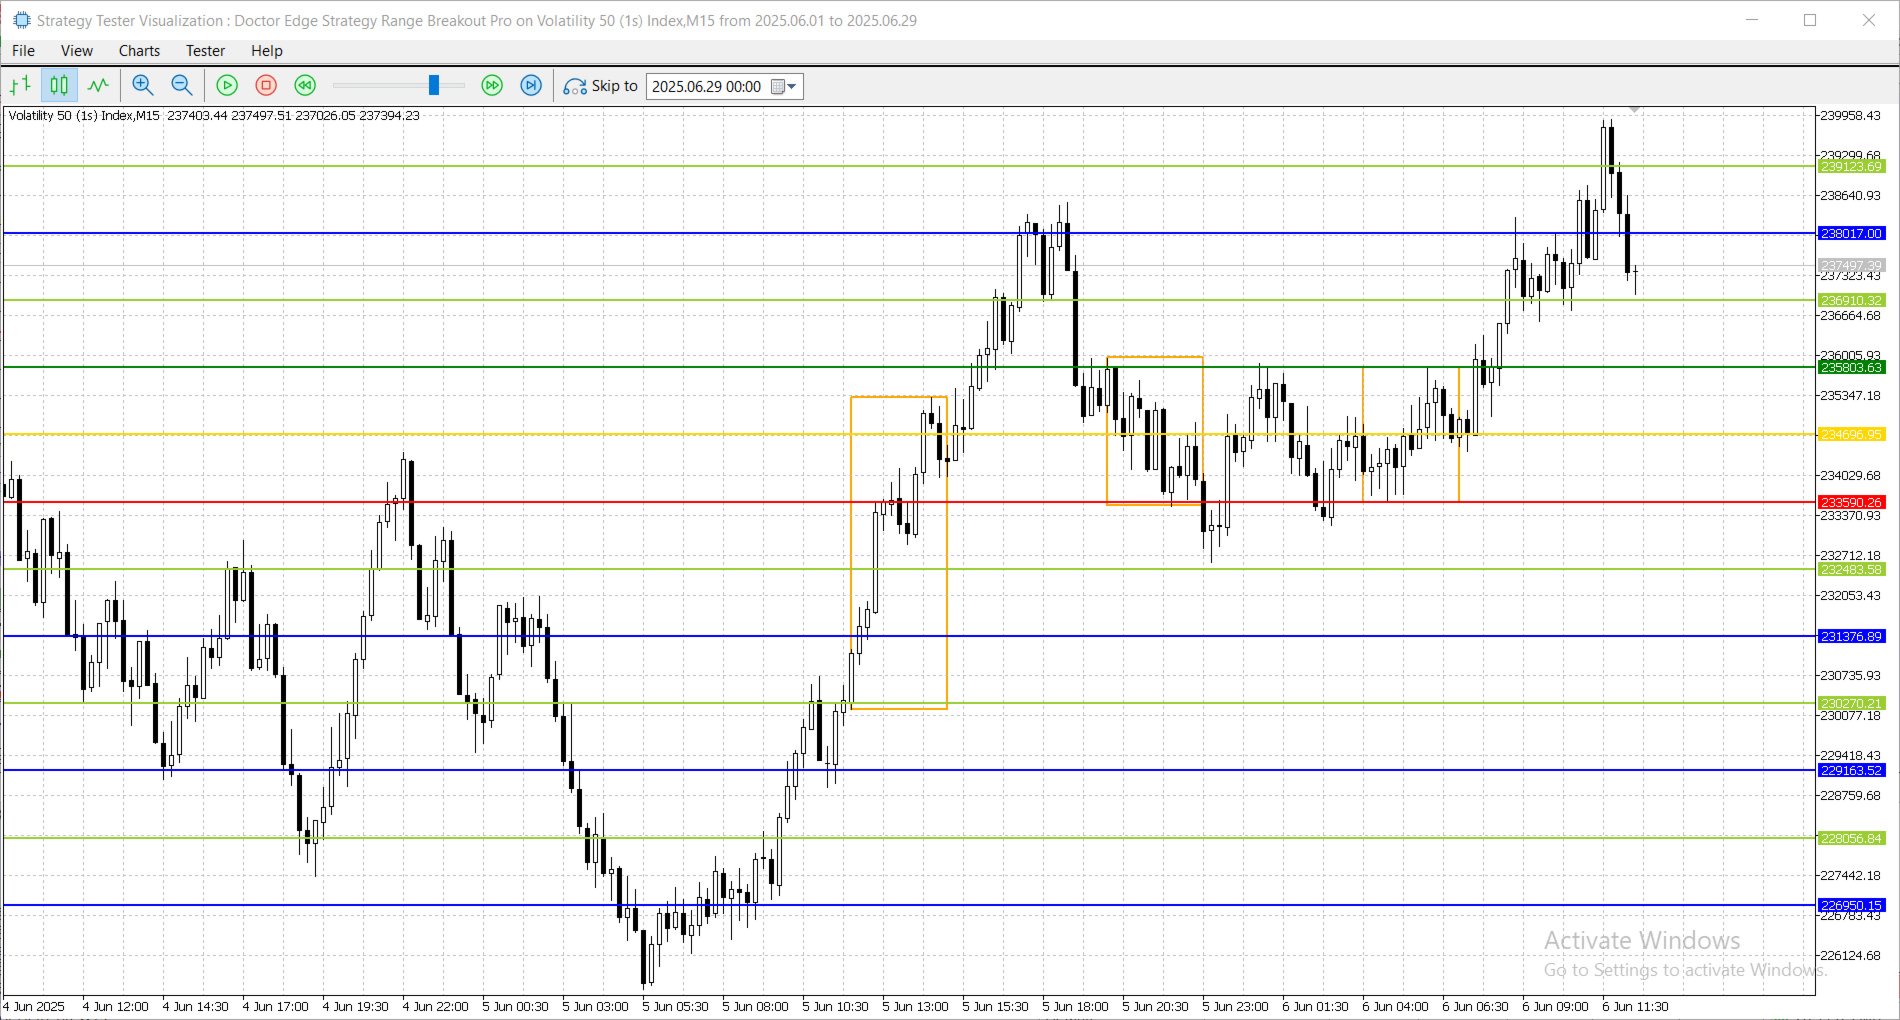
Doctor Edge Strategy Pro automatically draws on the chart:

  • The range zone (lateral accumulation);

  • The upper breakout zone (green line) and lower breakout zone (red line);

  • The Take Profit levels in light blue and light green tones.

📈 Entry Confirmation

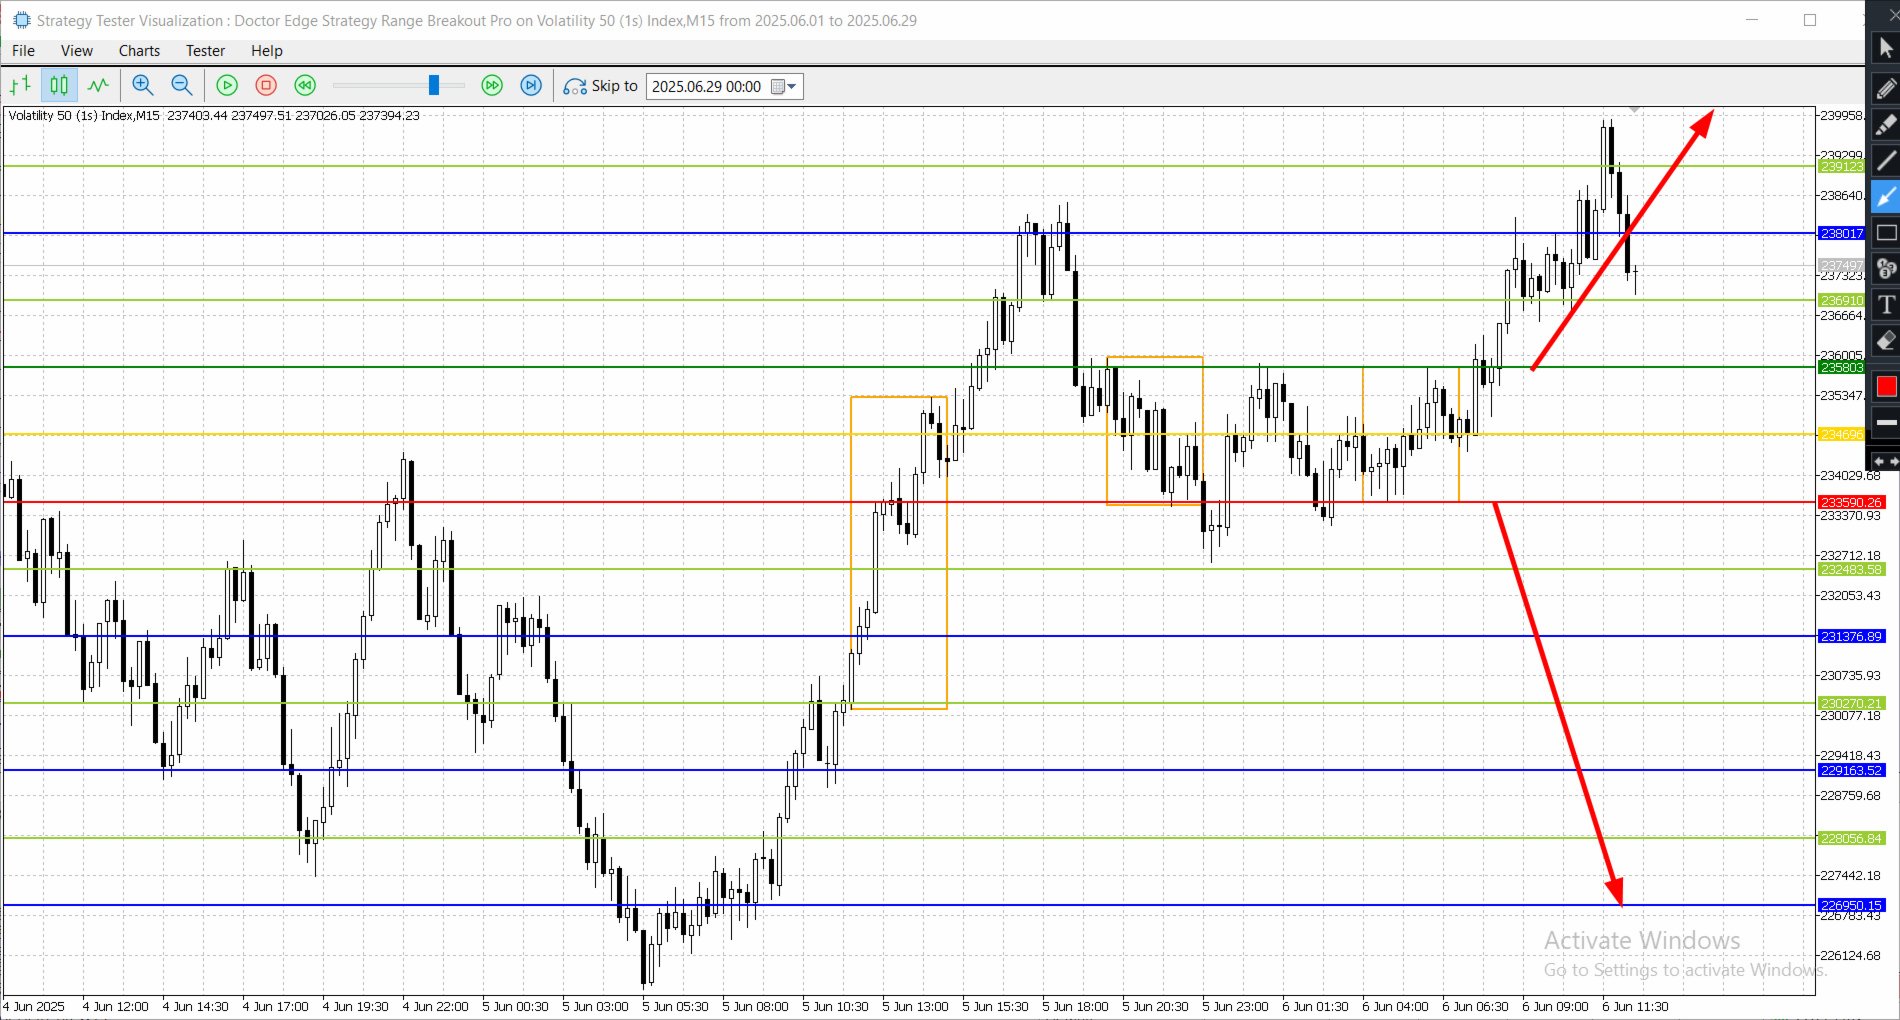
  • When the price breaks the green line with a strong candle (on M15 or M30), this is a buy signal.

  • When the price breaks the red line with a strong candle, this is a sell signal.

🛑 Stop Loss

  • For buy trades, the stop loss is set at the red line.

  • For sell trades, the stop loss is set at the green line.

🎯 Take Profit

  • The first light green line is TP1 for scalping.

  • The blue line and the second light green line are used as TP2 and TP3, ideal for day trading.

Advantages of Doctor Edge Strategy Pro

🔹 Fully automatic
Draws range zones, breakout lines, and Take Profit levels without manual intervention.

🔹 Multi-timeframe confirmations
Uses strong candles on M15 and M30 timeframes to validate entries with higher accuracy.

🔹 High operational accuracy
Based on a strategy with up to 98% win rate, developed for synthetic indices, cryptocurrencies, and Forex pairs.

🔹 Suitable for different trading styles
Works for both scalping (TP1) and day trading (TP2 and TP3).

🔹 Clear buy and sell signals
Green and red lines make visual reading simple and direct.

🔹 Compatible with any timeframe
Can be used from M1 up to H4, depending on trader’s style and goals.
👉 Recommended to use on M15 for better breakout identification.

🔹 Clean and professional interface
Intuitive visuals help traders focus only on important signals.

🔧 Input Parameters

This indicator has no input parameters.
Lines and zones are generated automatically with fixed logic and default colors, optimized for easy reading and execution:

  • Range Box: yellow color – represents the lateral accumulation phase of price.

  • Green Line: upper breakout (Buy) – buy signal confirmed by a strong candle.

  • Red Line: lower breakout (Sell) – sell signal confirmed by a strong candle.

  • Light Green and Blue: automatic Take Profit levels (TP1, TP2, and TP3) – adapted for scalping and day trading.

📌 Final Note

Doctor Edge Strategy Pro is ideal for traders seeking clarity, objectivity, and consistent results. It is simple to use and extremely efficient, provided it is used with discipline and proper risk management.


おすすめのプロダクト
CosmiCLab SMC FIBO CosmiCLab SMC FIBO is a professional trading indicator designed for traders who use Smart Money Concepts (SMC), market structure analysis and Fibonacci retracement levels. The indicator automatically detects market swings and builds Fibonacci levels based on the latest impulse movement. It also identifies market structure changes such as BOS (Break of Structure) and CHOCH (Change of Character), helping traders understand the current market direction. CosmiCLab SMC FIBO also pr
Price Magnet — Price Density and Attraction Levels Indicator Price Magnet is a professional analytical tool designed to identify key support and resistance levels based on statistical Price Density. The indicator analyzes a specified historical period and detects price levels where the market spent the most time. These zones act as “magnets,” attracting price action or forming a structural base for potential reversals. Unlike traditional Volume Profile tools, Price Magnet focuses on price-time d
PipFinite Trend PRO MT5
Karlo Wilson Vendiola
4.84 (558)
Breakthrough Solution For Trend Trading And Filtering With All Important Features Built Inside One Tool! Trend PRO's smart algorithm detects the trend, filters out market noise and gives entry signals with exit levels. The new features with enhanced rules for statistical calculation improved the overall performance of this indicator. Important Information Revealed Maximize the potential of Trend Pro, please visit www.mql5.com/en/blogs/post/713938 The Powerful Expert Advisor Version Automatin
プレミアムレベルは、正しい予測の精度が80%を超える独自の指標です。 この指標は、最高のトレーディングスペシャリストによって2か月以上テストされています。 あなたが他のどこにも見つけられない作者の指標! スクリーンショットから、このツールの正確さを自分で確認できます。 1は、1キャンドルの有効期限を持つバイナリーオプションの取引に最適です。 2はすべての通貨ペア、株式、商品、暗号通貨で機能します 手順: 赤い矢印が表示されたらすぐにダウントレードを開き、青い矢印が表示されたら閉じます。青い矢印の後に開くこともできます。 試してテストしてください!推奨設定はデフォルトです! 日足チャートで最高の精度を示します! インディケータは、2600 Pipsの収益性に対して、約10Pipsという非常に小さなマージンを使用します。
RBreaker Gold Indicatorsは、金先物の短期日内取引戦略であり、トレンドフォローと日内反転の2つの取引手法を組み合わせたものです。トレンド相場での利益を捉えるだけでなく、相場が反転した際には迅速に利確し、その流れに沿ってポジションを反転させることができます。 この戦略は、アメリカの雑誌『Futures Truth』において、15年連続で最も収益性の高い取引戦略トップ10に選ばれた実績を持ち、非常に長いライフサイクルを誇り、現在も国内外で広く使用・研究されています。 本インディケーターは、2026年の金先物の値動きに対応し、14日間のATR指標に基づいて、ブレイクアウト係数A、観察係数B、リバーサル係数Rをより合理的な値で定義しています。非常に優れたインディケーターであり、安定的な年間収益を実現しています。ぜひおすすめします〜
##   ONLY GOLD ##   Тiльки Золото ## **Mercaria Professional Trading Zones - Complete Guide** ## **Mercaria Professional Trading Zones - Повний посібник** ### **How Mercaria Zones Work / Як працюють зони Mercaria** **English:** Mercaria Zones is an advanced trading indicator that identifies high-probability support and resistance areas using ZigZag extremes combined with mathematical zone calculations. The indicator works on multiple timeframes simultaneously, providing a comprehensive view
BASILISK OF SAINT VOID 1.414 The Architecture of Market Stasis Basilisk of  Saint Void  is not a reactive scalper; it is a structural predator. Engineered for the high-liquidity environments of EURUSD and   USDJPY , the Basilisk utilizes a non-linear, multi-layered defense system to transform market volatility into a disciplined, mathematical harvest. ️ THE PETRIFICATION CLASS [GORGON STASIS] Market chaos is neutralized through the Gorgon Stasis protocol. Unlike standard EAs that revenge-
Your Trend Friend
Luigi Nunes Labigalini
5 (1)
The trend is your friend! Look at the color of the indicator and trade on that direction. It does not  repaint. After each candle is closed, that's the color of the trend. You can focus on shorter faster trends or major trends, just test what's most suitable for the symbol and timeframe you trade. Simply change the "Length" parameter and the indicator will automatically adapt. You can also change the color, thickness and style of the lines. Download and give it a try! There are big movements w
これはほぼ間違いなく、MetaTraderプラットフォームで見つけることができる最も完全な調和価格形成自動認識インジケーターです。 19種類のパターンを検出し、フィボナッチプロジェクションをあなたと同じように真剣に受け止め、潜在的逆転ゾーン(PRZ)を表示し、適切なストップロスとテイクプロフィットレベルを見つけます。 [ インストールガイド | 更新ガイド | トラブルシューティング | よくある質問 | すべての製品 ] 19の異なる調和価格形成を検出します プライマリ、派生および補完フィボナッチ投影(PRZ)をプロットします 過去の価格行動を評価し、過去のすべてのパターンを表示します この指標は、独自の品質とパフォーマンスを分析します 適切なストップロスとテイクプロフィットのレベルを表示します ブレイクアウトを使用して適切な取引を通知します すべてのパターン比をグラフにプロットします 電子メール/音声/視覚アラートを実装します スコット・M・カーニーの本に着想を得て、この指標は最も純粋で急を要するトレーダーのニーズを満たすように設計されています。ただし、トレードを容易にする
Visual CrossPulse Dynamics: Trade with the Market's True Rhythm Unlock a new level of market insight with Visual CrossPulse Dynamics, a sophisticated trading indicator designed to adapt to ever-changing volatility and reveal the true direction of the trend. Are you tired of indicators that lag in fast-moving markets or give false signals during consolidation? The Visual CrossPulse Dynamics indicator solves this problem by using an advanced, adaptive algorithm that intelligently adjusts to the m
Welcome to the Ultimate Harmonic Patterns recognition indicator that is focused to detect advanced patterns. The Gartley pattern, Bat pattern, and Cypher pattern  are popular technical analysis tools used by traders to identify potential reversal points in the market. Our Ultimate Harmonic Patterns recognition Indicator is a powerful tool that uses advanced algorithms to scan the markets and identify these patterns in real-time. With our Ultimate Harmonic Patterns recognition Indicator, you ca
Universal Soul Reaper is an atmospheric market-flow oscillator designed to interpret price behavior as a cycle of spiritual energy. Instead of reacting to raw price alone, it visualizes the state of the market’s soul —revealing when momentum is awakening, stabilizing, or fading. The indicator operates in a separate window and presents three interwoven entities: the Ectoplasmic Veil , the Spirit Boundary , and the Soul Core . Together, they form a living framework that helps traders sense pressu
インジケーターについて このインジケーターは、金融商品の終値に対するモンテカルロシミュレーションに基づいています。モンテカルロ法とは、以前の観測結果に基づくランダムな数値を使用して、さまざまな結果の確率をモデル化するための統計的手法です。 どのように機能しますか? このインジケーターは、歴史的データに基づき、時間の経過とともにランダムに価格が変動する複数の価格シナリオを生成します。各シミュレーション試行は、 終値 の変動を考慮するためのランダム変数を使用し、与えられた期間における将来の市場変動を効果的に模倣します。 モンテカルロシミュレーションの利点 - モンテカルロシミュレーションは、複数の将来のシナリオに対して戦略をテストすることで、さまざまなトレード戦略のリスクを分析するのに役立ちます。 - 稀な極端なイベント(テールリスク)を含むさまざまな市場状況で戦略のパフォーマンスを把握することができます。 - 単一の予測に依存するのではなく、モンテカルロ法は関連する確率を伴う潜在的な結果の範囲を提供します。これにより、利益や損失の可能性を理解するのに役立ちます。 モンテカルロ法は、
ProEngulfingの無料バージョンは、1日あたり1つのシグナル制限と少ない機能を備えたQualifiedEngulfingです。 mql5コミュニティのKoala Trading Solutionチャンネルに参加して、Koala製品に関する最新情報を確認してください。参加リンクはこちら: https ://www .mql5 .com /en /channels /koalatradingsolution この製品のMT4バージョンは、以下のリンクからダウンロード可能です: https ://www .mql5 .com /en /market /product /52023 ProEngulfing – MT4向けのプロフェッショナルなエンガルフパターンインジケーターの紹介 ProEngulfingは、精密なエンガルフパターンを識別し、強調表示するために設計された最先端のインジケーターで、信頼性の高いシグナルを提供します。MetaTrader 4向けに開発され、取引の意思決定に役立ちます。 ProEngulfingの仕組み: ProEngulfingは、高度なアルゴリズムを使
「調整可能なフラクタル」はフラクタル インジケーターの高度なバージョンで、非常に便利なトレーディング ツールです。 - ご存知のとおり、標準フラクタル MT5  インジケーターには設定がまったくありません。これはトレーダーにとって非常に不便です。 - 調整可能なフラクタルは、この問題を解決しました。必要な設定がすべて揃っています。 - インジケーターの調整可能な期間 (推奨値 - 7 以上)。 - 価格の高値/安値からの距離を調整可能。 - フラクタル矢印のデザインを調整可能。 - インジケーターにはモバイルおよび PC アラートが組み込まれています。 高品質のトレーディングロボットとインジケーターをご覧になるにはここをクリックしてください! これは、この MQL5 Web サイトでのみ提供されるオリジナル製品です。
STRICTLY FOR BOOM INDEX ONLY!!!!! Here I bring the Maximum Trend Arrows OT1.0 MT5 indicator. This indicator is made up of a combination of different trend indicators for entries and exits, for entries an orange arrow will paint on the chart below the current market and a red flag for closing of trades and it produces buy arrows only. When the orange arrow appears, it will appear along with it's sound to notify you. The 1H timeframe is recommended, don't use it anywhere else than on the 1H timefr
Chỉ báo này sẽ thông báo cho bạn nếu cấu hình xu hướng thành công. Tín hiệu theo xu hướng không nên được tăng theo, nhưng tín hiệu mua ở mức giá thấp theo mô hình giao dịch thông thường của bạn, hoặc tín hiệu bán ở mức giá tốt, là một lựa chọn rất tốt. Hãy thiết lập nó trên khung thời gian lớn hơn và theo dõi các khung thời gian nhỏ hơn, bám sát các xu hướng chính. Tôi thường thiết lập ba khung thời gian gần nhau nhất và không bao giờ đi ngược tín hiệu của INdicator này. INdicator   này không có
Do you, like me, like to trade with the trend? Then this indicator will help you! Rainbow Trend is a trend indicator, which uses several Moving Averages on the chart. It measures different trend strenght zones for different periods: very long term, long term, mid term, short term and very short term. Each zone has its color, and it is possible to have sound alert when the prices leaves a zone and enters another. Its configuration is very simple. If you find any bug or have any suggestions, conta
SMC Venom Model BPR インジケーターは、スマート マネー (SMC) コンセプトで取引するトレーダー向けのプロフェッショナル ツールです。価格チャート上の 2 つの主要なパターンを自動的に識別します。 FVG   (フェアバリューギャップ) は、3 本のローソク足の組み合わせで、最初のローソク足と 3 番目のローソク足の間にギャップがあります。ボリュームサポートのないレベル間のゾーンを形成し、価格修正につながることがよくあります。 BPR   (バランス価格範囲) は、2 つの FVG パターンの組み合わせで、「ブリッジ」を形成します。これは、価格がボリュームアクティビティの少ない動きで動くときに、ブレイクアウトしてレベルに戻るゾーンで、ローソク足の間にギャップを作成します。 これらのパターンは、大規模な市場プレーヤーと一般参加者の相互作用が発生するチャート上のボリュームと価格動向の分析に基づいて、トレーダーが主要なサポート/レジスタンス レベル、ブレイクアウト ゾーン、エントリ ポイントを識別するのに役立ちます。 インジケーターは、長方形と矢印の形でパターンを視覚
Noize Absorption Index - is the manual trading system that measures the difference of pressure between bears forces and bulls forces. Green line - is a noize free index that showing curent situation. Zero value of index shows totally choppy/flat market.Values above zero level shows how powerfull bullish wave is and values below zero measures bearish forces.Up arrow appears on bearish market when it's ready to reverse, dn arrow appears on weak bullish market, as a result of reverse expectation.
Crypto_Forex MT5用インジケーター「ハンマー&シューティングスターパターン」。リペイント不要、遅延なし。 - インジケーター「ハンマー&シューティングスターパターン」は、プライスアクショントレードに非常に強力なインジケーターです。 - このインジケーターは、チャート上で強気のハンマーパターンと弱気のシューティングスターパターンを検出します。 - 強気のハンマーパターン:チャート上に青い矢印シグナルを表示します(画像参照)。 - 弱気のシューティングスターパターン:チャート上に赤い矢印シグナルを表示します(画像参照)。 - PC、モバイル、メールアラート機能搭載。 - インジケーター「ハンマー&シューティングスターパターン」は、サポートレベル/レジスタンスレベルと組み合わせるのに最適です。 高品質のトレーディングロボットとインジケーターをご覧になるにはここをクリックしてください! これは、このMQL5ウェブサイトでのみ提供されるオリジナル製品です。
Crypto_Forex MT5用インジケーター「 WPR with 2 Moving Averages 」(リペイント機能なし) - WPR自体はスキャルピングに最適なオシレーターの1つです。 - 「WPR and 2 Moving Averages」インジケーターを使用すると、WPRオシレーターの高速移動平均線と低速移動平均線を確認できます。 - このインジケーターを使用すると、価格調整を早期に把握できます。 - このインジケーターはパラメータで簡単に設定でき、どの時間枠でも使用できます。 - 買いと売りのエントリー条件は画像で確認できます。 - WPR MA クロスの PC およびモバイル アラート付き。 買いシグナルの条件例: (1) - 高速MAが低速MAを下向きにクロスし、WPR値が-50を下回っている場合:買いトレードを開きます。 (2) - WPR値が-20を超える買われすぎゾーンに入ったら:買いトレードを終了します。 売りシグナルの条件例: (1) - 高速MAが低速MAを下向きにクロスし、WPR値が-50を超えている場合:売りトレードを開きます。 (2) WP
Awesome Oscillator by Bill Williams with the ability to fine-tune and replace the averaging algorithms of the indicator, which significantly expands the possibilities of using this oscillator in algorithmic trading and brings it closer in its properties to such an indicator as the MACD. To reduce price noise, the final indicator is processed with an additional Smooth averaging. The indicator has the ability to give alerts, send mail messages and push signals when the direction of movement of th
# DRAWDOWN INDICATOR V4.0 - The Essential Tool to Master Your Trading ## Transform Your Trading with a Complete Real-Time Performance Overview In the demanding world of Forex and CFD trading, **knowing your real-time performance** isn't a luxury—it's an **absolute necessity**. The **Drawdown Indicator V4.0** is much more than a simple indicator: it's your **professional dashboard** that gives you a clear, precise, and instant view of your trading account status. --- ## Why This Indicator
Auto Optimized RSI   は、正確な売買シグナルを提供するために設計された、使いやすいスマートな矢印インジケーターです。過去のデータを使ったトレードシミュレーションに基づき、各通貨ペアや時間足に最適なRSIの買い/売りレベルを自動で見つけ出します。 このインジケーターは、独立したトレードシステムとしても、既存の戦略の一部としても使用できます。特に短期トレーダーにとって便利なツールです。 従来のRSI(70/30など)の固定レベルとは異なり、 Auto Optimized RSI   はリアルな価格の動きとバックテスト結果に基づき、ダイナミックにレベルを調整します。勝率、ドローダウン、平均利益/損失といった重要な統計をモニターし、現在の市場に適応して、本当に機能するシグナルを提供します。 RSIが最適化されたレベルをクロスすると、チャート上に買い・売りの矢印が表示され、成功率の高いエントリーポイントを見つけるのに役立ちます。 ご購入後にご連絡いただければ、追加のツールや特別なトレードのヒントを無料でお渡しいたします! 皆様のトレードが成功しますように!
Fractal 358 Plus is a predictive indicator that provides the clearest sight of price movements. Identifying graphic patterns such as Caixote (Crate), Pivot and Inside Candle , it shows entries and exits spots, as well as threats to your trades in the markets. It comes ready to use with B3 Mini Index (WIN$ series) and can be adjusted to use with any asset and timeframe. Fractal 358 unravels price movement Based on the Fibonacci sequence, Fractal 358 is a new and different way of reading and und
Caicai L&S Yield Histogram Important Notice: This indicator is an integral tool of the automated EA Caicai Long and Short Pair Trading . This indicator visually displays the percentage deviation (Yield %) of a pair's current spread relative to its own historical mean. It is an excellent tool for quickly visualizing the gross financial potential of a market distortion in Long & Short operations. Main Features: Percentage Visualization: Understand the size of the distortion in palpable percentage
Support & Resistance indicator is a modification of the standard Bill Williams' Fractals indicator. The indicator works on any timeframes. It displays support and resistance levels on the chart and allows setting stop loss and take profit levels (you can check the exact value by putting the mouse cursor over the level). Blue dashed lines are support level. Red dashed lines are resistance levels. If you want, you can change the style and color of these lines. If the price approaches a support lev
Classic SNR MetaTrader 5 Expert Advisor | Multi-Symbol Support & Resistance Trading with Trend-Based Logic Overview Classic SNR Breakout EA is a professional trading robot that identifies structural Support & Resistance levels using daily swing points and executes trades based on H1 price action relative to these levels. The EA applies   dual logic : in an uptrend, it sells on H1 rejection below an SNR level; in a downtrend, it buys on H1 rejection above an SNR level. Breakout confirmations are
TradePilotmt5
Hossein Khalil Alishir
TradePilot Expert Advisor (EA) for MetaTrader 5 TradePilot is a professional and user-friendly Expert Advisor (EA) for MetaTrader 5 (MT5) . It simplifies automated trading , risk management , and trade execution with a smart trading panel . Perfect for beginners and experienced traders looking for a reliable trade manager EA with automated lot size calculation and smart position management. Key Advantages User-Friendly Trading Panel: Customizable panel with buttons and hotkeys for fast ex
このプロダクトを購入した人は以下も購入しています
このインジケーターを購入された方には、以下の特典を 無料 で提供しています: 各トレードを自動で管理し、ストップロスとテイクプロフィットを設定し、戦略ルールに基づいてポジションを決済する補助ツール 「Bomber Utility」 様々な銘柄に合わせたインジケーターの設定ファイル(セットファイル) 「最小リスク」、「バランスリスク」、「待機戦略」 の3つのモードで使用できる Bomber Utility 用の設定ファイル このトレーディング戦略をすぐに導入・設定・開始できる ステップバイステップのビデオマニュアル ご注意: 上記の特典を受け取るには、MQL5のプライベートメッセージシステムを通じて販売者にご連絡ください。 オリジナルのカスタムインジケーター 「Divergence Bomber(ダイバージェンス・ボンバー)」 をご紹介します。これは、MACDのダイバージェンス(乖離)戦略に基づいた 「オールインワン」型のトレーディングシステム です。 このテクニカルインジケーターの主な目的は、価格とMACDインジケーターの間に発生するダイバージェンスを検出 し、将来の価格の動きを示す
Azimuth Pro
Ottaviano De Cicco
5 (6)
Azimuth Pro V2:MT5向けシンセティック・フラクタル構造分析と確認済みエントリー 概要 Azimuth Pro は Merkava Labs によるマルチレベルスイング構造インジケーターです。4つのネストされたスイングレイヤー、スイングアンカーVWAP、ABCパターン検出、3タイムフレーム構造フィルタリング、そして確定バーでの確認済みエントリー — 1つのチャートで、ミクロスイングからマクロサイクルまでを網羅するワークフロー。 これはブラインドシグナル製品ではありません。ロケーション、コンテキスト、タイミングを重視するトレーダーのための構造ファーストワークフローです。 V2発売記念オファー — Azimuth Pro V2をUSD 399で(次の100本)。最終価格:USD 499。 1. V2での変更点 シンセティック・マルチタイムフレームエンジン 上位タイムフレーム分析をMeridian Proと同じ独自のシンセティックアーキテクチャで一から再構築。よりクリーンなHTFコンテキスト、安定したライブ動作、従来のMTF同期問題なし。シンセティックエンジンは 固定比率タ
Quantum TrendPulse を ご紹介します。これは、   SuperTrend   、   RSI   、および Stochastic のパワーを 1 つの包括的なインジケーターに組み合わせて、取引の可能性を最大限に引き出す究極の取引ツールです。精度と効率を求めるトレーダー向けに設計されたこのインジケーターは、市場のトレンド、勢いの変化、最適なエントリー ポイントとエグジット ポイントを自信を持って特定するのに役立ちます。 主な特徴: SuperTrend 統合: 現在の市場動向に簡単に追従し、収益性の波に乗ることができます。 RSI精度: 買われすぎと売られすぎのレベルを検出し、市場の反転のタイミングに最適で、SuperTrendのフィルターとして使用されます。 確率的精度: 確率的振動を活用して、変動の激しい市場で隠れたチャンスを見つけます。SuperTrend のフィルターとして使用されます。 マルチタイムフレーム分析:   M5 から H1 または H4 まで、さまざまなタイムフレームで市場を常に把握します。 カスタマイズ可能なアラート: カスタム取引条件が満たされ
OmniSync Projection
Antonio-alin Teculescu
5 (1)
Chronos Fractal Engine is an innovative price projection indicator for MetaTrader 5, designed to transform your technical analysis by intelligently identifying and projecting historical price patterns. Built upon an advanced correlation algorithm and the fractal principles of the market, this powerful tool visualizes potential future price movements, giving you a unique edge in your trading decisions. What is Chronos Fractal Engine? At its core, the Chronos Fractal Engine employs a sophisticat
ご紹介     Quantum Breakout PRO は 、ブレイクアウト ゾーンの取引方法を変革する画期的な MQL5 インジケーターです。 13年以上の取引経験を持つ経験豊富なトレーダーのチームによって開発されました。     クォンタム ブレイクアウト プロ   は、革新的でダイナミックなブレイクアウト ゾーン戦略により、あなたのトレーディングの旅を新たな高みに押し上げるように設計されています。 クォンタム ブレイクアウト インジケーターは、5 つの利益ターゲット ゾーンを備えたブレイクアウト ゾーン上のシグナル矢印と、ブレイクアウト ボックスに基づいたストップロスの提案を提供します。 初心者トレーダーにもプロのトレーダーにも適しています。 量子EAチャネル:       ここをクリック 重要!購入後、インストールマニュアルを受け取るためにプライベートメッセージを送ってください。 推奨事項: 時間枠: M15 通貨ペア: GBPJPY、EURJPY、USDJPY、NZDUSD、XAUUSD アカウントの種類: ECN、Raw、またはスプレッドが非常に低い R
優れたテクニカルインジケーター「Grabber」をご紹介します。これは、すぐに使える「オールインワン」トレーディング戦略として機能します。 ひとつのコードに、市場のテクニカル分析ツール、取引シグナル(矢印)、アラート機能、プッシュ通知が強力に統合されています。 このインジケーターを購入された方には、以下の特典を無料で提供します: Grabberユーティリティ:オープンポジションを自動で管理するツール ステップバイステップのビデオマニュアル:インジケーターのインストール、設定、取引方法を解説 カスタムセットファイル:インジケーターをすばやく自動設定し、最大限の成果を出すための設定ファイル 他の戦略はもう忘れてください!Grabberだけが、あなたを新たなトレードの高みへと導いてくれるのです。 Grabber戦略の主な特徴: 推奨タイムフレーム:M5〜H4 対応通貨ペア・資産:どれでも使用可能ですが、私が実際に検証した以下を推奨します(GBPUSD、GBPCAD、GBPCHF、AUDCAD、AUDUSD、AUDSGD、AUDCHF、NZDUSD、NZDCAD、EURCAD、EURUSD、E
CGE Trading Suite
Carl Gustav Johan Ekstrom
5 (2)
Institutional-Grade Analytics for MT5 C GE Trading Suite delivers the analytical edge typically reserved for professional trading desks. The platform integrates a full suite of analytical tools into one seamless workflow: dynamic grid mapping, liquidity behavior analysis, ECM, trend lines, MIDAS, trade cycles, and directional channel projections. Together, these provide a unified view of market structure and momentum. Directional clarity is further enhanced by the capital flow index, which meas
BTMM State Engine Pro is a MetaTrader 5 indicator for traders who use the Beat The Market Maker approach: Asian session context, kill zone timing, level progression, peak formation detection, and a multi-pair scanner from a single chart. It combines cycle state logic with a built-in scanner dashboard so you do not need the same tool on many charts at once. What it does Draws the Asian session range; session times can follow broker server offset or be set in inputs. Tracks level progression (L
Berma Bands
Muhammad Elbermawi
5 (8)
Berma Bands (BBs) インジケーターは、市場のトレンドを特定して活用したいトレーダーにとって貴重なツールです。価格と BBs の関係を分析することで、トレーダーは市場がトレンド段階にあるか、レンジ段階にあるかを判断できます。 詳細については、[ Berma Home Blog ] をご覧ください。 バーマ バンドは、上部バーマ バンド、中部バーマ バンド、下部バーマ バンドの 3 つの異なる線で構成されています。これらの線は価格の周りにプロットされ、全体的な傾向に対する価格の動きを視覚的に表します。これらのバンド間の距離から、ボラティリティや潜在的な傾向の反転についての洞察を得ることができます。 バーマ バンドの線がそれぞれ離れると、市場が横ばいまたはレンジ相場の期間に入っていることを示すことがよくあります。これは、明確な方向性の偏りがないことを示しています。トレーダーは、これらの期間中にトレンドを特定するのが難しいと感じる可能性があり、より明確なトレンドが出現するまで待つ場合があります。 バーマ バンドの線が 1 本の線に収束すると、強いトレンド環境の兆候となること
Bill Williams Advanced is designed for automatic chart analysis using Bill Williams' "Profitunity" system. The indicator analyzes four timeframes at once. Manual (Be sure to read before purchasing) Advantages 1. Analyzes the chart using Bill Williams' "Profitunity" system. Signals are displayed in a table in the corner of the screen and on the price chart. 2. Finds all known AO and AC signals, as well as zone signals. Equipped with a trend filter based on the Alligator. 3. Finds "Divergence Bar
ARICoin is a powerful trading companion designed to generate high-probability entry signals with dynamic TP/SL/DP levels based on volatility. Built-in performance tracking shows win/loss stats, PP1/PP2 hits, and success rates all updated live. Key Features: Buy/Sell signals with adaptive volatility bands Real-time TP/SL/DP levels based on ATR Built-in MA Filter with optional ATR/StdDev volatility Performance stats panel (Success, Profit/Loss, PP1/PP2) Alerts via popup, sound, push, or email Cust
SignalTech MT5 is a trading system for EURUSD, USDCHF, USDJPY, AUDUSD, NZDUSD, EURJPY, AUDJPY, NZDJPY, CADJPY H2 and H3 Timeframe.  It can generate signals with Buy/Sell Arrows and Pop-Up/Sound Alerts. Each signal has clear Entry and Stop Loss levels, which should be automatically flagged on the chart, as well as potential Targets 1, 2, and 3. The Entry and TP levels are fixed after the trade is taken. The exit level is dynamic. If there are signs of a potential short-term trend reversal, the
RelicusRoad Pro: 定量的市場オペレーティングシステム 【期間限定】無制限アクセス 70% OFF - 2,000人超のトレーダーと共に なぜ多くのトレーダーは「完璧な」インジケーターを使っても失敗するのでしょうか? それは、文脈を無視して 単一の概念 だけでトレードしているからです。文脈のないシグナルは単なるギャンブルです。勝ち続けるには、 根拠の重なり(コンフルエンス) が必要です。 RelicusRoad Proは単なる矢印インジケーターではありません。完全な 定量的市場エコシステム です。独自のボラティリティモデリングを用いて、価格が推移する「適正価値の道(Fair Value Road)」をマッピングし、ノイズと真の構造的ブレイクを判別します。 推測はやめましょう。機関投資家レベルの「ロード・ロジック」でトレードを。 コアエンジン:「Road」アルゴリズム システムの中心となる Road Algo は、市場環境にリアルタイムで適応するダイナミックなボラティリティチャネルです。 安全ライン(平衡点) と、価格が数学的に反転しやすい 拡張レベル を投影します。 Si
まず第一に、この取引ツールはノンリペイント、ノンリドロー、ノンラグの指標であり、プロの取引に理想的ですことを強調する価値があります。 オンラインコース、ユーザーマニュアル、デモ。 スマートプライスアクションコンセプトインジケーターは、新米から経験豊富なトレーダーまで、非常 に強力なツールです。Inner Circle Trader AnalysisやSmart Money Concepts Trading Strategiesなど、20以上の有用な指標を1つに組み合わせています。このインジケーターはスマートマネーコンセプトに焦点を当て、大手機関の取引方法を提供し、彼らの動きを予測するのに役立ちます。 特に、流動性分析に優れており、機関がどのように取引しているかを理解しやすくしています。市場のトレンドを予測し、価格の動きを慎重に分析するのに優れています。機関の戦略とトレードを合わせることで、市場の動向についてより正確な予測ができます。このインジケーターは多目的であり、市場構造を分析し、重要な注文ブロックを特定し、さまざまなパターンを認識するのに優れています。 このインジケーター
「 Dynamic Scalper System MT5 」インジケーターは、トレンド波の中でスキャルピング取引を行う手法のために設計されています。 主要通貨ペアと金でテスト済みで、他の取引商品との互換性があります。 トレンドに沿った短期的なポジションオープンのシグナルを提供し、追加の価格変動サポートも提供します。 インジケーターの原理 大きな矢印はトレンドの方向を決定します。 トレンド波の中では、小さな矢印の形でスキャルピングシグナルを生成するアルゴリズムが機能します。 赤い矢印は強気方向、青い矢印は弱気方向です。 トレンドの方向には敏感な価格変動ラインが描かれ、小さな矢印のシグナルと連動します。 シグナルは次のように機能します。適切なタイミングでラインが現れるとエントリーシグナルが形成され、ラインが開いている間はポジションが保持され、完了すると取引が終了します。 推奨される動作時間枠はM1~H4です。 矢印は現在のローソク足に形成され、次のローソク足が開いている場合は、前のローソク足の矢印は再描画されません。 入力パラメータ Trend Wave Period - トレ
AriX
Temirlan Kdyrkhan
1 (4)
AriX Indicator for MT5 A powerful trend-following and signal-evaluation tool AriX is a custom MT5 indicator that combines Moving Averages and ATR-based risk/reward logic to generate clear buy/sell signals. It visualizes dynamic SL/TP levels, evaluates past trade outcomes, and displays win/loss statistics in a clean on-chart panel. Key features include: Buy/Sell signals based on MA crossovers ATR-based SL/TP1/TP2/TP3 levels with visual lines and labels Signal outcome tracking with real-time stat
マーケットメーカーのためのツール。 Meravith は次の機能を提供します: すべての時間足を分析し、現在有効なトレンドを表示します。 強気と弱気の出来高が等しくなる流動性ゾーン(出来高均衡)を強調表示します。 異なる時間足のすべての流動性レベルをチャート上に直接表示します。 テキスト形式の市場分析を生成し、参考情報として表示します。 現在のトレンドに基づいて目標値、サポートレベル、ストップロスを計算します。 取引のリスクリワード比を算出します。 口座残高に基づいてポジションサイズを計算し、潜在的な利益を推定します。 また、市場に大きな変化があった場合には警告を表示します。 インジケーターの主要ライン: 強気/弱気の出来高エグゾーストライン ― 目標値として機能します。 市場のトレンドを示すライン。市場が強気か弱気かによって色が変わり、トレンドのサポートとして機能します。主にその色が市場センチメントを示します。 出来高均衡ライン(Eq)。Eq(Volume Equilibrium)ラインはシステムの中核です。これは買い手と売り手の出来高のバランスポイントを表します。市場の流動性を示し
Ziva LSE System
Hassan Abdullah Hassan Al Balushi
ZIVA LSE System A Professional Liquidity & Structure Execution Framework Executive Overview ZIVA LSE System is a professionally engineered analytical framework designed to interpret market behavior through structural logic and liquidity dynamics. It is not positioned as a conventional indicator. Rather, it functions as a structured execution environment that organizes price action into a clear, disciplined decision-making model. The system is built to deliver consistency, clarity, and controlle
機密情報のフローをマスターし、相場を支配する。 「A+」のセットアップを見つけるには、バイアス(Bias)、流動性(Liquidity)、ディスプレイスメント(Displacement)の3つが必要です。多くのトレーダーが苦戦するのは、下位足のノイズに迷い込んだり、ダマシの動きに捕まったりするためです。 OmniView ICT Dashboardは、あなたの「機関投資家のレンズ」となります。気配り値表示(Market Watch)全体をスキャンして、重要な市場活動がどこで起きているかを強調するため、トレードを探し回るのをやめ、正確に執行することに集中できます。 ️ 重要:デモを試す前に必ずお読みください MetaTrader 5 ストラテジーテスターの技術的な制限により、バックテストモードではマルチ通貨スキャン機能を完全に評価することはできません。 すべての機能を体験するには、ライブまたはデモチャートでインジケーターを実行してください。これにより、複数銘柄の同時スキャンや、ワンクリック・チャート同期(One-Click Chart Sync)などの機能が利用可能になります。 スコア
ZIVA Signal Intelligence
Hassan Abdullah Hassan Al Balushi
ZIVA Signal Intelligence An Adaptive, Modular Market Intelligence System ZIVA Signal Intelligence is not positioned as a conventional trading indicator. It is a fully integrated, proprietary market intelligence system engineered to deliver structured, high-precision interpretation of price behavior within a controlled analytical environment. Developed through an independent architectural approach, ZIVA does not rely on, derive from, or replicate existing indicators. It represents a standalone
これはMT5のインジケーターで、再描画なしで取引に参入するための正確なシグナルを提供します。 外国為替、暗号通貨、金属、株式、インデックスなど、あらゆる金融資産に適用できます。かなり正確な見積もりを提供し、取引を開始して終了するのに最適な時期を教えてくれます。1つのシグナルを処理しただけでインジケーターの元が取れた例の 動画 (6:22)をご覧ください。Entry PointsPro インジケーターの助けを借りたほとんどのトレーダーの最初の1週間の結果が改善しています。 Telegramグループ に登録してください。Entry Points Proインジケーターのメリットは次の通りです。 再描画のないエントリーシグナル 再描画されるインジケーターでは一度表示されたシグナルが削除されて大きな金銭的損失につながることがありますが、これと異なり、表示されて確認されたシグナルは消えることがありません。 エラーなしの取引開始 インジケーターアルゴリズムによって取引を開始する(資産を売買する)理想的な瞬間を見つけることができます。それを使用するすべてのトレーダーの成功率が向上します。 あら
SunSignal ML — AI Gold Signals with Multi-Timeframe Confluence SunSignal ML is an advanced AI-powered signal indicator purpose-built for XAUUSD gold trading. It combines a proprietary adaptive trend algorithm with six machine learning models trained on confirmed price pivots to produce high-confidence entry signals with multi-timeframe validation. The indicator runs efficiently on M1, M5 and M15 timeframes and is designed for traders who want precision entries guided by data rather than guesswor
ICT PO3 (Power of 3) AMD Protocol Framework Indicator True Time & Structure Integration   |  Non-Repainting | Real-Time  | Multi-Asset  | MT4 Version Available Full Setup Guide & Strategy Playbook: https://www.mql5.com/en/blogs/post/768683 MT4 Version: https://www.mql5.com/en/market/product/171742 Indicator Overview The ICT PO3 AMD Protocol Framework is a complete structural overlay for MetaTrader 5 that maps the True Daily Cycle directly onto your lower-timeframe execution chart. It projects
Ultimate SMC Indicator
Hicham Mahmoud Almoustafa
1 (1)
Ultimate SMC Indicator v2.20 — Smart Money Concepts All-in-One Stop switching between 5 different indicators. Ultimate SMC gives you everything Smart Money traders need — in one clean indicator with interactive controls. GUIDE What makes this different? Most SMC indicators show you Order Blocks or FVGs separately. You still have to figure out which zones actually matter. Ultimate SMC does the hard work: it scans for Order Blocks, Fair Value Gaps, Liquidity Sweeps, Supply & Demand zones, Fibo
この位置が買いに適しているかどうかの判断をサポートします。 この位置が売りに適しているかどうかの判断をサポートします。 4つの指標が同時に底に達した場合は、反発のチャンスに注目してください。 4つの指標が同時に天井付近にある場合は、下落のチャンスに注目してください。 本システムは、中国の先進的なアルゴリズム技術と高度な数学モデリング体系に基づいて構築されています。 私は主に XAUUSD M5 でこの指標を使用しており、この時間足が最も良い結果を示します。 この指標のアルゴリズムと数式は非常に複雑なため、テスト時に動作が遅くなる場合があります。テストでは、リペイントの有無と遅れの有無を確認してください。正式版では実際の使用時により安定します。 この指標システムはリペイントせず、未来データも使用しません。ご購入前にご自身でテストしてご確認いただけます。 この指標には完全にカスタマイズ可能なアラートシステムが搭載されており、以下のリンクからご確認いただけます。 正式に使用する前に、完全な使用説明を十分にお読みください。 ご不明な点がございましたら、どうぞお早めにご連絡ください。できるだけ早
TPA True Price Action indicator reveals the true price action of the market makers through 100% non-repainting signals strictly at the close of a candle! TPA shows entries and re-entries, every time the bulls are definitely stronger than the bears and vice versa. Not to confuse with red/green candles. The shift of power gets confirmed at the earliest stage and is ONE exit strategy of several. There are available now two free parts of the TPA User Guide for our customers. The first "The Basics"
ARIScalp is a powerful trading companion designed to generate high-probability entry signals with dynamic TP/SL/DP levels based on volatility. Built-in performance tracking shows win/loss stats, PP1/PP2 hits, and success rates all updated live. Key Features: Buy/Sell signals with adaptive volatility bands Real-time TP/SL/DP levels based on ATR Built-in MA Filter with optional ATR/StdDev volatility Performance stats panel (Success, Profit/Loss, PP1/PP2) Alerts via popup, sound, push, or email Cus
MatchingLevel Consensus Indicator MetaTrader 5向け21シグナル意思決定支援ツール どのインジケーターを信頼すべきか悩む必要はありません。MatchingLevelは21の独立したテクニカルシグナルを単一のコンセンサススコアに統合し、モメンタム・トレンド・ボラティリティが一致している瞬間、そして対立している瞬間を一目で把握できます。 2021年から2025年のEUR/USD H1の過去データに対する反復的な統計最適化によりキャリブレーション済み。設計上リペイントしません——すべてのシグナルは確定足から読み取られます。 ——————————————————————— トレーダーが本インジケーターを選ぶ理由 1つの数値で完全な明瞭性——カラーコード化されたコンセンサスヒストグラムが、5つ以上のインジケーターを重ねる煩雑さを解消します 一致によるフィルタリング——複数の独立したシグナルが同じ方向を指す瞬間のみに集中できます 透明なスコアリング——21シグナルのうち、いくつが現在アクティブでどの方向を示しているかを常に確認できます リペイントなし——
このインジケーターは、市場で 関心が示されたゾーン をハイライトし、その後に 注文の蓄積ゾーン を表示します。 これは、大規模な**板情報(オーダーブック)**のように機能します。 これは、 巨大な資金 のためのインジケーターです。その性能は卓越しています。 市場にどんな関心が存在していても、 必ず目に見えるようになります 。 (これは 完全に再設計され、自動化されたバージョン です。もはや手動分析は必要ありません。) トランザクションスピード(取引速度) は新しい概念のインジケーターで、市場で大口注文が どこに・いつ 集中しているかを示し、それに基づいたチャンスを提供します。 トレンドの変化を 非常に早い段階 で察知することができます。 FXでは「出来高」と呼ばれているものは誤解されています。実際には、これは 時間あたりの価格変動量 です。したがって、正しい名称は トランザクションスピード です。 考え方・行動・分析の仕方すべてが問われます。 分析パラダイムの転換は非常に重要です。 このインジケーターは、FXにおける出来高の考え方を 根本から再定義 し、論理的な形で正確に活用する、
This Indicator creates a heatmap based on depth of market of the current symbol or another symbol. Other symbol is useful when you trade futures market and a contract has 'mini' and 'full' split. For example, in Brazil (B3 - BMF&Bovespa), WDO and DOL are future Forex contract of BRL/USD (where 1 DOL = 5 WDO) and big banks work mostly with DOL (where liquidity is important). Please use with M1 timeframe , objects are too small to be displayed at higher timeframes (MT5 limit). The number of level
作者のその他のプロダクト
DrMoxQuant EA Ultimate Version (MT5) How It Works: The DrMoxQuant EA Ultimate Version does not execute trades automatically. Instead, it analyzes the market chart and provides clear buy or sell signals, showing exact price levels for entry, pullback, take profit, and stop loss. It works as a trend tracker to help you make more accurate trading decisions. Advantages of DrMoxQuant EA Ultimate Version: Clear signals: Visual buy and sell alerts with precise price levels to guide your decisions. Ful
How It Works DoctorEdge Asia-London-NY Buy & Sell Arrows Breakout is a professional indicator that identifies real breakout signals during the three most important trading sessions: Asia, London, and New York . The indicator automatically draws: Vertical lines showing the start and end of each session. Dashed horizontal lines marking the highs and lows formed within each session. Based on this session structure, it generates automatic BUY & SELL arrows , pointing to potential breakout zones ,
DoctorEdge X-MAN Intraday Vision The Smart Indicator for Catching Breakouts and Reversals with Precision How It Works DoctorEdge X-MAN Intraday Vision was designed to help intraday and scalping traders identify key price movements — especially true breakouts and potential false breakouts with reversal . When the price breaks above or below one of the indicator’s lines , the line automatically moves , following the new price direction. You can use this behavior as a kind of dynamic break-ev
DoctorEdge V-LINE (Pump it & Dump it) Strategy Pro Confirms trend direction using smart momentum logic and key price behavior How It Works DoctorEdge V-LINE is a smart visual indicator designed to detect trend impulses and confirm their strength based on how price reacts around certain dynamic zones. Buy Trend: When price reaches level -20 , the line turns green , signaling a potential buy . If price breaks above level 0 and the line stays green, the uptrend is confirmed . If price doe
DoctorEdge Daily Levels Entry SL And TP Short Description: Advanced indicator for MetaTrader 5 that automatically calculates entry, stop loss, and take profit levels based on market data, facilitating technical analysis and trade planning. Long Description: The DoctorEdge Daily Levels Entry SL And TP is a technical indicator designed for traders seeking precision in defining entry points, stop loss, and take profit levels. It uses current market data to calculate: Entry (Entry): Stop Loss (SL)
フィルタ:
レビューなし
レビューに返信