BigPlayerBars

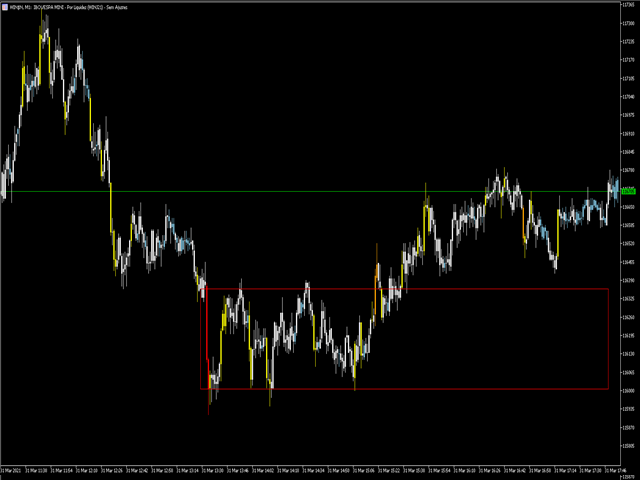
Se você já ouviu falar do Método de Wyckoff, Análise de dispersão de volume, etc., com certeza chegou até aqui para buscar o indicador que lhe faltava!! Nosso indicador é capaz de lhe mostrar a dispersão de volume negociado pelos grandes players durante todo o período de negociação!


E o grande diferencial deste tipo de abordagem é a capacidade que este indicador possui de lhe mostrar onde está armado o "ACAMPAMENTO" dos BigPlayers e, assim, tirar o melhor proveito em seus trades, entrando junto com eles e ganhando do mercado!


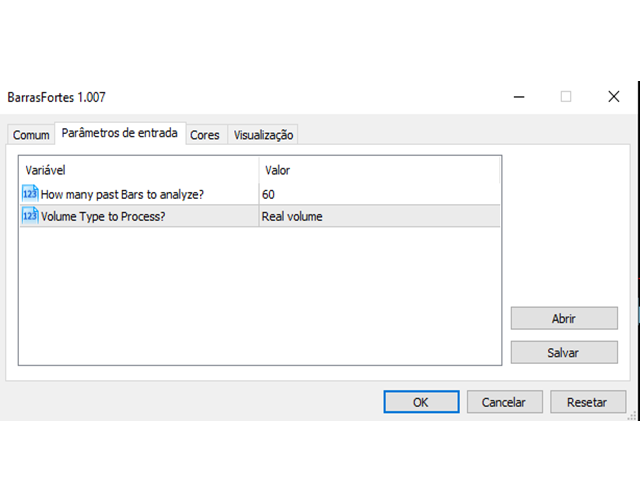
São 5 classificações de que você deve se atentar para obter sucesso:

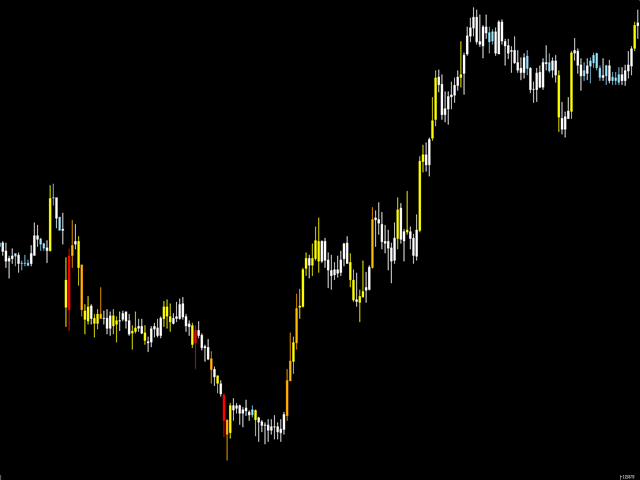
  1. Ultra Volume: É o candle mais esperado, onde temos a confirmação da atuação dos Grandes Players. Tem cor VERMELHA
  2. Alto Volume: É o candle que mostra interesse dos BigPlayers em realizar negociações naquele nível de preços. Tem cor LARANJA
  3. Médio Volume: Demonstra relativa negociação amadora. Tem cor AMARELA
  4. Baixo Volume: Demonstra falta de interesse de negociação. Tem cor BRANCA
  5. Fraco Volume: Demonstra ausência de interesse de negociação para o nível de preços. Tem cor AzulClaro

おすすめのプロダクト
Smart FVG Stats
- Md Rashidul Hasan
5 (1)
The  Smart FVG Statistics Indicator  is a powerful MetaTrader 5 tool designed to automatically identify, track, and analyze Fair Value Gaps (FVGs) on your charts. Love it? Hate it? Let me know in a review! Feature requests and ideas for new tools are highly appreciated. :) Try "The AUDCAD Trader": https://www.mql5.com/en/market/product/151841 Key Features Advanced  Fair Value Gap  Detection Automatic Identification : Automatically scans for both bullish and bearish FVGs across specified histo
FREE
Clear DOM
Oclair Gallacini Prado
Clear Dom This Indicator shows a pressure color box based on depth of market of the current symbol. Notice that it only works when book information is received. You decide weather you want or not to display higher (ask) and lower (bid) levels of book. The proportion ratio is calculated using volumes read from the book. You can read the actual pressure in the market any time. Indicator parameters: color_Ask -> ASK box color and ASK value line color color_Bid -> BID box color and BID value li
Time and Sales Tick
Pablo Filipe Soares De Almeida
Time & Sales Tick Indicator は、MetaTrader 5チャート上でリアルタイムのティック情報を表示するインジケーターです。 価格、ティック出来高、時刻を視覚的に確認でき、市場の動きを細かく分析することが可能です。 機能 価格、出来高、時間を含むティックデータをチャート上の専用パネルにリアルタイム表示します。 ティックをユーザーが設定した間隔でグループ化し、上昇ティックは緑色、下降ティックは赤色で色分け表示します。 パネルはチャートの4隅の任意の位置に配置でき、サイズや透明度の調整も可能です。 MetaTrader 5のすべてのシンボルおよびタイムフレームで使用可能で、軽量かつ安定した動作を実現しています。 このインジケーターは、スキャルピングや短期分析に特に適しています。
Percent Levels
Cinthia Regina De Moraes
Indicador tipo 2mv frequência mostra os níveis percentuais no mercado financeiro que tendem a ser zonas realmente importantes para os traders. Observem que o preço segue um fluxo e uma frequência que se enquadram em canais percentuais de movimento,  tradicionalmente traçados por níveis Fibonacci. O indicador LevelsPercent traça linhas em pontos específicos de percentual configurados pelo usuário e "pode" anteceder possíveis níveis de SUPORTE e RESISTÊNCIA. A leitura do mercado e a identificação
The   Visual Volatility Clustering   indicator clusters the market based on volatility. The indicator does not redraw and gives accurate data, does not use closing prices. Uses the opening prices or the highs or lows of the previous completed bar. Therefore, all information will be clear and unambiguous. The essence of the indicator is to divide the price market into certain areas according to a similar type of volatility. This can be done in any way. In this example, the indicator is configure
Anchored VWAP with Alert MT5
Trade The Volume Waves Single Member P.C.
5 (1)
What is the Volume Weighted Average Price (VWAP)? The volume weighted average price (VWAP) is a trading benchmark used by traders that gives the average price an instrument has traded at throughout the day, based on both volume and price.  It is important because it provides traders with insight into both the trend and value of the instrument. What is the Difference between VWAP and AVWAP? While VWAP is having as starting point the beggining of the day,week,month etc. in the AVWAP you can pla
If you like this project, leave a 5 star review. Follow on TikTok: @quantum.trader       [ Any Symbol Can Be ADDED ]       DM me for adding any Pair symbol, crypto, index, stock or anything related. you can also DM me in TikTok [@quantum.trader] Works on [ EURUSD-GBPUSD-GBPJPY-USDJPY-XAUUSD-US30-BTCUSD-ETHUSD-SOLUSD ] This indicator calculate and draw the Prediction or Forecast the peaks of the current day ( forecast high - forecast low - forecast middle - forecast upper q - forecast lower q
A Média Móvel é um indicador que faz parte da Análise Técnica. Com ela, é possível identificar o equilíbrio dos preços no mercado, observando tendências de alta, neutra ou baixa. Este indicador customizado traz opções extras pera definir o método de cálculo podendo-se esclolher entre SMA,EMA,SSMA,LWMA,JJMA,JurX,ParMA,T3,Vidya,AMA,HULL MA. Também conta com varias opções para escolher o método de cálculo para o preço base a ser usado no cáculo da média.
WAPV Box Effort x Result
Eduardo Da Costa Custodio Santos
MT5のWA_PV_BOX_EFFORTXRESULT WAPV Box Effort x Result Indicatorは、Package Indicatorsグループ(Wyckoff Academy Wave Market)の一部です。 MT5のWAPVボックスエフォートx結果インジケーターは、価格とボリュームを読み取るのに役立ちます。その読みは、努力×結果の特定を支援することで構成されています グラフによって作成された波で。 ボックスが緑色の場合のMT5のWAPVボックスの労力x結果インジケーターは、ボリュームが需要に有利であり、ボックスが赤色の場合を意味します ボリュームは供給に有利です。 ボックスが大きいほど、価格に対するボリュームの変位が大きくなります。価格の上昇波がボックスのサイズに比例しない場合、 努力×結果。 非常に視覚的な方法で、ボリュームと価格の間のこの相違を識別できます。 MT5のWAPVBoxEffort x Result Indicatorを使用すると、インジケーターをゼロ軸の下に配置することで、視覚化を向上させることもできます。 ティックボリュームとリア
インジケーター技術仕様 – Delta Profile for MetaTrader 5 Delta Profile は MetaTrader 5 用に開発されたインジケーターで、指定されたローソク足範囲内の出来高フローを詳細に分析するためのものです。異なる価格レベルにおける正の出来高(上昇に関連)と負の出来高(下降に関連)の不均衡を構造化し、可視化します。その結果、ユーザーは最も多くの取引が集中する価格帯や実際の市場不均衡が形成される領域を明確に把握できます。 以下に、本インジケーターの主要な技術特性と設定パラメータを示します。 基本コンセプト インジケーターは 価格レベル を識別し、それらを正の出来高、負の出来高、および純 Delta(正負の出来高差)に分類します。 各価格レベルは 水平バー としてチャートに表示され、市場の活動ゾーンや不均衡領域を視覚的に確認できます。 ユーザーは 分析対象ローソク足数 、 価格の丸め精度 、 最大表示レベル数 、および 表示スタイル を自由に設定できます。 主要機能 価格レベルのマッピング :設定された精度に基づき価格を丸め、対応するローソク足の
Key level wedge MT5
Presley Annais Tatenda Meck
The   Key level wedge MT5   indicator automatically draws rising wedge pattern and falling wedge pattern for you on the chart. This pattern is really good when used as a confirmation entry at key support & resistance, supply & demand and reversal zones. Advantages  The   Key level wedge MT5   block DOES NOT RE-PAINT, giving you confidence when a signal appears and also helps when looking back.  The   Key level wedge MT5   includes an on/off button on the chart to easily keep the charts clean
The VWAP indicator is our version of the popular Volume-Weighted Average Price indicator. The VWAP is the ratio between the value traded (price multiplied by the number of volume traded) and the total volume traded over a specific time period. As a result, it measures the average price of the instrument much better than the simple moving average. Although there are many ways to use the VWAP, most investors use it to calculate the daily average.  The indicator works in five modes: Moving  - In
Trading Utility for Forex Currency Pairs Only not for Gold  Functions Auto Lot Calculation based on Risk Auto stoploss  Auto TakeProfit Breakeven Auto Close Half % Close in percentage with respect to the PIPs Pending Orders BuyLimit Sell Limit with distances BuyStop Sell Stop    with distances Trading Informations Risk in percentage For Multiple trades Combine Takeprofit and Combine Stoplosses
Midas is the acronym for Market Interpretation / Data Analysis System is a trade approach started in 1995 by technical analyst Paul Levine and later developed by Andrew Coles, PhD and David Hawkins. Learn more in the book MIDAS Technical Analysis: A VWAP Approach to Trading and Investing in Today's Markets , (I saw that it is possible buy via Amazon). The positive points in relation to the Midas-based indicators are the prediction of movement reversal points, the negative point is the subjectivi
The volume weighted average price (VWAP) is a trading benchmark used by traders that gives the average price a security has traded at throughout the day, based on both volume and price. It is important because it provides traders with insight into both the trend and value of a security. This version is simple to use as we simplify the indicator entries and leave only the most used buffers. You can use it to integrate with your EA          Product Features Daily VWAP ploted at the chart. MOnthly
White Weis Volume This indicator shows the sum of the volume in each wave, bulish or bearish, as idealized by David Weis , but it brings an important addition , which is the marking of the bar with the highest volume of the wave (White Bar)! In coding the indicator, it was sought to optimize the code to require minimal processing during use and not to overload mt5. The indicator can be used for pre-trading analysis and study, where the trader analyzes possible points of support and resistance
Smart Adaptive Renko Pro – Dynamic ATR & Fixed Box Renko Indicator Smart Adaptive Renko Pro is a powerful non-time-based Renko indicator designed to eliminate market noise and reveal true price momentum with precision. Unlike standard chart candles, this indicator builds Renko bricks based purely on price movement — helping traders focus on trend strength, reversals, and clean breakout structures. Key Features Adaptive ATR-Based Box Size (Auto-adjusts to market volatility) Fixed Pip Box M
Simple Vwap with the daily, weekly and monthly VWAP is the abbreviation for   volume-weighted average price , which is a technical analysis tool that shows the ratio of an asset's price to its total trade volume. It provides traders and investors with a measure of the average price at which a stock is traded over a given period of time. How it's used Identify entry and exit points:   Traders can use VWAP to determine when to buy or sell an asset.   Understand price trends :  Traders can use V
FREE
The Metatrader 5 has a hidden jewel called Chart Object, mostly unknown to the common users and hidden in a sub-menu within the platform. Called Mini Chart, this object is a miniature instance of a big/normal chart that could be added/attached to any normal chart, this way the Mini Chart will be bound to the main Chart in a very minimalist way saving a precious amount of real state on your screen. If you don't know the Mini Chart, give it a try - see the video and screenshots below. This is a gr
市場ボリュームプロファイル指標 + スマートオシレーター。通貨ペア、株式、先物、暗号資産など、ほぼすべての銘柄で動作し、リアルボリュームとティックボリュームの両方に対応しています。プロファイル作成範囲は、1週間や1ヶ月などの自動設定のほか、境界線(赤と青の2本の垂直線)を動かして手動で設定することも可能です。ヒストグラム形式で表示され、特定の価格レベルにおけるヒストグラムの幅は、その価格帯で行われた取引量(約定数)を表します。 Mode level line color パラメータを使用すると、価格が反発する可能性が高い重要なボリュームレベルを自動表示できます。また、 Maximum color パラメータは、指定した範囲全体で最も取引が集中した最大ボリュームレベルを個別に表示します。 スマートオシレーターは買われすぎ・売られすぎのゾーンを表示します。複数のインジケーターからの情報を分析し、処理されたデータに基づいて、買われすぎと売られすぎのゾーンを対応する色で塗りつぶします。 Volume every day では、 Range period パラメータでプロファイル作成の時間間隔を
Weighted average price indicator or VWAP. The well-known standard VWAP with the beginning of the day is added with the function of selecting the periodization. It can be calculated both every day and on other periods. Also the indicator allows to exclude the volume from the calculation, which will allow using it on the cryptocurrencies and forex. There is an alert for a VWAP price crossing. There are 1 and 2 standard deviation. Settings: Volume: turning volume on and off in the calculation mecha
概要 このインジケーターは、クラシックな ドンチャンチャネル を強化したバージョンで、実践的なトレード機能を追加しています。 標準の3本線(上限、下限、中央線)に加え、 ブレイクアウト を検出し、チャート上に矢印で視覚的に表示します。また、チャートを見やすくするために、 現在のトレンド方向と逆側のラインのみを表示 します。 インジケーターの機能: 視覚的シグナル :ブレイクアウト時にカラフルな矢印を表示 自動通知 :ポップアップ、プッシュ通知、Eメール RSIフィルター :市場の相対的な強弱に基づいてシグナルを検証 カスタマイズ可能 :色、ラインの太さ、矢印コード、RSI閾値など 動作原理 ドンチャンチャネルは次のように計算します: 上限線 :直近N本のクローズ済みローソク足の最高値 下限線 :直近N本のクローズ済みローソク足の最安値 中央線 :最高値と最安値の平均値 上方ブレイクアウト は終値が上限線を超えたときに発生し、 下方ブレイクアウト は終値が下限線を下回ったときに発生します。 インジケーターは以下を行います: 3本のドンチャンラインを描画 方向転換後の最初のブレイクアウト
FREE
Volume Waves
Paulo Henrique Faquineli Garcia
One of the best tools for analyzing volume, Weis Wave was devised by David Weis to facilitate reading the directional flow. For the disciples of the Wyckoff method, this means an evolution, facilitating a predictive reading of the market, always looking for Accumulation and Distribution zones for traded assets. For better understanding, in this indicator we try to cover every reading of EFFORT (traded volume) versus RESULT (price change). Thus, you can apply the indicator on the chart twice to
The indicator highlights the points that a professional trader sees in ordinary indicators. VisualVol visually displays different volatility indicators on a single scale and a common align. Highlights the excess of volume indicators in color. At the same time, Tick and Real Volume, Actual range, ATR, candle size and return (open-close difference) can be displayed. Thanks to VisualVol, you will see the market periods and the right time for different trading operations. The indicator displays: T
Japanese コードの利点の説明(コード自体には触れずに) 1. 市場環境の詳細な分析(3次元) 単に「上昇」「下降」を示すだけでなく、**「レンジ(横ばい)」**の勢いを分離して表示します。 買い圧力が強い時(強気) 売り圧力が強い時(弱気) 重要: 方向感がない時(レンジ相場)を可視化し、無駄なエントリーを減らせます。 2. オシレーターによる強弱測定 (0-100) 価格変動を0~100の範囲で正規化します。 極端なゾーン: 買われすぎ/売られすぎ(例:80以上、20以下)を定義。 エリアの塗りつぶし: ピーク時に色がつくため、視覚的に判断しやすいです。 3. ノイズ除去の柔軟性(スムージングと加重) だましの回避: 移動平均の種類(RMA, EMA, SMA等)を選んで、細かいノイズを除去できます。 出来高(Volume)加重: 出来高を計算に含めるオプションがあり、信頼性を高めます。 4. 明確な視覚シグナル クロスアロー(矢印): 買いと売りの勢いが逆転した時に矢印を表示します。 表示切り替え: 線や塗りつぶしをON/OFFしてチャートを整理できます。 5. パフォーマ
Features 3 types of waves: bullish, bearish and unknown. The unknown tower comes when prices move in opposite the direction of the current tower. Label that shows the percentage remaining for the next tower. Allows you set the type of volume that will be accumulated in the towers, either real or tick volumes. Thus, the indicator works in any market, for example: stocks, futures, forex, commodities, etc. Allows you to set the required score for the tower exchange. Allows you to set the font size
Session Finder – Track Forex Market Sessions with Precision Stay ahead of the market with Session Finder , a sleek HUB style design for MetaTrader 5. It provides real-time visibility into the world’s major trading sessions—Sydney, Tokyo, London, and New York—so you always know which markets are open, closed, or about to change. Key Features: Live Session Status: See whether a session is currently open or closed at a glance. Countdown Timers: Track exactly how long until a session opens or close
NeuroExt
Dmytryi Voitukhov
4 (11)
https://t.me/mql5_neuroExt   actual version Signal https://www.mql5.com/ru/signals/1511461 You can use any tool. The bases will be automatically created at the start of the Learn. If you need to start learning from 0 - just delete the base files. Initial deposit - from 200 ye. Options: DO NOT ATTEMPT TO TEST WITHOUT NEURAL NETWORK TRAINING! it is enough for the balance graph after training to be horizontal. generating a training base is extremely simple.  there is a ready-made training for U
FREE
The indicator measures the balance of aggression. The formula is as follows:   Aggression  = Purchase Volume - Sales Volume. Note : It is rec ommended to use the default configuration and VPS values. It does not work in Forex. Meet Our Products     Parameters : Numbers of days prior to the current one for calculation; Volume Divider e; Enables calculation of the current candle; Histogram Line style and; Size; Line Line style and; Size;  Follow us on our website to check the next news.
**   All Symbols   x   All Time frames   scan just by pressing scanner button ** Discount: The price is $50$, But now it is just $35, Limited time offer is active. *** Contact me  to send you instruction and add you in "Swing scanner group" for sharing or seeing experiences with other users. Swing EA:  https://www.mql5.com/en/market/product/124747 Introduction: Swing Scanner   is the indicator designed to detect swings in the direction of the trend and possible reversal swings. The indicator st
このプロダクトを購入した人は以下も購入しています
SuperScalp Pro
Van Minh Nguyen
4.57 (21)
SuperScalp Pro – 高度なマルチフィルタースキャルピングインジケーターシステム SuperScalp Pro は、クラシックな Supertrend と複数のインテリジェント確認フィルターを組み合わせた高度なスキャルピングインジケーターです。M1 から H4 まで複数の時間足で効率的に動作し、XAUUSD、BTCUSD、主要 Forex 通貨ペア向けに最適化されています。 このインジケーターは明確な Buy / Sell シグナルを提供し、ATR に基づいてエントリー価格、Stop Loss、Take Profit を自動計算します。Fibonacci Take Profit 機能により、重要な価格帯で早期決済し、到達時に通知を送信します。 初期設定では Fibonacci Take Profit が有効化されており、より安定した取引体験を重視しています。チャートに適用するだけですぐ利用可能です。上級者向けに、すべてのパラメータは自由にカスタマイズできます。 EMA、RSI、ADX、Volume、VWAP、Bollinger Bands、MACD Divergence な
このインジケーターを購入された方には、以下の特典を 無料 で提供しています: 各トレードを自動で管理し、ストップロスとテイクプロフィットを設定し、戦略ルールに基づいてポジションを決済する補助ツール 「Bomber Utility」 様々な銘柄に合わせたインジケーターの設定ファイル(セットファイル) 「最小リスク」、「バランスリスク」、「待機戦略」 の3つのモードで使用できる Bomber Utility 用の設定ファイル このトレーディング戦略をすぐに導入・設定・開始できる ステップバイステップのビデオマニュアル ご注意: 上記の特典を受け取るには、MQL5のプライベートメッセージシステムを通じて販売者にご連絡ください。 オリジナルのカスタムインジケーター 「Divergence Bomber(ダイバージェンス・ボンバー)」 をご紹介します。これは、MACDのダイバージェンス(乖離)戦略に基づいた 「オールインワン」型のトレーディングシステム です。 このテクニカルインジケーターの主な目的は、価格とMACDインジケーターの間に発生するダイバージェンスを検出 し、将来の価格の動きを示す
Entry In The Zone and SMC Multi Timeframe is a real-time 2-in-1 market analysis tool that combines market structure analysis and a No Repaint BUY / SELL signal system into a single indicator, built on Smart Money Concepts (SMC) — a widely adopted framework used by professional traders to understand market structure. This indicator helps you see the market more clearly, make decisions based on structure rather than guesswork, and focus on high-probability zones where price is more likely to react
Power Candles V3 - 初の自己最適化ストレングス・インジケーター Power Candles V3 は、ストレングス分析をそのままトレード可能なシステムへと変えます。チャートを市場の強さで色分けするだけでなく、バックグラウンドでリアルタイムの自動最適化を実行し、あなたの銘柄に最適な Stop Loss、Take Profit、シグナル閾値を提示します。ワンクリックでライブトレードに適用できます。 このツールは Stein Investments エコシステムの一部です。  18 種のツール一覧、AI によるセットアップ提案、  そしてコミュニティ参加はこちら: https://stein.investments Version 3 の新機能 - AUTO-OPTIMIZER チャート読み込み時、そして各バーの確定ごとに、Power Candles V3 は該当銘柄の過去データ上で 3,000 を超えるトレードの組み合わせ をシミュレーションします: 2 つの戦略 を並列でテスト: Momentum (MOM) と Reversal (REV) 3 段階のシグナル閾値
優れたテクニカルインジケーター「Grabber」をご紹介します。これは、すぐに使える「オールインワン」トレーディング戦略として機能します。 ひとつのコードに、市場のテクニカル分析ツール、取引シグナル(矢印)、アラート機能、プッシュ通知が強力に統合されています。 このインジケーターを購入された方には、以下の特典を無料で提供します: Grabberユーティリティ:オープンポジションを自動で管理するツール ステップバイステップのビデオマニュアル:インジケーターのインストール、設定、取引方法を解説 カスタムセットファイル:インジケーターをすばやく自動設定し、最大限の成果を出すための設定ファイル 他の戦略はもう忘れてください!Grabberだけが、あなたを新たなトレードの高みへと導いてくれるのです。 Grabber戦略の主な特徴: 推奨タイムフレーム:M5〜H4 対応通貨ペア・資産:どれでも使用可能ですが、私が実際に検証した以下を推奨します(GBPUSD、GBPCAD、GBPCHF、AUDCAD、AUDUSD、AUDSGD、AUDCHF、NZDUSD、NZDCAD、EURCAD、EURUSD、E
このインジケーターを購入すると、プロ仕様のトレードマネージャーを無料で差し上げます。 まず第一に、このトレーディングシステムがノンリペイント、ノンリドロー、ノンラグのインジケーターであることを強調する価値がある。これにより、手動取引とロボット取引の両方に理想的なものになっています。 オンラインコース、マニュアル、プリセットのダウンロード。 「スマートトレンドトレーディングシステム MT5」は、新規および経験豊富なトレーダー向けにカスタマイズされた包括的なトレーディングソリューションです。10以上のプレミアムインジケーターを組み合わせ、7つ以上の堅実なトレーディング戦略を備えており、多様な市場状況に対応する多目的な選択肢となっています。 トレンドフォロー戦略:トレンドを効果的に乗り越えるための正確なエントリーとストップロス管理を提供します。 リバーサル戦略:潜在的なトレンドの反転を特定し、トレーダーがレンジ相場を活用できるようにします。 スキャルピング戦略:高速で正確なデイトレードおよび短期取引のために設計されています。 安定性:すべてのインジケーターはノンリペイント、ノンリドロー、ノ
SignalTech MT5 is a trading system for EURUSD, USDCHF, USDJPY, AUDUSD, NZDUSD, EURJPY, AUDJPY, NZDJPY, CADJPY H2 and H3 Timeframe.  It can generate signals with Buy/Sell Arrows and Pop-Up/Sound Alerts. Each signal has clear Entry and Stop Loss levels, which should be automatically flagged on the chart, as well as potential Targets 1, 2, and 3. The Entry and TP levels are fixed after the trade is taken. The exit level is dynamic. If there are signs of a potential short-term trend reversal, the
Quantum TrendPulse を ご紹介します。これは、   SuperTrend   、   RSI   、および Stochastic のパワーを 1 つの包括的なインジケーターに組み合わせて、取引の可能性を最大限に引き出す究極の取引ツールです。精度と効率を求めるトレーダー向けに設計されたこのインジケーターは、市場のトレンド、勢いの変化、最適なエントリー ポイントとエグジット ポイントを自信を持って特定するのに役立ちます。 主な特徴: SuperTrend 統合: 現在の市場動向に簡単に追従し、収益性の波に乗ることができます。 RSI精度: 買われすぎと売られすぎのレベルを検出し、市場の反転のタイミングに最適で、SuperTrendのフィルターとして使用されます。 確率的精度: 確率的振動を活用して、変動の激しい市場で隠れたチャンスを見つけます。SuperTrend のフィルターとして使用されます。 マルチタイムフレーム分析:   M5 から H1 または H4 まで、さまざまなタイムフレームで市場を常に把握します。 カスタマイズ可能なアラート: カスタム取引条件が満たされ
Gann Made Easy   は、ミスター・ギャンの理論を使用した取引の最良の原則に基づいた、プロフェッショナルで使いやすい外国為替取引システムです。 W・D・ガン。このインジケーターは、ストップロスとテイクプロフィットレベルを含む正確な買いと売りのシグナルを提供します。 PUSH通知を利用して外出先でも取引可能です。 ご購入後、取引方法の説明と優れた追加インジケーターを無料で入手するには、私にご連絡ください! おそらく、ギャンの取引手法についてはすでに何度も聞いたことがあるでしょう。通常、ギャンの理論は初心者のトレーダーだけでなく、すでにある程度の取引経験がある人にとっても非常に複雑なものです。なぜなら、ギャンの取引手法は理論的にはそれほど簡単に適用できるものではないからです。私はその知識を磨き、最良の原則を私の外国為替インジケーターに組み込むために数年を費やしました。 このインジケーターは非常に簡単に適用できます。必要なのは、それをチャートに添付し、簡単な取引推奨事項に従うだけです。このインジケーターは常に市場分析の仕事を行い、取引の機会を探します。適切なエントリーポイントを検
これはMT5のインジケーターで、再描画なしで取引に参入するための正確なシグナルを提供します。 外国為替、暗号通貨、金属、株式、インデックスなど、あらゆる金融資産に適用できます。かなり正確な見積もりを提供し、取引を開始して終了するのに最適な時期を教えてくれます。1つのシグナルを処理しただけでインジケーターの元が取れた例の 動画 (6:22)をご覧ください。Entry PointsPro インジケーターの助けを借りたほとんどのトレーダーの最初の1週間の結果が改善しています。 Telegramグループ に登録してください。Entry Points Proインジケーターのメリットは次の通りです。 再描画のないエントリーシグナル 再描画されるインジケーターでは一度表示されたシグナルが削除されて大きな金銭的損失につながることがありますが、これと異なり、表示されて確認されたシグナルは消えることがありません。 エラーなしの取引開始 インジケーターアルゴリズムによって取引を開始する(資産を売買する)理想的な瞬間を見つけることができます。それを使用するすべてのトレーダーの成功率が向上します。 あら
Azimuth Pro
Ottaviano De Cicco
5 (7)
Azimuth Pro V2:MT5向けシンセティック・フラクタル構造分析と確認済みエントリー 概要 Azimuth Pro は Merkava Labs によるマルチレベルスイング構造インジケーターです。4つのネストされたスイングレイヤー、スイングアンカーVWAP、ABCパターン検出、3タイムフレーム構造フィルタリング、そして確定バーでの確認済みエントリー — 1つのチャートで、ミクロスイングからマクロサイクルまでを網羅するワークフロー。 これはブラインドシグナル製品ではありません。ロケーション、コンテキスト、タイミングを重視するトレーダーのための構造ファーストワークフローです。 V2発売記念オファー — Azimuth Pro V2をUSD 399で(次の100本)。最終価格:USD 499。 1. V2での変更点 シンセティック・マルチタイムフレームエンジン 上位タイムフレーム分析をMeridian Proと同じ独自のシンセティックアーキテクチャで一から再構築。よりクリーンなHTFコンテキスト、安定したライブ動作、従来のMTF同期問題なし。シンセティックエンジンは 固定比率タ
FX Trend NG:次世代マルチマーケット・トレンドインテリジェンス 概要 FX Trend NG は、複数の時間足に対応したプロフェッショナル向けトレンド分析およびマーケット監視ツールです。 市場全体の構造を数秒で把握することができます。 複数のチャートを切り替える必要はありません。どの銘柄がトレンド中なのか、どこでモメンタムが弱まっているのか、そしてどの時間足で強い整合性があるのかを瞬時に確認できます。 ローンチ特別オファー – FX Trend NG を $30(6ヶ月) または $80 永久ライセンス でご利用いただけます。 すでに Stein Investments のユーザーですか? -> メッセージを送信 して、プライベートグループへアクセスしてください。 セットアップや詳細情報が必要ですか? -> Stein Investments 公式ページ をご覧ください。 1. FX Trend NG が他と異なる理由 3ステート・トレンドロジック ― Buy と Sell だけではない • 多くのインジケーターは Buy または Sell の2状態のみを表示します。
マーケットメーカーのためのツール。 Meravith は次の機能を提供します: すべての時間足を分析し、現在有効なトレンドを表示します。 強気と弱気の出来高が等しくなる流動性ゾーン(出来高均衡)を強調表示します。 異なる時間足のすべての流動性レベルをチャート上に直接表示します。 テキスト形式の市場分析を生成し、参考情報として表示します。 現在のトレンドに基づいて目標値、サポートレベル、ストップロスを計算します。 取引のリスクリワード比を算出します。 口座残高に基づいてポジションサイズを計算し、潜在的な利益を推定します。 また、市場に大きな変化があった場合には警告を表示します。 インジケーターの主要ライン: 強気/弱気の出来高エグゾーストライン ― 目標値として機能します。 市場のトレンドを示すライン。市場が強気か弱気かによって色が変わり、トレンドのサポートとして機能します。主にその色が市場センチメントを示します。 出来高均衡ライン(Eq)。Eq(Volume Equilibrium)ラインはシステムの中核です。これは買い手と売り手の出来高のバランスポイントを表します。市場の流動性を示し
BTMM State Engine Pro is a MetaTrader 5 indicator for traders who use the Beat The Market Maker approach: Asian session context, kill zone timing, level progression, peak formation detection, and a multi-pair scanner from a single chart. It combines cycle state logic with a built-in scanner dashboard so you do not need the same tool on many charts at once. What it does Draws the Asian session range; session times can follow broker server offset or be set in inputs. Tracks level progression (L
トレンド スクリーナー インジケーターでトレンド取引の力を解き放ちます。ファジー ロジックと複数通貨システムを活用した究極のトレンド取引ソリューションです。 ファジー ロジックを活用した革新的なトレンド インジケーターである Trend Screener を使用して、トレンド取引を向上させます。 これは、13 を超えるプレミアム ツールと機能、および 3 つの取引戦略を組み合わせた強力なトレンド追跡インジケーターであり、Metatrader をトレンド アナライザーにする多用途の選択肢となります。 期間限定オファー : トレンド スクリーナー インジケーターは、わずか 100 ドルで生涯ご利用いただけます。 (元の価格 50$ ) (オファー延長) Trend Screener の 100% 非再描画精度の揺るぎない精度を体験して、取引の決定が過去の価格変動の影響を受けないようにしてください。 マルチタイムフレームおよびマルチ通貨機能の多用途性を解放し、比類のない自信を持って外国為替、商品、暗号通貨、インデックスの世界を取引できるようにします。 Trend Screener の包括的な
まず第一に、この取引インジケーターは再描画されず、再描画されず、遅延しないことを強調する価値があります。これにより、手動取引とロボット取引の両方に理想的なものになります。 ユーザーマニュアル:設定、入力、戦略。 アトミックアナリストは、価格の強さとモメンタムを利用して市場でより良いエッジを見つけるためのPA価格アクションインジケーターです。ノイズや誤ったシグナルを除去し、取引ポテンシャルを高めるための高度なフィルターを備えています。複雑なインジケーターの複数のレイヤーを使用して、アトミックアナリストはチャートをスキャンし、複雑な数学的計算をシンプルなシグナルと色に変換します。これにより、どのような初心者トレーダーでも理解して使用し、一貫した取引の決定を行うことができます。 「アトミックアナリスト」は、新規および経験豊富なトレーダー向けにカスタマイズされた包括的な取引ソリューションです。プレミアムインジケーターとトップノッチの機能を1つの取引戦略に組み合わせ、すべてのタイプのトレーダーにとって汎用性のある選択肢にします。 デイリートレーディングとスキャルピング戦略:高速で正確なデイ
ご紹介     Quantum Breakout PRO は 、ブレイクアウト ゾーンの取引方法を変革する画期的な MQL5 インジケーターです。 13年以上の取引経験を持つ経験豊富なトレーダーのチームによって開発されました。     クォンタム ブレイクアウト プロ   は、革新的でダイナミックなブレイクアウト ゾーン戦略により、あなたのトレーディングの旅を新たな高みに押し上げるように設計されています。 クォンタム ブレイクアウト インジケーターは、5 つの利益ターゲット ゾーンを備えたブレイクアウト ゾーン上のシグナル矢印と、ブレイクアウト ボックスに基づいたストップロスの提案を提供します。 初心者トレーダーにもプロのトレーダーにも適しています。 量子EAチャネル:       ここをクリック 重要!購入後、インストールマニュアルを受け取るためにプライベートメッセージを送ってください。 推奨事項: 時間枠: M15 通貨ペア: GBPJPY、EURJPY、USDJPY、NZDUSD、XAUUSD アカウントの種類: ECN、Raw、またはスプレッドが非常に低い R
Bill Williams Advanced is designed for automatic chart analysis using Bill Williams' "Profitunity" system. The indicator analyzes four timeframes at once. Manual (Be sure to read before purchasing) Advantages 1. Analyzes the chart using Bill Williams' "Profitunity" system. Signals are displayed in a table in the corner of the screen and on the price chart. 2. Finds all known AO and AC signals, as well as zone signals. Equipped with a trend filter based on the Alligator. 3. Finds "Divergence Bar
OmniSync Projection
Antonio-alin Teculescu
5 (1)
Chronos Fractal Engine is an innovative price projection indicator for MetaTrader 5, designed to transform your technical analysis by intelligently identifying and projecting historical price patterns. Built upon an advanced correlation algorithm and the fractal principles of the market, this powerful tool visualizes potential future price movements, giving you a unique edge in your trading decisions. What is Chronos Fractal Engine? At its core, the Chronos Fractal Engine employs a sophisticat
まず正直に言いましょう。 どんなインジケーターも、それ単体であなたを利益化させることはできません。もしそう言う人がいるなら、それは夢を売っているだけです。完璧な売買シグナル(矢印)を表示するインジケーターは、いくらでも“完璧に見せる”ことができます。正しい過去の区間を拡大して、勝ちトレードだけを切り取ればいいだけです。私たちはそれをしません。 SMC Intraday Formula はツールです。 市場構造を読み取り、最も高い確率の価格ゾーンを特定し、今この瞬間のスマートマネーの痕跡をシンプルな言葉で正確に示します。最終判断はあなたが行います。トレードを実行するのもあなたです。しかし今は「希望」ではなく「精度」でエントリーできます。 私たちはこのインジケーターを、ゴールド(XAUUSD)および主要FX通貨ペアで約3年間、日々のスキャルピングに使用してきました。M1、M5、M15、M30の主要ツールです。これは未来を予測しようとするのではなく、今まさに形成されている高確率セットアップを示し、その理由を説明します。 他のすべてのインジケーターと何が違うのか? ほとんどのトレーディングイ
FX Power: 通貨の強弱を分析して、より賢い取引を実現 概要 FX Power は主要通貨と金の実際の強弱をあらゆる市場状況で理解するための必須ツールです。強い通貨を買い、弱い通貨を売ることで、 FX Power は取引の意思決定を簡素化し、高い確率の取引機会を見出します。トレンドを追従する場合でも、極端なデルタ値を使用して反転を予測する場合でも、このツールはあなたの取引スタイルに完全に適応します。ただ取引するだけではなく、 FX Power で賢く取引をしましょう。 1. なぜ FX Power がトレーダーにとって非常に有益なのか 通貨と金のリアルタイム強弱分析 • FX Power は主要通貨と金の相対的な強弱を計算し、マーケットダイナミクスに関する明確な洞察を提供します。 • どの資産がリードしているか、または後れを取っているかを監視して、取引するペアを賢く選びましょう。 マルチタイムフレームの包括的なビュー • 短期、中期、長期のタイムフレームで通貨と金の強弱を追跡し、マーケットトレンドに基づいて取引戦略を調整できます。 • スキャルピングからスイングトレード
Crystal Heikin Ashi Signals - Professional Trend & Signal Detection Indicator Advanced Heikin Ashi Visualization with Intelligent Signal System for Manual & Automated Trading Final Price: $149 ---------> Price goes up $10 after every 10 sales . Limited slots available — act fast . Overview Crystal Heikin Ashi Signals is a professional-grade MetaTrader 5 indicator that combines pure Heikin Ashi candle visualization with an advanced momentum-shift detection system. Designed for both manual traders
Trend Ai indicatorは、トレンドの識別と実用的なエントリポイントと反転アラートを組み合わせることで、トレーダーの市場分析を強化する優れたツールです。 この指標は、ユーザーが自信と正確さで外国為替市場の複雑さをナビゲートすることを可能にします トレンドAiインジケーターは、主要なシグナル以外にも、プルバックやリトレースメント中に発生するセカンダリエントリポイントを識別し、トレーダーが確立されたトレンド内の価格修正を活用できるようにします。 重要な利点: *MT4およびMT5の仕事 *明確な買いまたは売りシグナル *再描画しません ·すべての資産で動作します 私はeaやセットをtelegram it詐欺で販売しないように注意してください。 すべての設定はここでブログで無料です。  重要! 指示とボーナスを得るために購入後すぐに私に連絡してください! 私の他のプロダクトと同様、実質操作の監視はここに見つけることができます: https://www.mql5.com/en/users/mechanic/seller&nbsp ; 設定および入力: すべての
Market Structure Order Block Dashboard MT5 は、市場構造と主要な価格反応ゾーンをチャート上で直接読み取りたいトレーダー向けに設計された MT5 インジケーターです。BOS、ChoCH、オーダーブロック、Fair Value Gap (FVG)、流動性、Kill Zones、Volume Profile、そして素早い分析のためのコンパクトなダッシュボードを組み合わせています。 本インジケーターは、市場構造、ICT、Smart Money の概念を意思決定の枠組みとして使用するトレーダーを対象としています。トレンド継続、反転の可能性、価格の不均衡、流動性ターゲット、注目ゾーンをより構造的に特定する助けとなります。 購入者向けの付属リソース 購入後、MQL5 のプライベートメッセージにてご依頼いただくと、完全な PDF ユーザーガイドとパラメータ設定のヒントを提供いたします。MQL5 のプライベートメッセージによる直接的な技術サポート。 バージョン 1.20 では 2 つの重要な追加機能があります: Pending BOS / Pending Cho
あなたのシンボルでどの戦略が実際に機能するか確認しましょう - リアルマネーをリスクにさらす前に。 Power Barは、あらゆるシンボルとあらゆるタイムフレームで 極端な価格バー を検出し、3つの異なるトレード戦略を即座にバックテストします。勝率、プロフィットファクター、損益を並べて比較できます。すべてが1つのインタラクティブなパネルに集約されています。 推測なし。カーブフィッティングなし。データだけです。 Power Barが特別な理由 ほとんどのインジケーターはシグナルを出すだけで、それが機能するかどうかは推測に任されます。Power Barはさらに先を行きます - すべてのシグナルを 3つの戦略 に対してテストし、統計を表示します。FlipFlop、Momentum、Reversalをワンクリックで切り替え、数値が即座に変化するのを確認できます。 FlipFlop - 常にポジションを保有。シグナルでエントリーし、反対シグナルでイグジット。当社のリサーチでは、US30、US500、DAXなどのトレンドのあるインデックスで最も効果的です。 Momentum - シグナルの方向に
Gartley Hunter Multi - An indicator for searching for harmonic patterns simultaneously on dozens of trading instruments and on all possible timeframes. Manual (Be sure to read before purchasing) | Version for MT4 Advantages 1. Patterns: Gartley, Butterfly, Shark, Crab. Bat, Alternate Bat, Deep Crab, Cypher 2. Simultaneous search for patterns on dozens of trading instruments and on all possible timeframes 3. Search for patterns of all possible sizes. From the smallest to the largest 4. All fou
このダッシュボードは、選択されたシンボルの最新の利用可能なハーモニックパターンを表示するので、時間を節約し、より効率的に /   MT4バージョン 。 無料インジケーター:   Basic Harmonic Pattern インジケーター列 Symbol : 選択したシンボルが表示されます。 Trend :   強気または弱気 Pattern : パターンの種類(ガートレー、バタフライ、バット、カニ、サメ、サイファー、ABCD) Entry : エントリー価格 SL: ストップロス価格 TP1: 1回目の利食い価格 TP2: 2回目の利食い価格 TP3:   3回目の利食い価格 Current price :   現在値 Age (in bars):    最後に描画されたパターンの年齢 主な入力項目 Symbols:   "28 Major Currency Pairs "または "Selected Symbols "から選択。 Selected Symbols:   カンマで区切られた監視したいシンボル("EURUSD,GBPUSD,XAUUSD")。ブローカーがペアに接
ARICoin is a powerful trading companion designed to generate high-probability entry signals with dynamic TP/SL/DP levels based on volatility. Built-in performance tracking shows win/loss stats, PP1/PP2 hits, and success rates all updated live. Key Features: Buy/Sell signals with adaptive volatility bands Real-time TP/SL/DP levels based on ATR Built-in MA Filter with optional ATR/StdDev volatility Performance stats panel (Success, Profit/Loss, PP1/PP2) Alerts via popup, sound, push, or email Cust
メタポイントプロ   これは、取引における推測を排除し、市場が既に決定を下したポイントを示すトレンドフォローツールです。この指標は、トレンド、動向、構造が変化する重要なポイントを特定し、主要プレーヤーがポジションを取るべき価格の戻り領域を強調表示します。 単に値動きを見るだけでなく、その背後にある論理を理解できます。すべてのシグナルはローソク足が確定した後に記録され、再描画されることなくチャート上に保存されるため、自信を持って状況を分析し、意思決定を行うことができます。トレード目標(利益確定)も表示されます。 この指標の有効性について完全に確信を持っていただくために、自動統計機能をご利用いただけます。 方向転換のたびに、インジケーターはストップロスレベルとそのインテリジェントな段階的移動(Move SL)も表示します。これは非常に重要です。     削減する   リスク   ポジション別。 損切り/利益確定/リスクリワード 右側に内蔵されたパネルには、現在の世界的なトレンドの方向における市場参入ポイントが表示され、過去のデータからもこれらのシグナルが確認できます。 任意の時間枠/ツール
「 Dynamic Scalper System MT5 」インジケーターは、トレンド波の中でスキャルピング取引を行う手法のために設計されています。 主要通貨ペアと金でテスト済みで、他の取引商品との互換性があります。 トレンドに沿った短期的なポジションオープンのシグナルを提供し、追加の価格変動サポートも提供します。 インジケーターの原理 大きな矢印はトレンドの方向を決定します。 トレンド波の中では、小さな矢印の形でスキャルピングシグナルを生成するアルゴリズムが機能します。 赤い矢印は強気方向、青い矢印は弱気方向です。 トレンドの方向には敏感な価格変動ラインが描かれ、小さな矢印のシグナルと連動します。 シグナルは次のように機能します。適切なタイミングでラインが現れるとエントリーシグナルが形成され、ラインが開いている間はポジションが保持され、完了すると取引が終了します。 推奨される動作時間枠はM1~H4です。 矢印は現在のローソク足に形成され、次のローソク足が開いている場合は、前のローソク足の矢印は再描画されません。 入力パラメータ Trend Wave Period - トレ
作者のその他のプロダクト
Donchian Pro
Paulo Henrique Faquineli Garcia
4.75 (4)
The Donchian Channel Channels are among the most popular tools of technical analysis, as they visually convey to the analyst the limits within which most price movement tends to occur. Channel users know that valuable information can be obtained at any time, whether prices are in the central region of a band or close to one of the border lines. One of the best known techniques to explore these concepts is Bollinger Bands. However, John Bollinger was not the only one to research the application
FREE
Midas VWAP
Paulo Henrique Faquineli Garcia
4 (2)
Volume Weighted Average Price (VWAP) is a trading benchmark commonly used by Big Players that gives the average price a Symbol has traded throughout the day. It is based on both Volume and price. This indicator contains Daily VWAP and MIDAS' VWAP, which means you are able to anchor the beggining of MIDAS' calculations and, therefore you will be able to use this methodology to study price versus volume moves after anchor point. You will be able to anchor up to 3 HIGH MIDAS VWAP's and 3 LOW. Wish
FREE
Renko Ultimate
Paulo Henrique Faquineli Garcia
3.5 (2)
This indicator creates the perfect RENKO for you to work with timeless types of Candles! Due to RENKO characteristics of timeless, the indicator adjusts trading arrows (otherwise they would be lost) and leaves them exactly where the negotiation occurred in Renko Candles! In addition, this indicator shows exactly the division between days, in order to make it clear to user where each trading session started and ended! Important details: The automatically generated RENKO has an accuracy of up to
VolumeFlow
Paulo Henrique Faquineli Garcia
5 (2)
VolumeFlow is a Volume Accumulation / Distribution tracking indicator. It works in a similar way to OBV, but it is much more refined and includes the options to use: Classical Approach = OBV; Useful Volume Approach; Gail Mercer's approach; Input Parameters: Input Parameters: Approach Type: Explained above; Volume Type: Real or Ticks; Recommendations: Remember: The TOPs or BOTTONS left by the indicator are good Trade Location points. This is because the players who were "stuck" in these regions w
FREE
VolProfile PRO
Paulo Henrique Faquineli Garcia
For those who need a Volume Profile / Market Profile indicator, here is the solution! It contains the essential information: Control Point (POC); Higher Value Area (VAH); Lower Value Area (VAL); You can choose to SHOW or NOT SHOW the volume Histogram, according to your wish. If you choose to show the histogram, note that according to the type of asset, it is necessary to adjust the scale of the indicator (last parameter of the indicator). You can also choose from the data source of your hist
Rejection Zones
Paulo Henrique Faquineli Garcia
Este poderoso indicador analisa o gráfico e mostra zonas de Rejeição de Preços! Isto é, locais onde o preço foi, mas não foi aceito pelo mercado! A visualização desta zona de Rejeição, facilita o entendimento do trader na tomada de decisões de onde operar e como operar! O indicador é composto por 4 linhas, sendo classificadas em 2 grupos: Linhas Vermelha e Amarela: Denotam os extremos onde o preço conseguiu chegar, mas não foi aceito! Linhas Laranja e Azul: A partir delas, denotam o Início da z
FREE
ColoredMA
Paulo Henrique Faquineli Garcia
4.5 (2)
Média Móvel que possui todos tipos de Cálculo comum: Simples Exponencial Suavizada Ponderada Conta com suporte para aplicação sob outros indicadores! Seu principal diferencial é o esquema de cores em GRADIENTE que, de acordo com a mudança no ângulo da média, altera suas cores conforme demonstrado nas imagens abaixo. Com isso, espera-se que o usuário tenha uma percepção mais suavizada das pequenas alterações. Bons trades!!
FREE
VWAPBands
Paulo Henrique Faquineli Garcia
This indicator calculates the Daily VWAP and projects its Bands in 3 upper levels and 3 lower levels (Supports and Resistances), offset by the Standard Deviation selected by the user. How to configure: Choose the symbol and the desired graphic time; Choose the type of price that is most suitable to calculate the Desired VWAP; Choose whether or not you want the Bands to be plotted; Choose the type of Volume you want to use (Ticks or Real); Choose the type of Calculation of the Bands (Deviation
EchoCardiogram
Paulo Henrique Faquineli Garcia
This indicator allows you to monitor and correlate several assets simultaneously. Using an operational reading technique applied in Multimarkets, the user is able to observe the behavior of other assets visible to the current asset that is operating. With this, the user's ability to make decisions becomes more robust and grounded. The indicator has the capacity to list up to 4 assets, with the possibility, also, to change the type of quote and be used both for the current price and the past pr
Will Spread
Paulo Henrique Faquineli Garcia
The Larry Wiliams' indicator named WillSpread considers the influence of the secondary Asset (Symbol) on the current Asset (trading). Indicator essence is to transform the correlation between assets in accumulated history data, providing an opportunity to detect various peculiarities and patterns in price dynamics which are invisible to the naked eye. Based on this information, traders can assume further price movement and adjust their strategy accordingly. As exposed on his Book, Larry says: "a
VolumeCapacitor
Paulo Henrique Faquineli Garcia
Designed by Fábio Trevisan, VolumeCapacitor is an indicator that, in addition to showing the volume quantity, shows its direction, having as main characteristic, the possible price tops and bottoms, or pullback areas. With its simple but not simplistic calculation method, it is able to determine areas where the defense of long and short positions can be assessed with a simple observation. VolumeCapacitor uses in its unique formula the OBV (Balance of Volume, or On-Balance Volume) idealized by J
ATR SuperTrend
Paulo Henrique Faquineli Garcia
A ‘Supertrend’ indicator is one, which can give you precise buy or sell signal in a trending market.  As the name suggests, ‘Supertrend’ is a trend-following indicator just like moving averages and MACD (moving average convergence divergence). It is plotted on prices and their placement indicates the current trend. The Supertrend indicator is a trend following overlay on your trading chart, much like a moving average, that shows you the current trend direction. The indicator works well in a tren
SuperRenko
Paulo Henrique Faquineli Garcia
This indicator creates the perfect RENKO for you to work with timeless types of Candles! Due to RENKO characteristics of timeless, the indicator adjusts trading arrows (otherwise they would be lost) and leaves them exactly where the negotiation occurred in Renko Candles! In addition, this indicator shows exactly the division between days, in order to make it clear to user where each trading session started and ended! Furthermore, the following indicators were added, giving you bigger analysis p
Volume Waves
Paulo Henrique Faquineli Garcia
One of the best tools for analyzing volume, Weis Wave was devised by David Weis to facilitate reading the directional flow. For the disciples of the Wyckoff method, this means an evolution, facilitating a predictive reading of the market, always looking for Accumulation and Distribution zones for traded assets. For better understanding, in this indicator we try to cover every reading of EFFORT (traded volume) versus RESULT (price change). Thus, you can apply the indicator on the chart twice to
Auto Midas VWAP
Paulo Henrique Faquineli Garcia
AUTO MIDAS VWAP Volume Weighted Average Price (VWAP) is a trading benchmark commonly used by Big Players that gives the average price a Symbol has traded throughout the day. It is based on both Volume and price. Commonly, MIDAS VWAP damand you to determine the initial point of analysis. This indicator plots automatically based on ZigZag Approach. You will be able to use up to 3 HIGH MIDAS VWAP's and 3 LOW MIDAS VWAP's. Wish the best trade results!!
LongShort Cointegration
Paulo Henrique Faquineli Garcia
Long & Short Based on Cointegration Statistical and Quantitative Long-Short (Pair Trading) approach for long and short positions. Your CPU will always be safe and stable when using Multiple Linear Regression if you have a reliable indicator. Based on the results of this indicator, you can execute a long and short or a long and long/short and short trade between two separate assets. It can show you a Highly informative dashboard based on Cointegration Search you determine, with all statistical d
LongShort by Cointegration
Paulo Henrique Faquineli Garcia
Be aware that standard parameters are not a recommendated inputs! You should analyze and determine your own parameters for Long&Short trades! Long   &   Short   Based   on   Cointegration Statistical and Quantitative Long-Short (Pair Trading) approach for long and short positions. Your CPU will always be safe and stable when using Multiple Linear Regression if you have a reliable Expert Advisor. Based on the results of this indicator, you can execute a long and short or a long and long/short an
フィルタ:
AGUINALDO TENORIO
33
AGUINALDO TENORIO 2021.11.17 20:50 
 

ユーザーは評価に対して何もコメントを残しませんでした

Paulo Henrique Faquineli Garcia
16253
開発者からの返信 Paulo Henrique Faquineli Garcia 2021.11.18 00:43
Olá Aguinaldo Isso depende da base de dados que sua corretora disponibiliza para a Plataforma MT5. Tente mudar de corretora e mudar o tipo de volume de Tick para Real. Com certeza esses passos vão solucionar seu problema. Até!
Wellice Barbosa
31
Wellice Barbosa 2021.11.05 23:51 
 

ユーザーは評価に対して何もコメントを残しませんでした

Raphael Araujo
38
Raphael Araujo 2021.08.20 19:16 
 

ユーザーは評価に対して何もコメントを残しませんでした

WilliansCampos
14
WilliansCampos 2021.06.05 04:33 
 

ユーザーは評価に対して何もコメントを残しませんでした

レビューに返信