Next Move
- インディケータ
- バージョン: 1.0

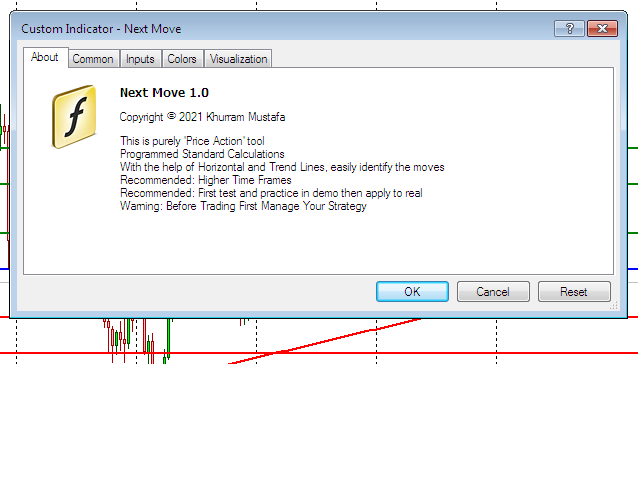
WHAT IS NEXT MOVE?
SIMPLE ANSWER IS, THIS PROGRAM IS BASED ON PRICE ACTION THEREFORE FINDING NEXT MOVE IS EASY TO IDENTIFY
THIS PROGRAM IS USING STANDARD CALCULATIONS FOR SUPPORT RESISTANCE IN SHAPE OF 2 WAYS
- TREND LINES SELECT
- HORIZONTAL LINES
TREND LINES WILL GUIDE TRADERS TO TRADE IN RANGE WITH PIVOT LEVEL ALSO
HORIZONTAL LINES GUIDE YOU ABOUT SUPPORT RESISTANCE OF DIFFERENT TIMEFRAMES
FOR EXAMPLE:
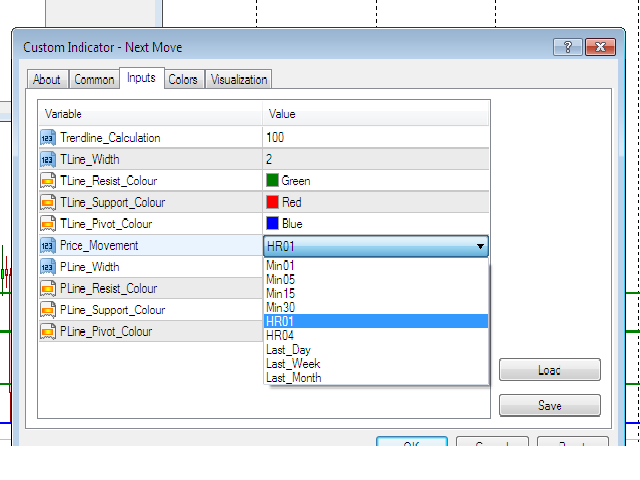
IF TRADER INTERESTED TO TRADE IN 15 MINUTES TIME FRAME, THEN HE CAN SELECT 15 MINUTES IN PRICE MOVEMENT SELECTION BY SETTING BUT THIS IS NOT ENOUGH, SAME TRADER CAN VIEW MULTIPLE SUPPORT & RESISTANCE WITH THE HELP OF SELECTING DIFFERENT TIMEFRAMES.
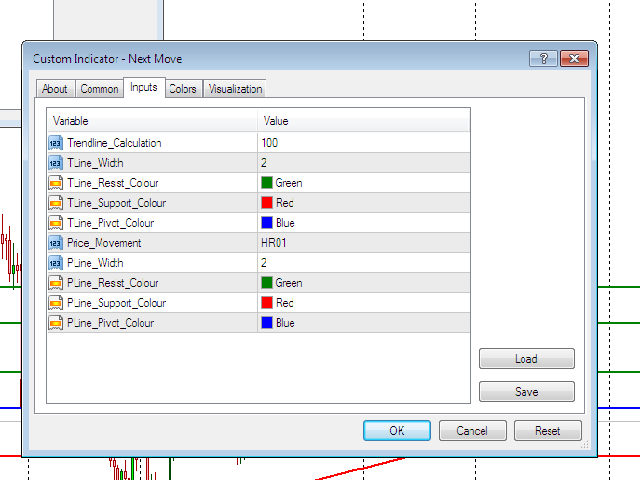
BY DEFAULT THE SETTINGS ARE:
- TRENDLINES CALCULATION AS PER 100 PERIOD (TRENDLINES CAN BE CALCULATED AS PER TRADER REQUIREMENT)
- HORIZONTAL LINES CALCULATION AS PER 01 HOUR (PRICE MOVEMENTS CAN BE SELECTED FROM 01 MINUTE - 01 MONTH)
TRADER CAN CHANGE THESE SETTING AS PER HIS/HER REQUIREMENTS
HOW TO TRADE:
- VERY IMPORTANT TO UNDERSTAND BUT SO SIMPLE WAY TO TRADE
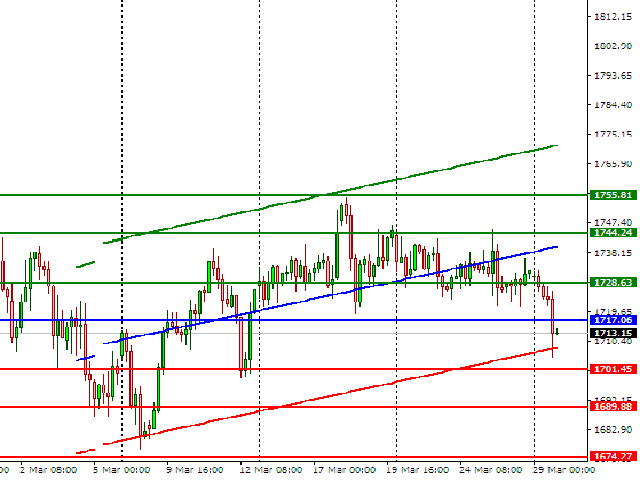
- ANY UP OR DOWN HAVE A MIDDLE POINT WHICH WE CALL PIVOT LEVEL
- IN DEFAULT SETTING PIVOT LEVELS OR MIDDLE POINT IS IN BLUE COLOUR
- AFTER MARKET OPENS, WHEN THE PRICE CLOSES ABOVE BLUE LINE, TRADER MAY ENTER WITH BUY POSITION
- AFTER MARKET OPENS, WHEN THE PRICE CLOSES BELOW BLUE LINE TRADER MAY ENTER WITH SELL POSITION
- REMEMBER, THE SELECTION OF PRICE MOVEMENT (BY SETTINGS) IS VERY IMPORTANT
- THE MIDDLE LEVEL IS MOVING WITH PRICE CLOSES SO ONCE YOU ENTER MARKET THE YOU CAN USE PIVOT LEVEL FOR TAKE PROFIT OR TRAILING STOP
- STOP LOSS MAY BE SUPPORT FIRST LINE FOR BUY POSITION & RESISTANCE FIRST LINE FOR SELL POSITION
WISH YOU BEST OF LUCK
RECOMMENDATION:
- 1- FIRST TEST IT IN DEMO AND THEN APPLY TO REAL (FEW HOURS ENOUGH FOR UNDERSTAND & 01 DAY IS ENOUGH FOR TESTING)
- 2- ALWAYS MANAGE YOUR CASH AS PER YOUR DEPOSIT
- 3- TRY TO TRADE IN HIGH TIMEFRAMES BECAUSE THERE IS A CHANCE TO GAIN MORE AND CAN MANAGE GOOD STOPLOSS & TAKE PROFITS
WARNING: TRADE WISELY. REMEMBER YOU MAY LOSE MORE THAN YOU INVESTED


This is a great indicator. I can't believe it's free. It's simple and intuitive. However, I don't understand the meaning of the blue line in the middle and how to use it.