SP Market Profile MT5
- インディケータ
- バージョン: 1.2
- アクティベーション: 5

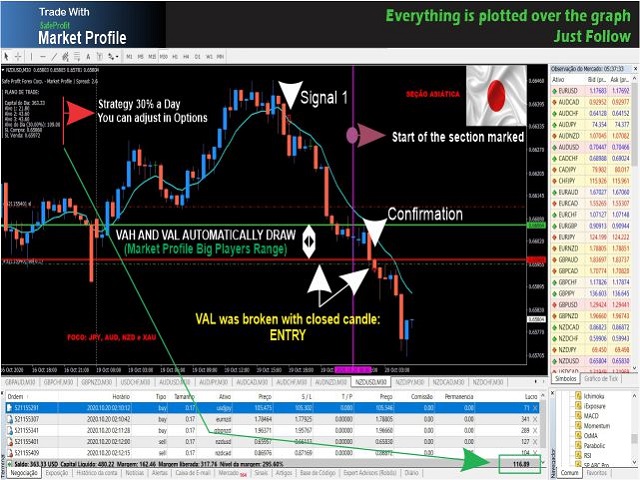
SafeProfitマーケットプロファイルは、外国為替市場で最も先進的な追跡指標です。これは、その日の各セッション(アジア、ヨーロッパ、アメリカ)の市場プロファイルを追跡するために開発されました。 このインジケーターを使用すると、日中の笑顔で操作できます...ビッグプレーヤーが配置されている場所と彼らが行く正確な瞬間を正確に知ることができます。 インジケーターはシンプル、高速、客観的で、ビッグプレーヤーのあらゆる動きを価格で追跡します。 コンピューターサイエンティスト、ソフトウェアエンジニア、金融市場スペシャリストのJonathas Rodriguesによって開発されたこのセンセーショナルなツールを失うだけの95%の統計から抜け出し、使用してください。 何も設定する必要はありません...それをチャートに追加し、ろうそくを閉じて休憩を待つだけです。 時間枠:30M。
SafeProfit mākettopurofairu wa, gaikoku kawase ichiba de mottomo senshin-tekina tsuiseki shihyōdesu. Kore wa, sonohi no kaku sesshon (Ajia, yōroppa, Amerika) no ichiba Purofairu o tsuiseki suru tame ni kaihatsu sa remashita. Kono injikētā o shiyō suru to, Nitchū no egao de sōsa dekimasu... Biggupurēyā ga haichi sa rete iru basho to karera ga iku seikakuna shunkan o seikaku ni shiru koto ga dekimasu. Injikētā wa shinpuru, kōsoku, kakkanteki de, biggupurēyā no arayuru ugoki o kakaku de tsuiseki shimasu. Konpyūtāsaientisuto, sofutou~eaenjinia, kin'yū ichiba supesharisuto no Jonathas Rodrigues ni yotte kaihatsu sa reta kono sensēshonaruna tsūru o ushinau dake no 95-pāsento no tōkei kara nukedashi, shiyō shite kudasai. Nani mo settei suru hitsuyō wa arimasen... Sore o chāto ni tsuika shi, rōsoku o tojite kyūkei o matsu dakedesu. Jikan-waku: 30 M.
SafeProfit Market Profile Metatrader 4: https://www.mql5.com/en/market/product/56346